
Organizations can now accelerate innovation and reduce the risk of failed software releases by incorporating on-demand synthetic monitoring as a metrics provider for automatic, continuous release-validation processes. With this approach, teams can scale testing for all environments, which reduces efforts in replicating, updating, and maintaining test scripts. No external tools or additional configurations are needed. Dynatrace relies on Davis® AI to identify the root cause of issues found via Dynatrace Synthetic Monitoring-powered pre-production and production release validation. This significantly accelerates release cycles, reduces time to market, prevents unexpected disruptions, and lowers costs by catching issues early in the software development lifecycle (SDLC).
The ability to scale testing as part of the software development lifecycle (SDLC) has proven difficult. It negatively affects the lead time for changes (LT), a DORA metric1 that DevOps teams use to measure platform and team performance. This metric indicates how quickly software can be released to production.
Utilizing a collection of tools for synthetic CI/CD testing can identify an issue while still leaving DevOps and SRE teams responsible for root cause analysis, which they often have to perform manually. Consequently, finding the root cause and fixing the problem is time-consuming and tedious because proper root cause analysis isn’t possible for diverse tool stacks.
Missing integration with Dynatrace Real User Monitoring (RUM) for canary releases and blue/green deployments can leave teams blind to customer experience.
Last but not least, traditionally, testing occurred relatively late in the SDLC, which boosts the cost of every identified vulnerability.
Dynatrace combines Synthetic Monitoring with automatic release validation for continuous quality assurance across the SDLC
Dynatrace customer Duke Energy utilizes synthetic on-demand execution capability.
“We don’t have to wait 5, 15, or even 60 minutes” states Travis Anderson, Application Performance Management at Duke Energy. Dynatrace Synthetic Monitoring on-demand execution allows us to “repurpose“ the existing synthetic monitors we use for continuous production validation for our automated release validation of new deployments. This “eliminates the need” to invest in additional release validation testing and “saves time” as we get instant feedback and don’t have to wait for the next test cycle to kick in.
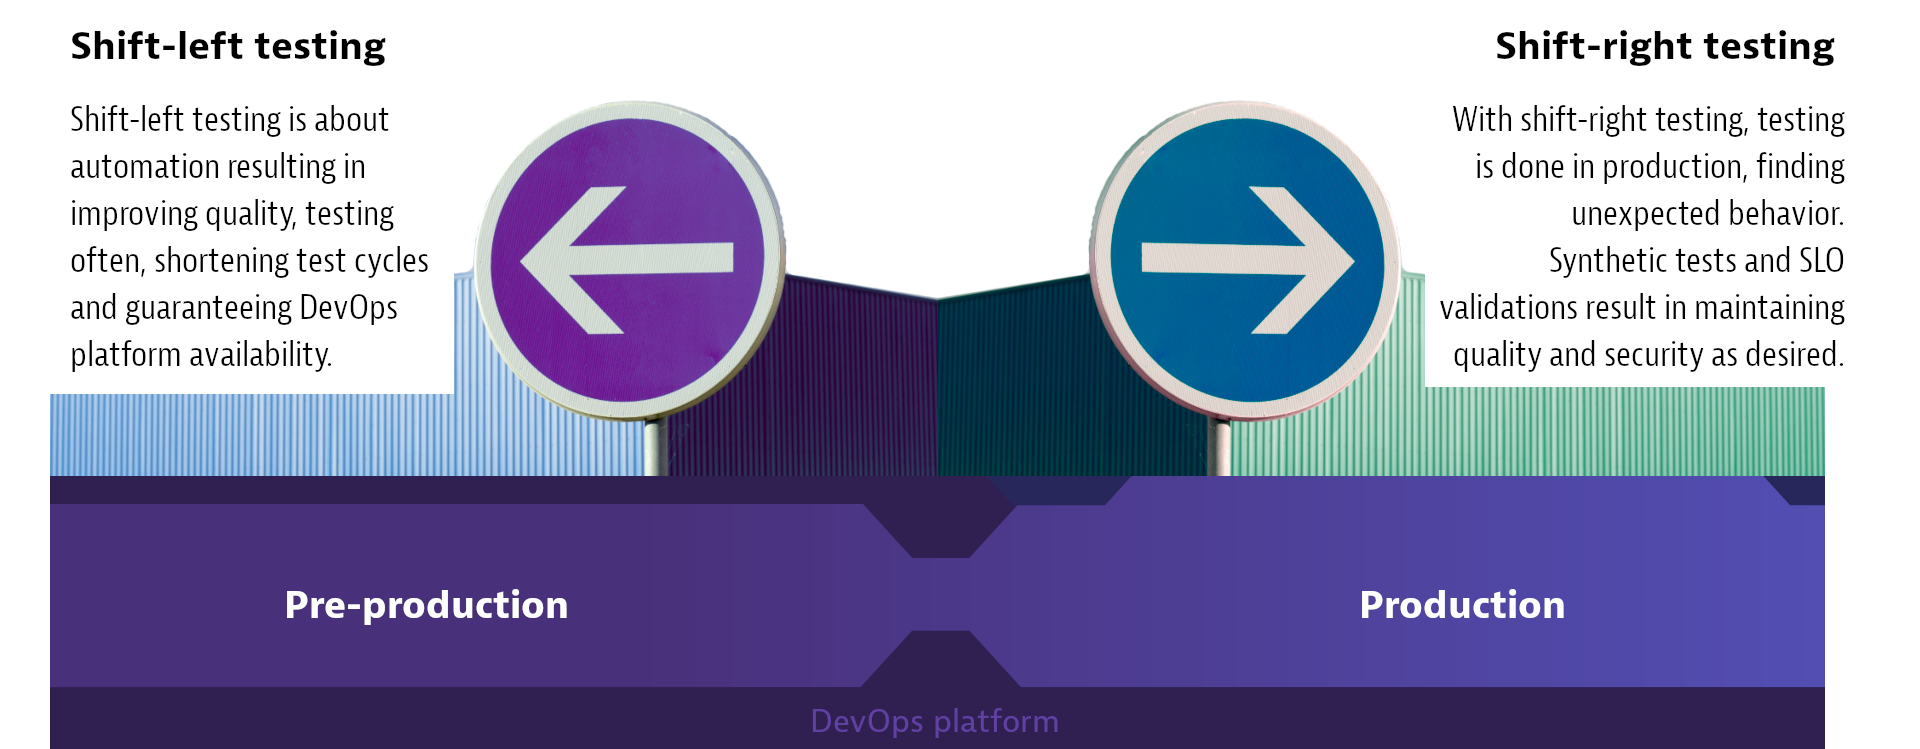
DevOps best practices include testing within the CI/CD pipeline, also known as shift-left testing. Running tests early and often helps DevOps teams catch issues before they impact users.
Synthetic CI/CD testing simulates traffic to add an outside-in view to the analysis. It emulates user journeys (clickpaths), as well as HTTP(S) API requests, to provide insights into how well applications or services are performing at every stage of the development process. This 360-degree visibility into user journeys and the underlying applications or infrastructure are key insights provided only by Dynatrace.

In combination with release validation, synthetic monitors measure adherence to service-level objectives (SLOs) to determine whether software versions should progress in the SDLC. Synthetic-powered release validation can be executed continuously, for example, with every commit, providing ongoing information about software quality.
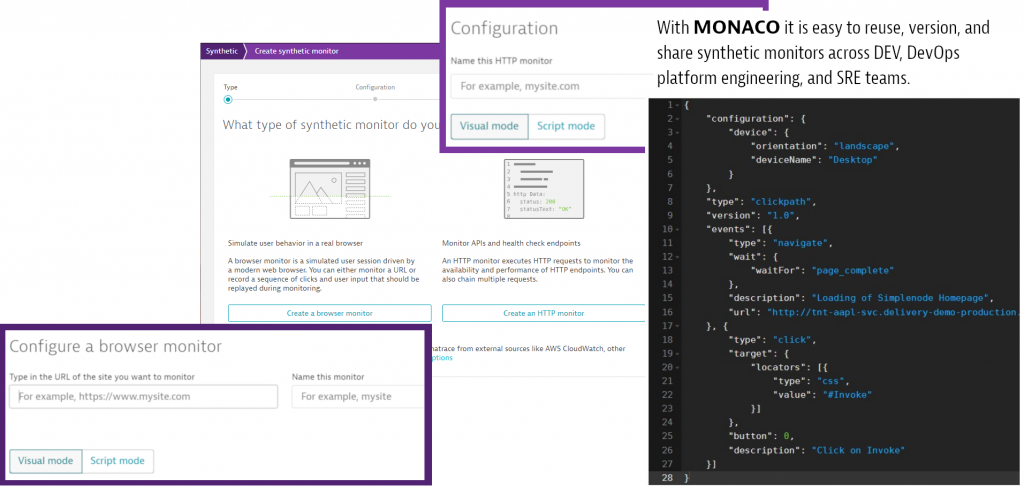
Synthetic monitors can be created with our innovative web recorder or through MONACO, our Monitoring-As-Code approach. Facilitating both practitioner groups—those commonly working with UIs and dashboards and those working with the GitOps approach.
With Dynatrace you can create Synthetic Monitoring powered release validations via either our web UI or the GitOps approach with MONACO.
MONACO enables development teams to define monitoring configuration as code that is checked into version control alongside application source code. This enables configurations such as SLOs, alerts or dashboards, and synthetic monitors to be changed and managed alongside an application’s source code.
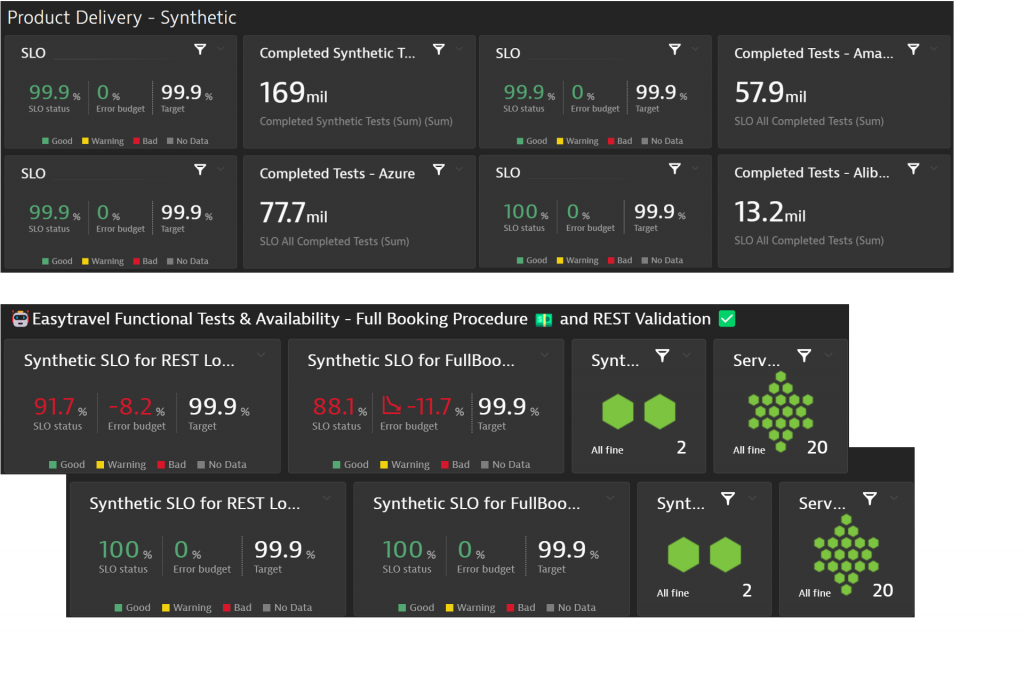
SREs visualize the state of the system they’re responsible for with powerful Dynatrace dashboards. With Dynatrace Cloud Automation and synthetic monitors, SREs can now rely on continuous validation of SLOs, presentation of the root cause when validation fails, and automatic problem remediation.
The Dynatrace Software Intelligence Platform provides a fully integrated approach for synthetic CI/CD testing and pipeline automation
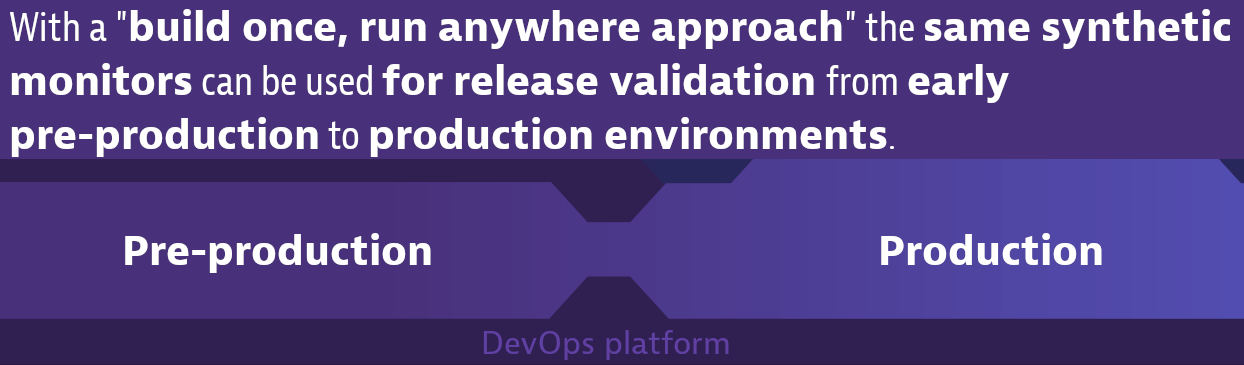
- Synthetic monitors for single-page views, multistep user journeys, or API checks can be created without scripting, thanks to our innovative web recorder in the DEM module. With a “Build once, run anywhere approach” the same monitors can be used in early development through to production environments.
- With Dynatrace Cloud Automation—an integrated enterprise control plane—organizations can use synthetic monitoring insights for full lifecycle orchestration of applications, automated release validations with quality gates, and closed-loop remediations for automated problem resolution.
Dynatrace seamlessly combines Synthetic Monitoring with Real User Monitoring for canary releases, blue-green deployments, and production releases. This enables DevOps teams to seamlessly navigate between simulated and real-user journeys. DevOps teams can analyze user behavior analytics and, with Dynatrace Session Replay, video-like replay of individual user sessions.
Dynatrace provides a holistic approach to synthetic CI/CD testing for browser applications with desktop and mobile synthetic devices, leveraging public as well as private locations to cover all applications.
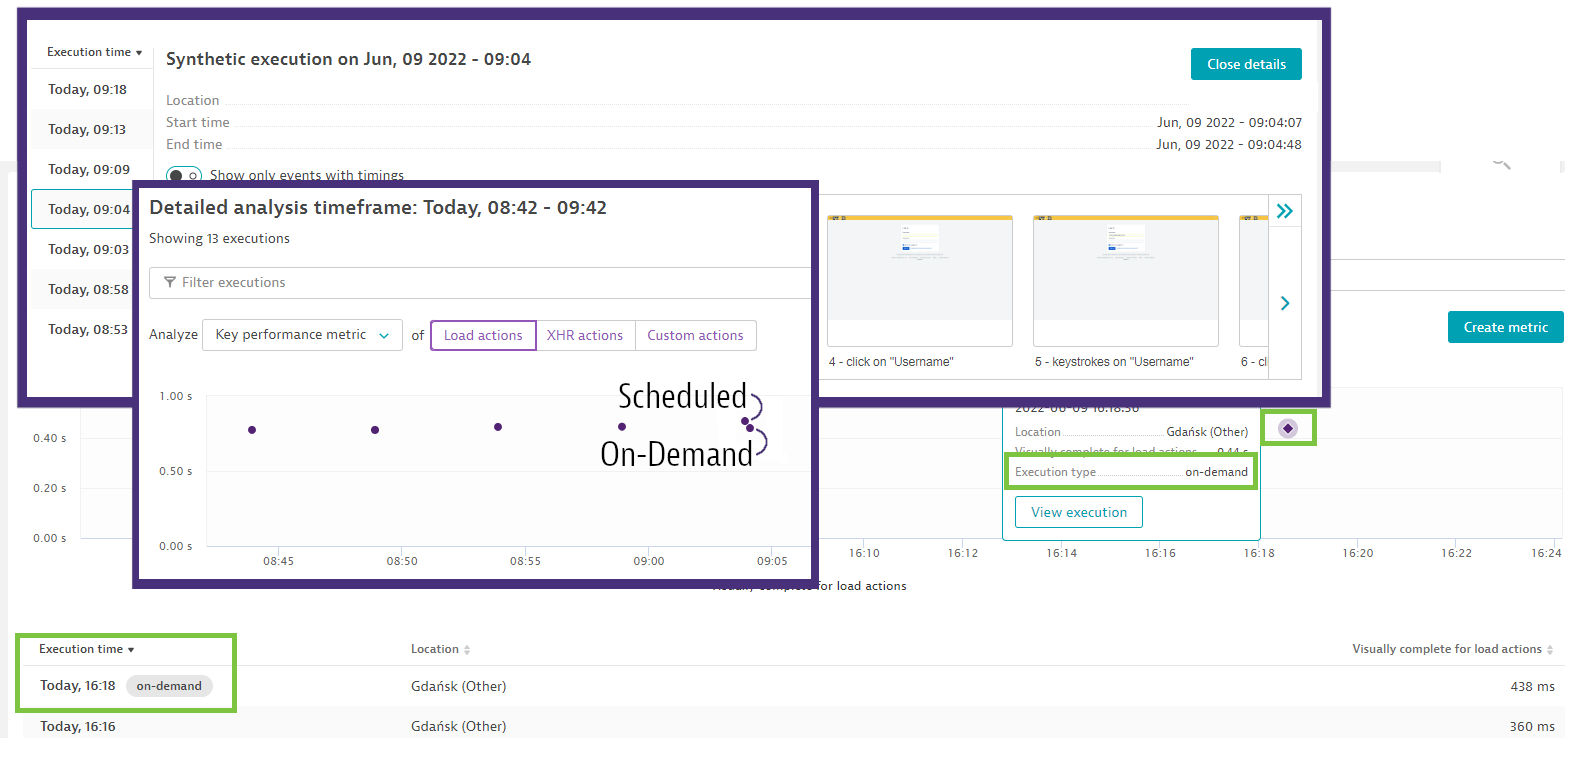
Dynatrace adds annotations to all on-demand monitor executions and thereby captures all related execution overview details (see callouts below). This provides the convenience of easily knowing which monitor executions are scheduled and which are triggered on demand.
Request your Dynatrace Synthetic Monitoring and Cloud Automation demo, or integrate them into your SDLC directly
Dynatrace is happy to provide you with a demo or proof of concept for Cloud Automation. We also offer a free Dynatrace trial if you’d like to get started directly!
Dynatrace customers use metrics provided by our synthetic monitors to ensure that every release is automatically validated by Cloud Automation. This way, our customers ensure the desired state of their software—both in pre-production and production environments.
In production, SREs utilize Cloud Automation to, for example, continuously validate the availability of their applications across the globe from our 80-plus global Synthetic Monitoring locations.
Dynatrace customers achieve faster delivery of software and eliminate manual work in problem resolution. They find more time to drive automation, which makes the software delivery experience more enjoyable and metrics based, which ensures quality and security across their environments—powered by Dynatrace Synthetic Monitoring.
__________
¹ DORA stands for the DevOps Research and Assessment team, a Google-headed project tasked with analyzing DevOps practices. The DORA team’s analysis identified four key DevOps metrics: Deployment frequency, Lead time for changes, Time to restore service, and Change failure rate. See DORA research program for full details.


Looking for answers?
Start a new discussion or ask for help in our Q&A forum.
Go to forum