
In the previous installment of this blog series, we explored how to set up Dynatrace as a build-stage orchestrator to effectively address the challenges faced by Site Reliability Engineers (SREs). In this blog post, we’ll transition to the next pipeline stage, the Deploy stage, and examine the visibility advantages that Dynatrace provides during this critical phase.
Deploy stage
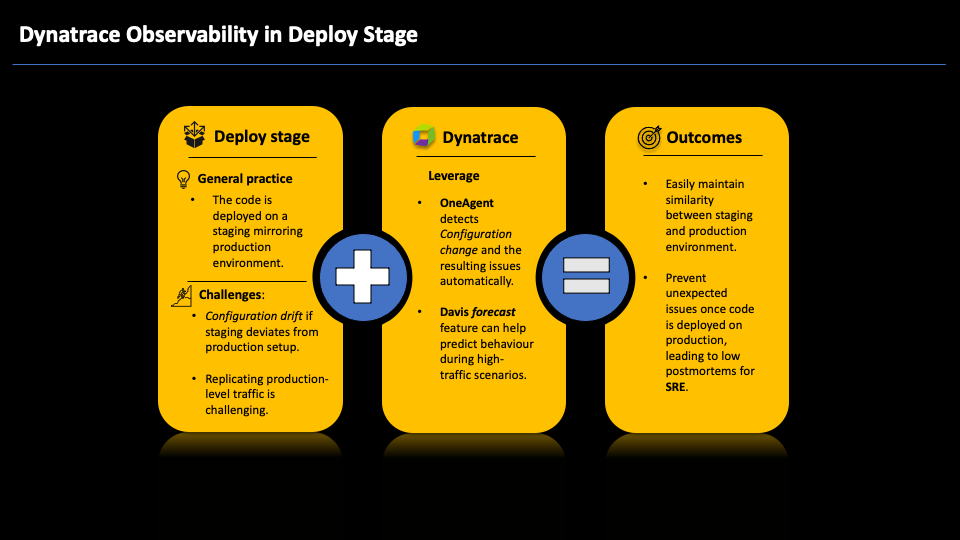
In the deployment stage, the application code is typically deployed in an environment that mirrors the production environment. This step is crucial as this environment is used for the final validation and testing phase before the code is released into production. This stage ensures the code meets the required quality standards before it goes live.
Configuration drift
Configuration drift is a challenge in the deployment stage. Configuration drift occurs when a staging environment’s configuration deviates from the production environment. Such deviations often result from undocumented or un-versioned environmental changes, potentially causing unexpected behavior and production outages upon deployment.
Even when the staging environment closely mirrors the production environment, achieving a complete replication of all potential scenarios, such as simulating extremely high traffic volumes to assess software performance, remains challenging. This can lead to a lack of insight into how the code will behave when exposed to heavy traffic.
Creating a staging environment that faithfully replicates the production setup is crucial to effectively addressing such challenges. Furthermore, augmenting test coverage to mirror the scenarios encountered in production is imperative. These strategies can play a vital role in the early detection of issues, helping you identify potential performance bottlenecks and application issues during deployment for staging. With this approach, you gain increased confidence that a release will succeed when promoted to the production environment.
Leverage OneAgent functionality
Ingesting configuration changes into Dynatrace through the events API call and utilizing OneAgent® to detect configuration changes for supported technologies help maintain close alignment between your staging and production environments. This approach effectively combats configuration drift. Furthermore, the Dynatrace Davis® AI engine can accurately identify whether such changes have resulted in any issues and allows you to roll back configurations if necessary.
By harnessing OneAgent native features, the generated telemetry data can be effectively combined with Davis AI prediction and forecasting capabilities. This enables the prediction of trends that might not have been thoroughly tested due to variations in different environments. This proactive approach proves instrumental in anticipating and mitigating potential performance issues before they result in adverse impacts.
Combat configuration drift
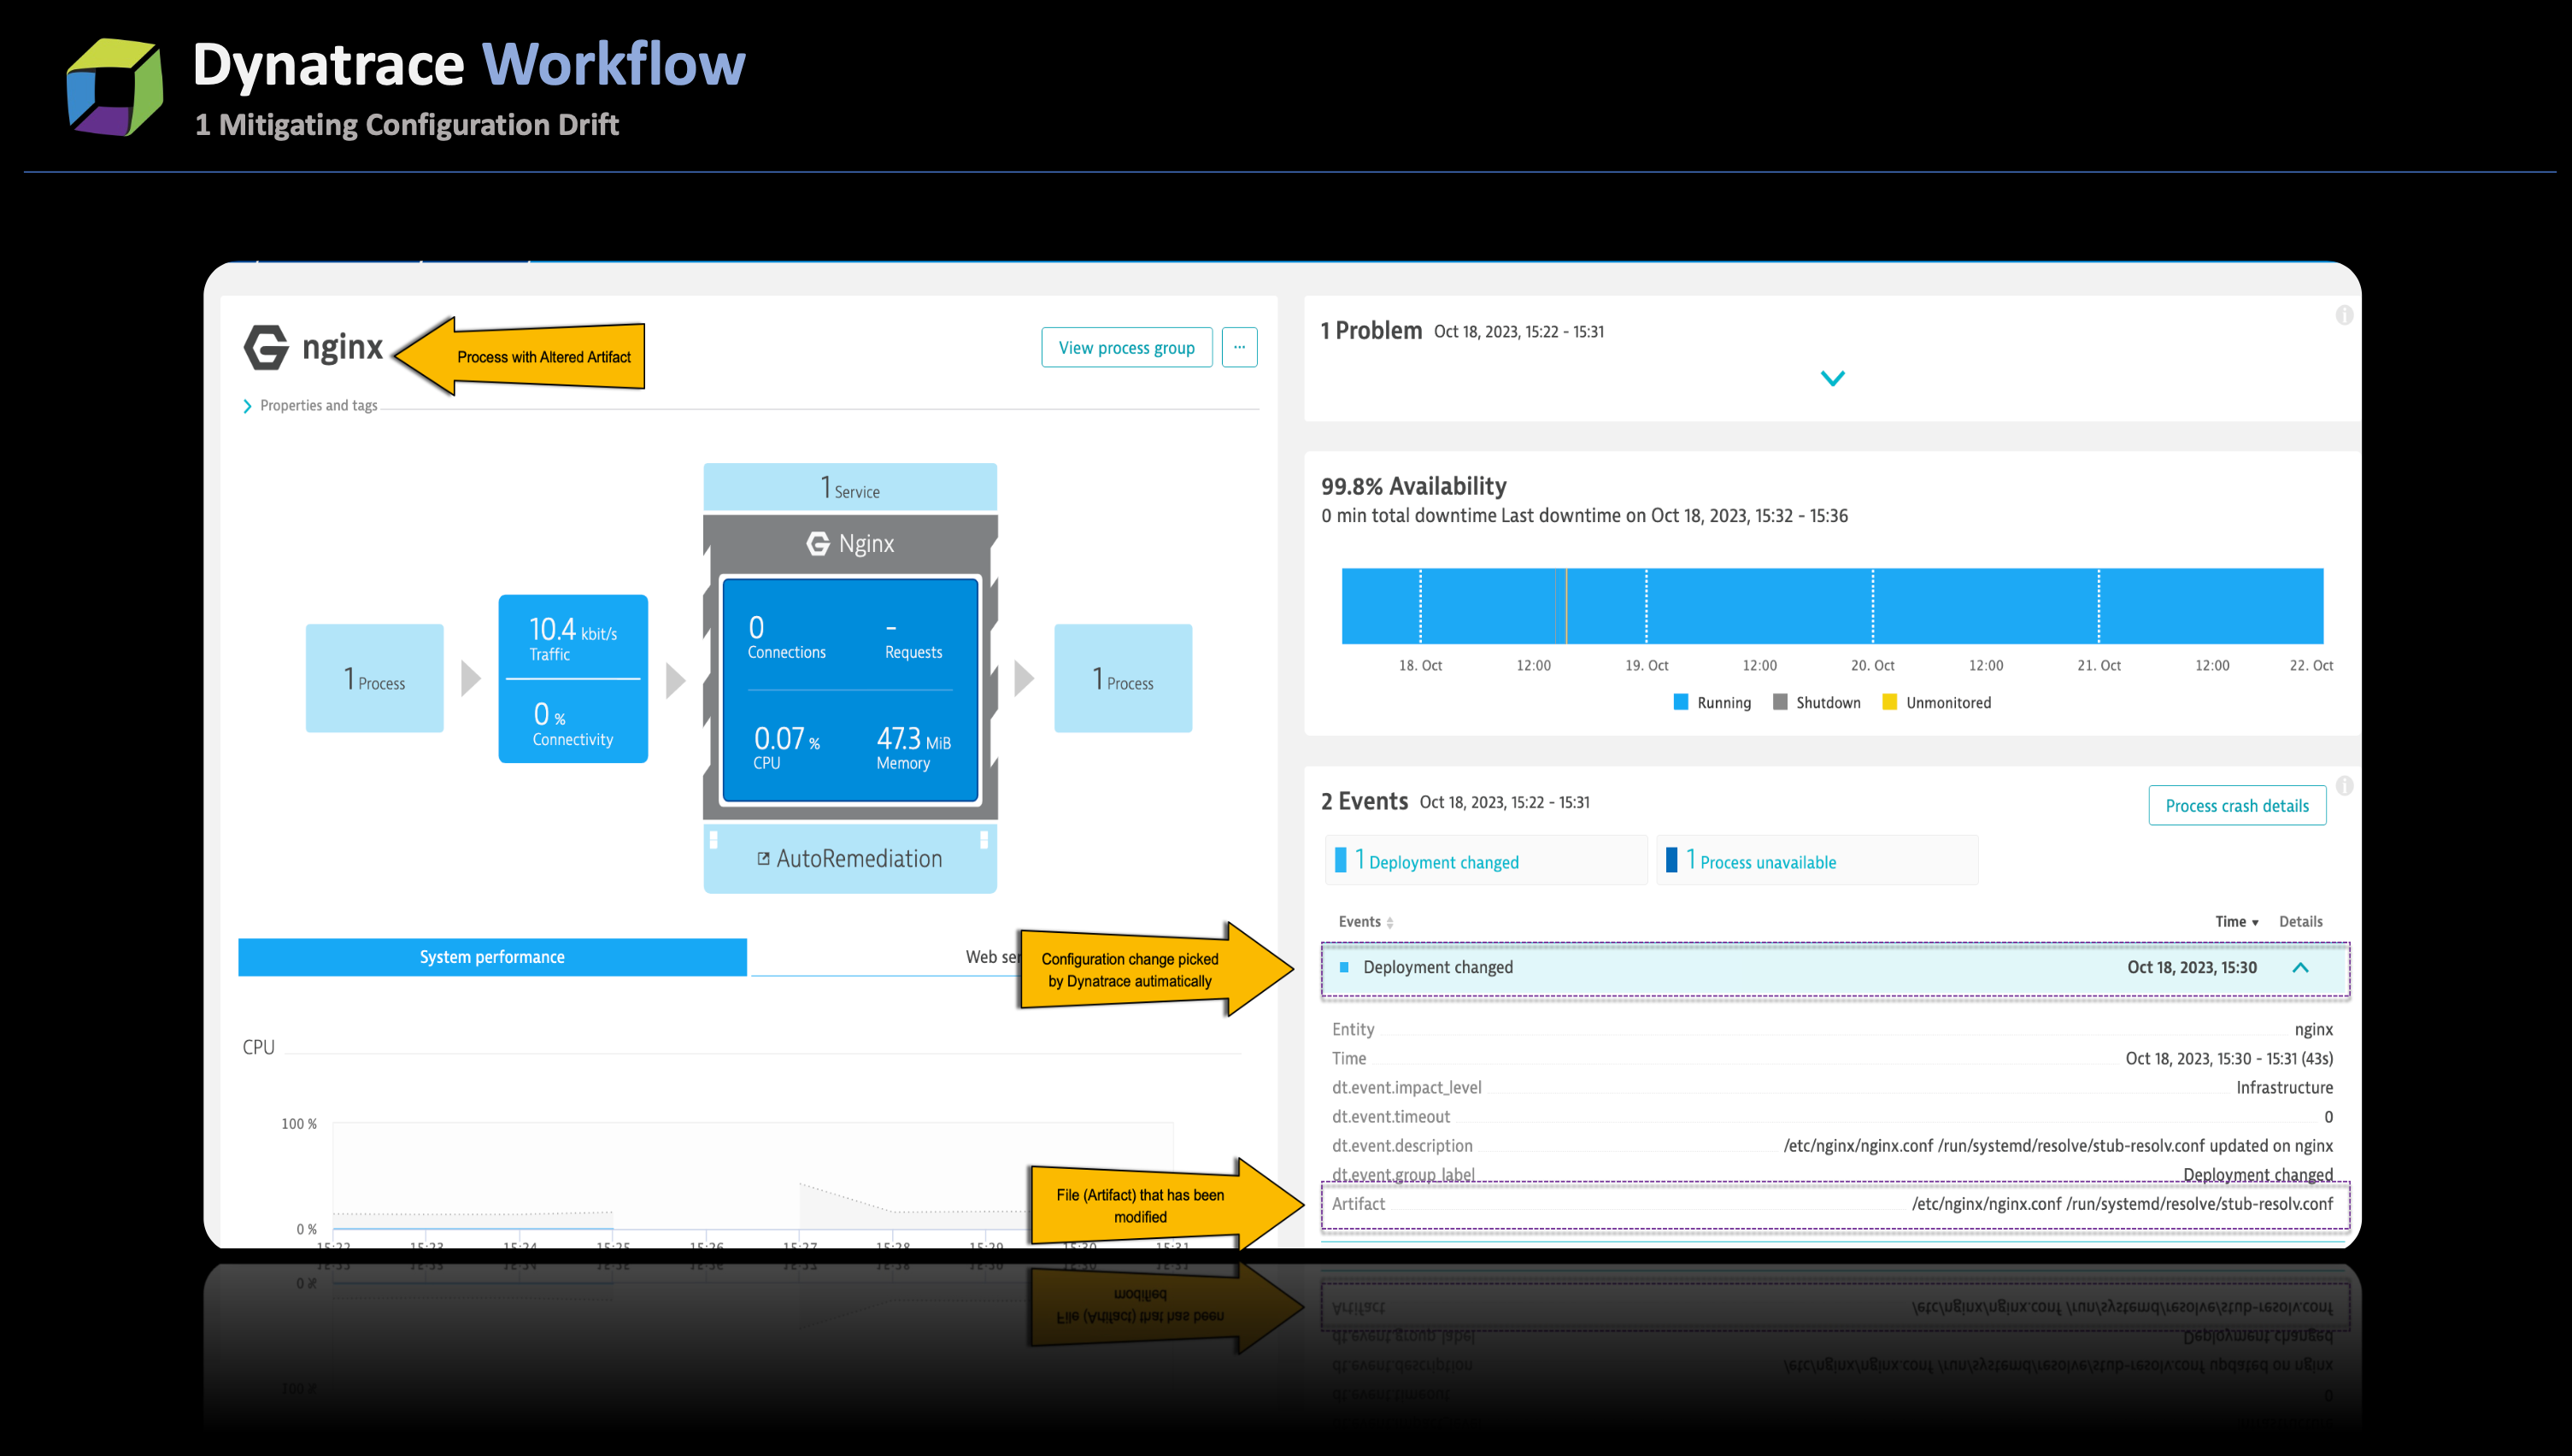
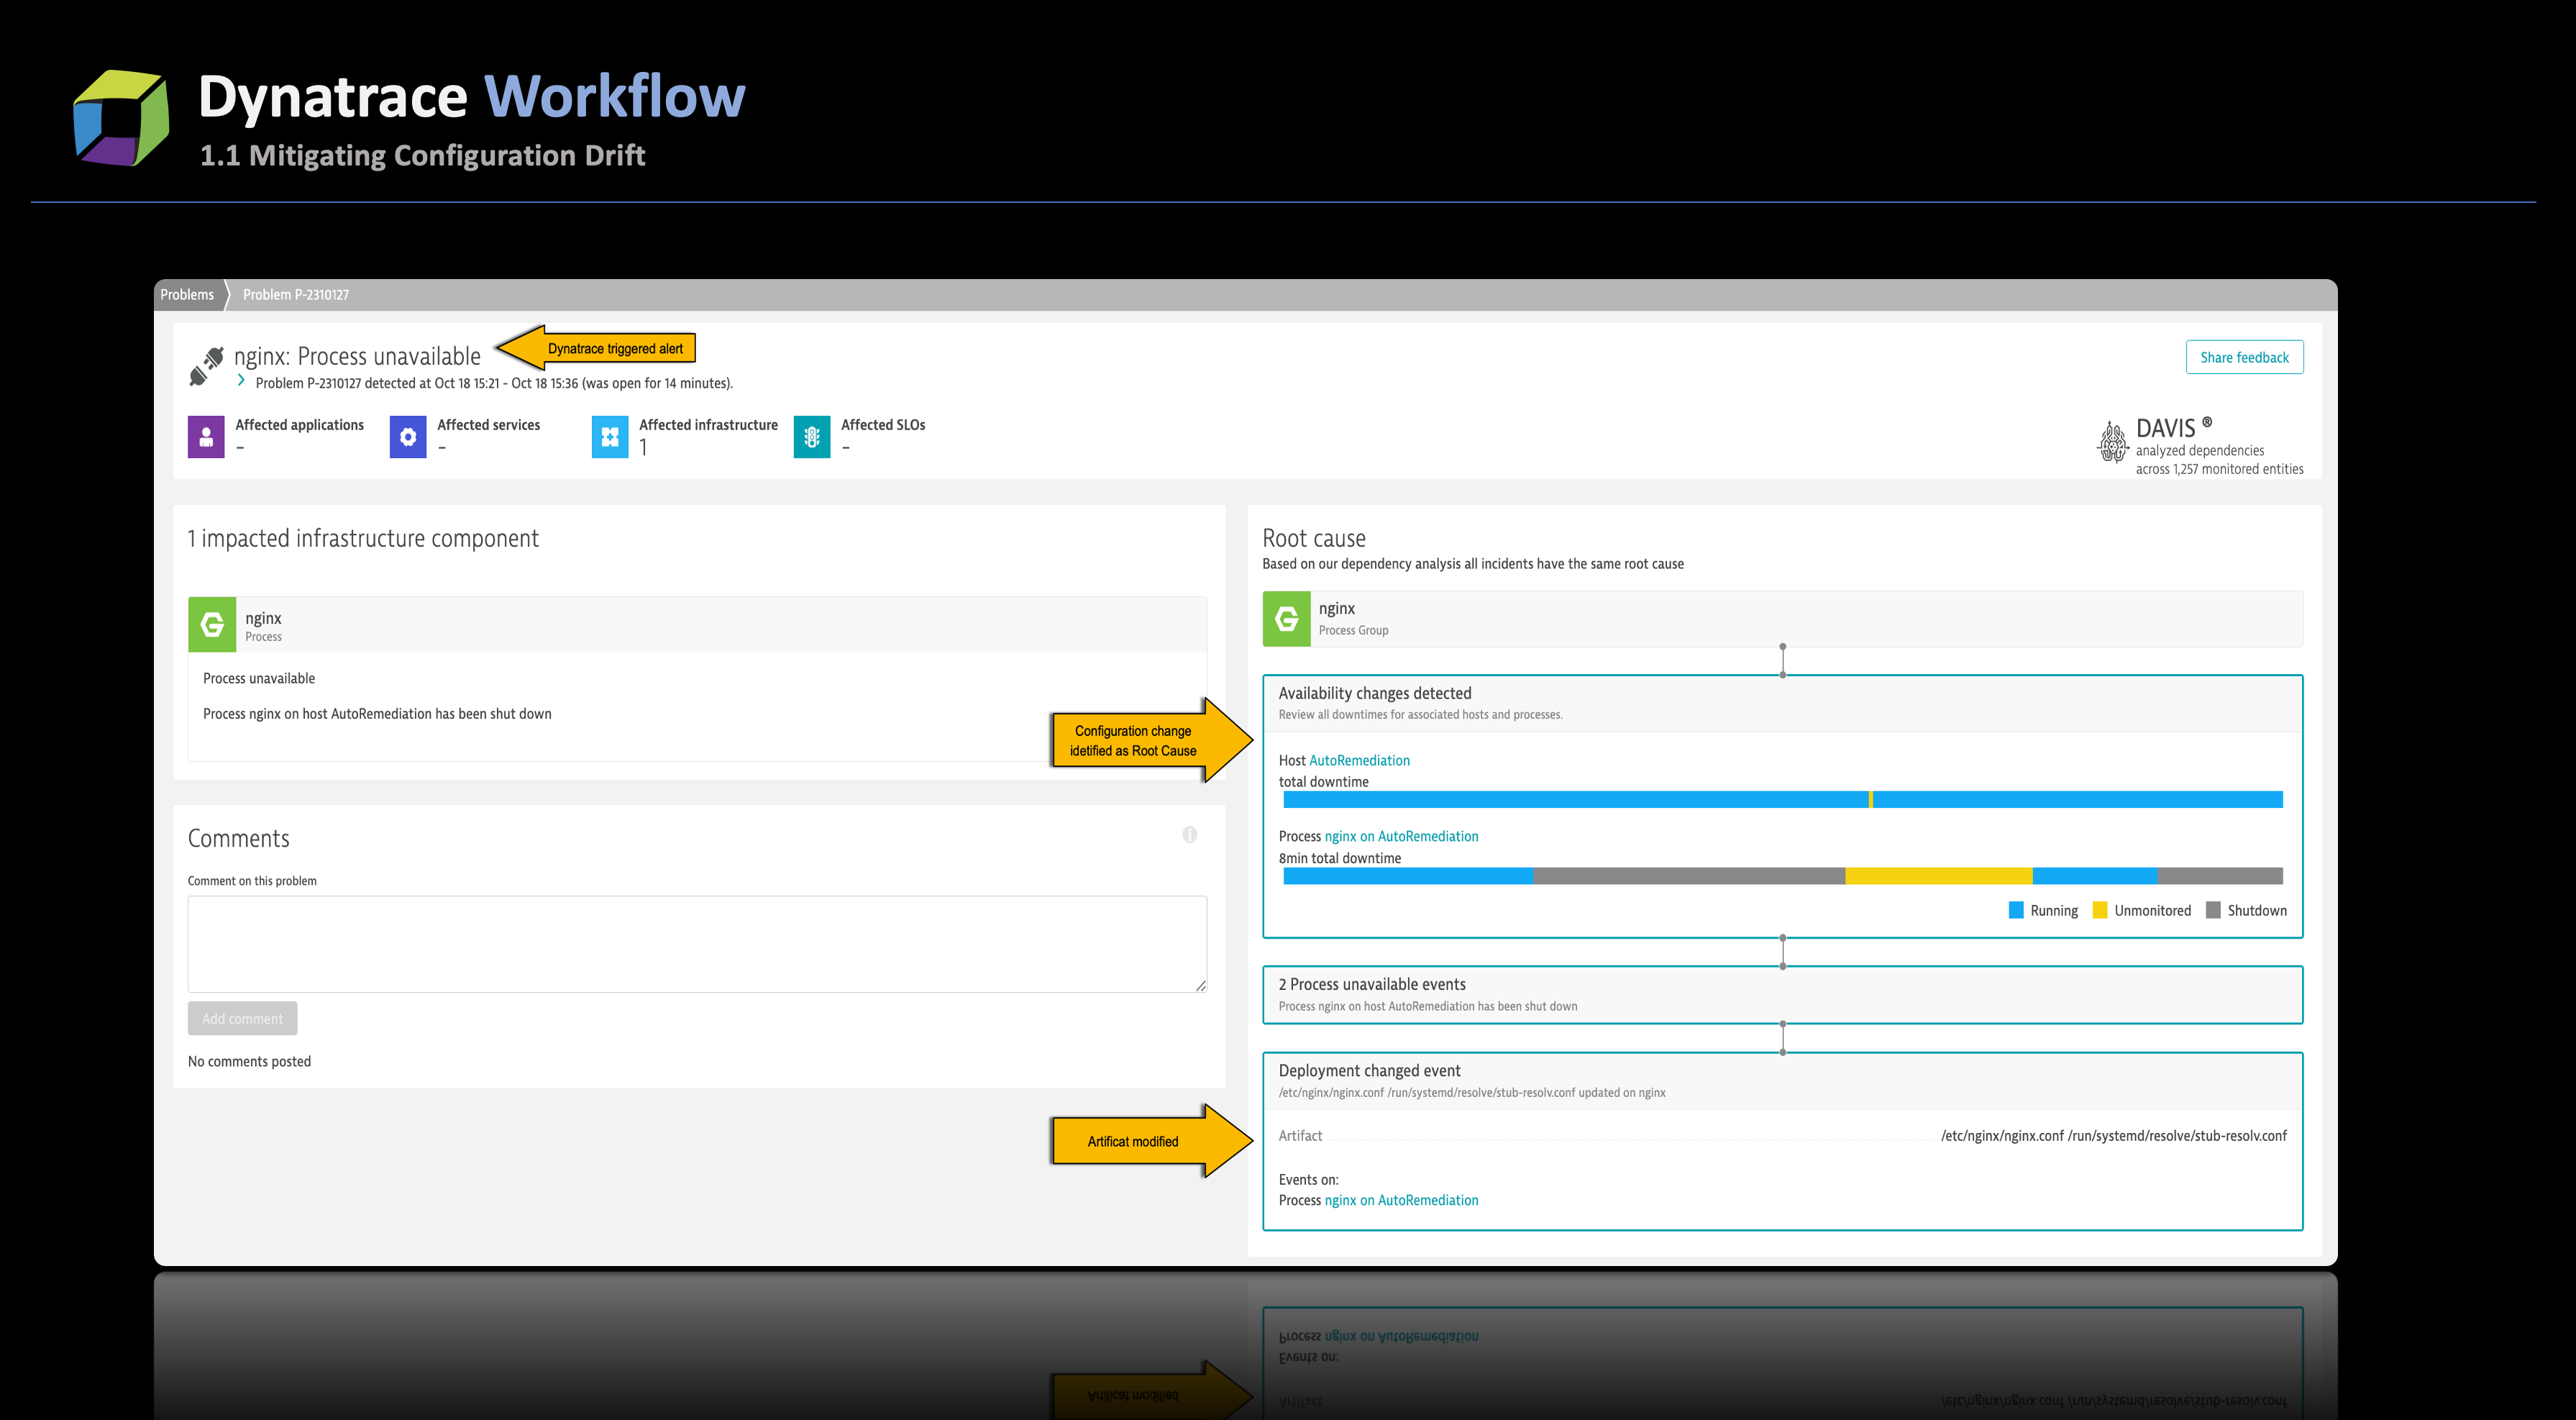
Dynatrace actively tracks modifications to the standard configuration files of supported technologies. Whenever a change is detected, Dynatrace automatically generates a Deployment change event for the corresponding process and the host on which the process runs. The predefined set of files monitored for configuration alterations is maintained within ruxitagentproc.conf. In the event of any incidents stemming from these configuration adjustments, Davis AI utilizes the Deployment change data to pinpoint potential root causes.
As an illustration, in the screenshot below, when a modification was made to the nginx.conf file, Dynatrace promptly detected the configuration change and reported it as a Deployment change event. In this specific instance, the misconfiguration of nginx led to a critical issue where nginx crashed and could not restart, prompting an alert from Dynatrace. Davis AI efficiently identified the deployment change as the potential root cause for the malfunctioning of nginx.
By harnessing these deployment events, SREs can effectively track all configuration changes that have occurred over a specified time. This capability empowers them to replicate the staging environment to match the production setup, proactively combating configuration drift.
Although Dynatrace can detect configuration changes, the best practice is to systematically ingest a configuration change or deployment change event each time the team modifies a configuration file. This approach ensures proper record-keeping and assists in achieving consistency between the staging and production environments, effectively mitigating configuration drift.
Predictive traffic analysis
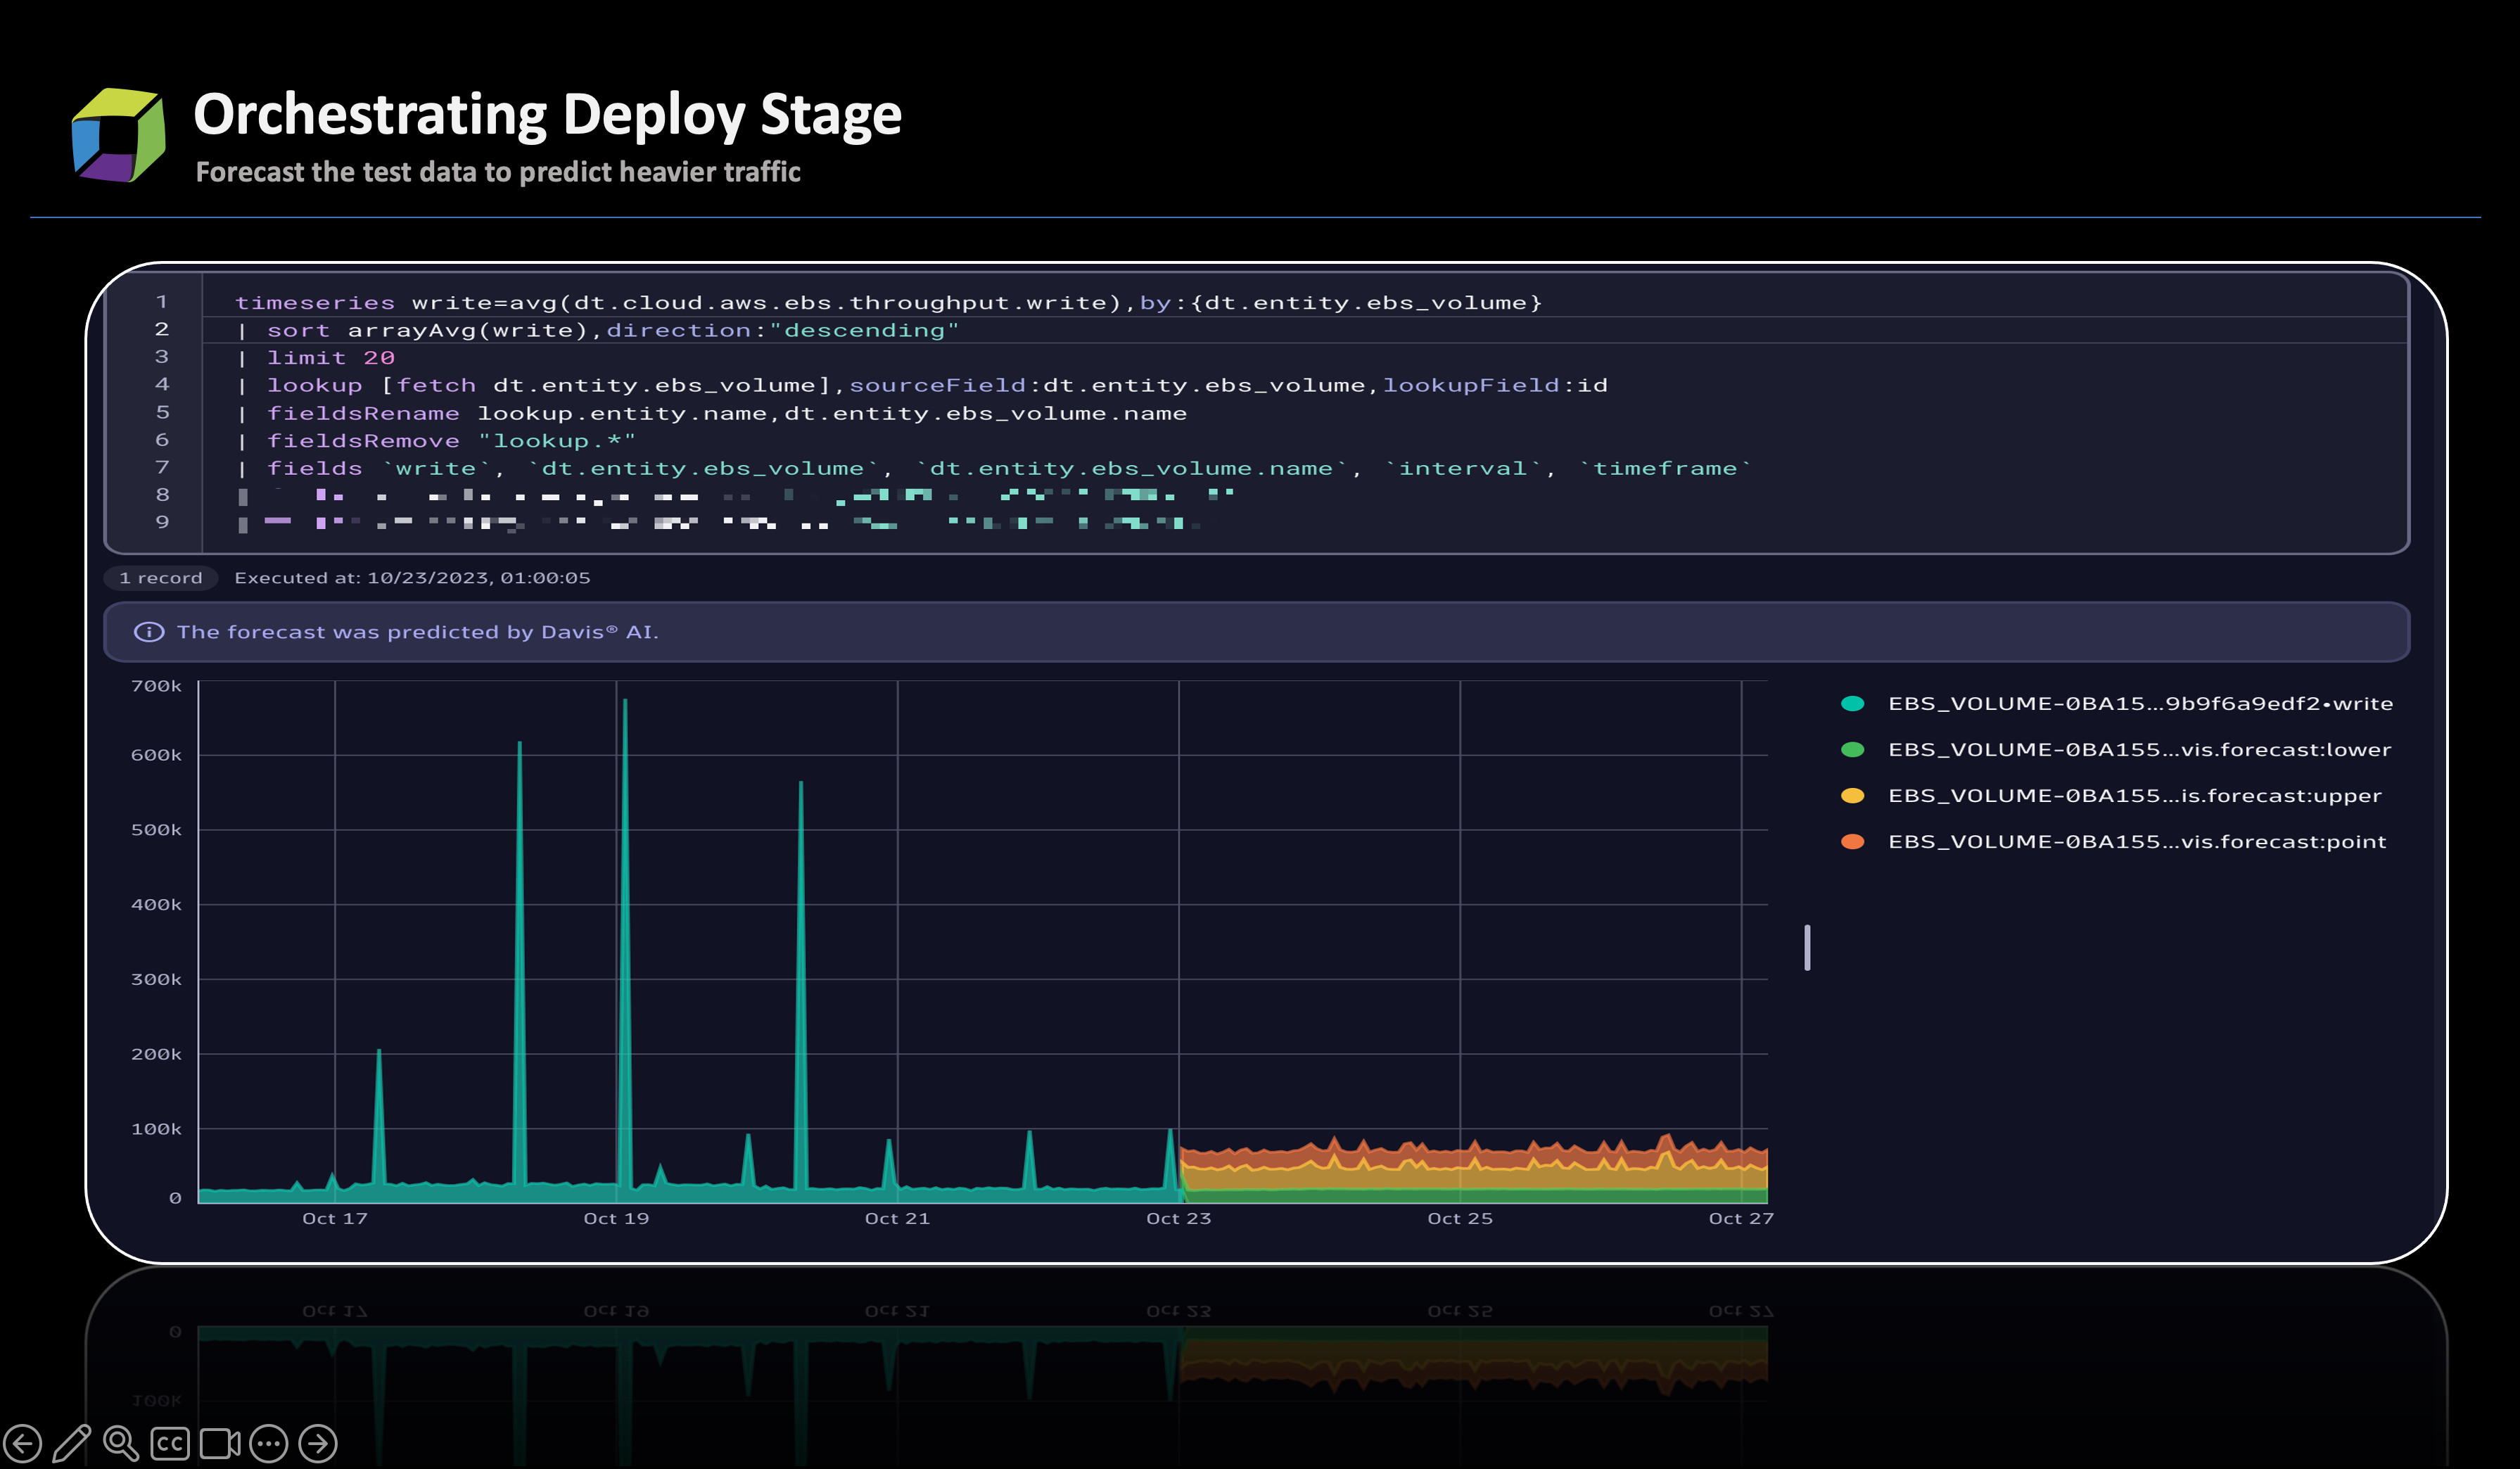
Deploying OneAgent within the staging environment facilitates the availability of telemetry data for analysis by Davis AI. Davis AI can leverage this data to enable predictive analysis. This enables a scenario where—even if test cases can’t replicate identical traffic to production due to various limitations—predictive analysis can offer insights into the capacity of the new build to withstand production-level loads.
To illustrate this concept, consider the scenario below. During testing with limited generated traffic, Davis AI predictive analysis offered valuable insights into how Elastic Book Storage (EBS) might perform and how the rate of Input/Output Operations Per Second (IOPs) might change under heavier traffic load.
Other proven strategies
We recommend following best practices to achieve the most effective observability outcomes.
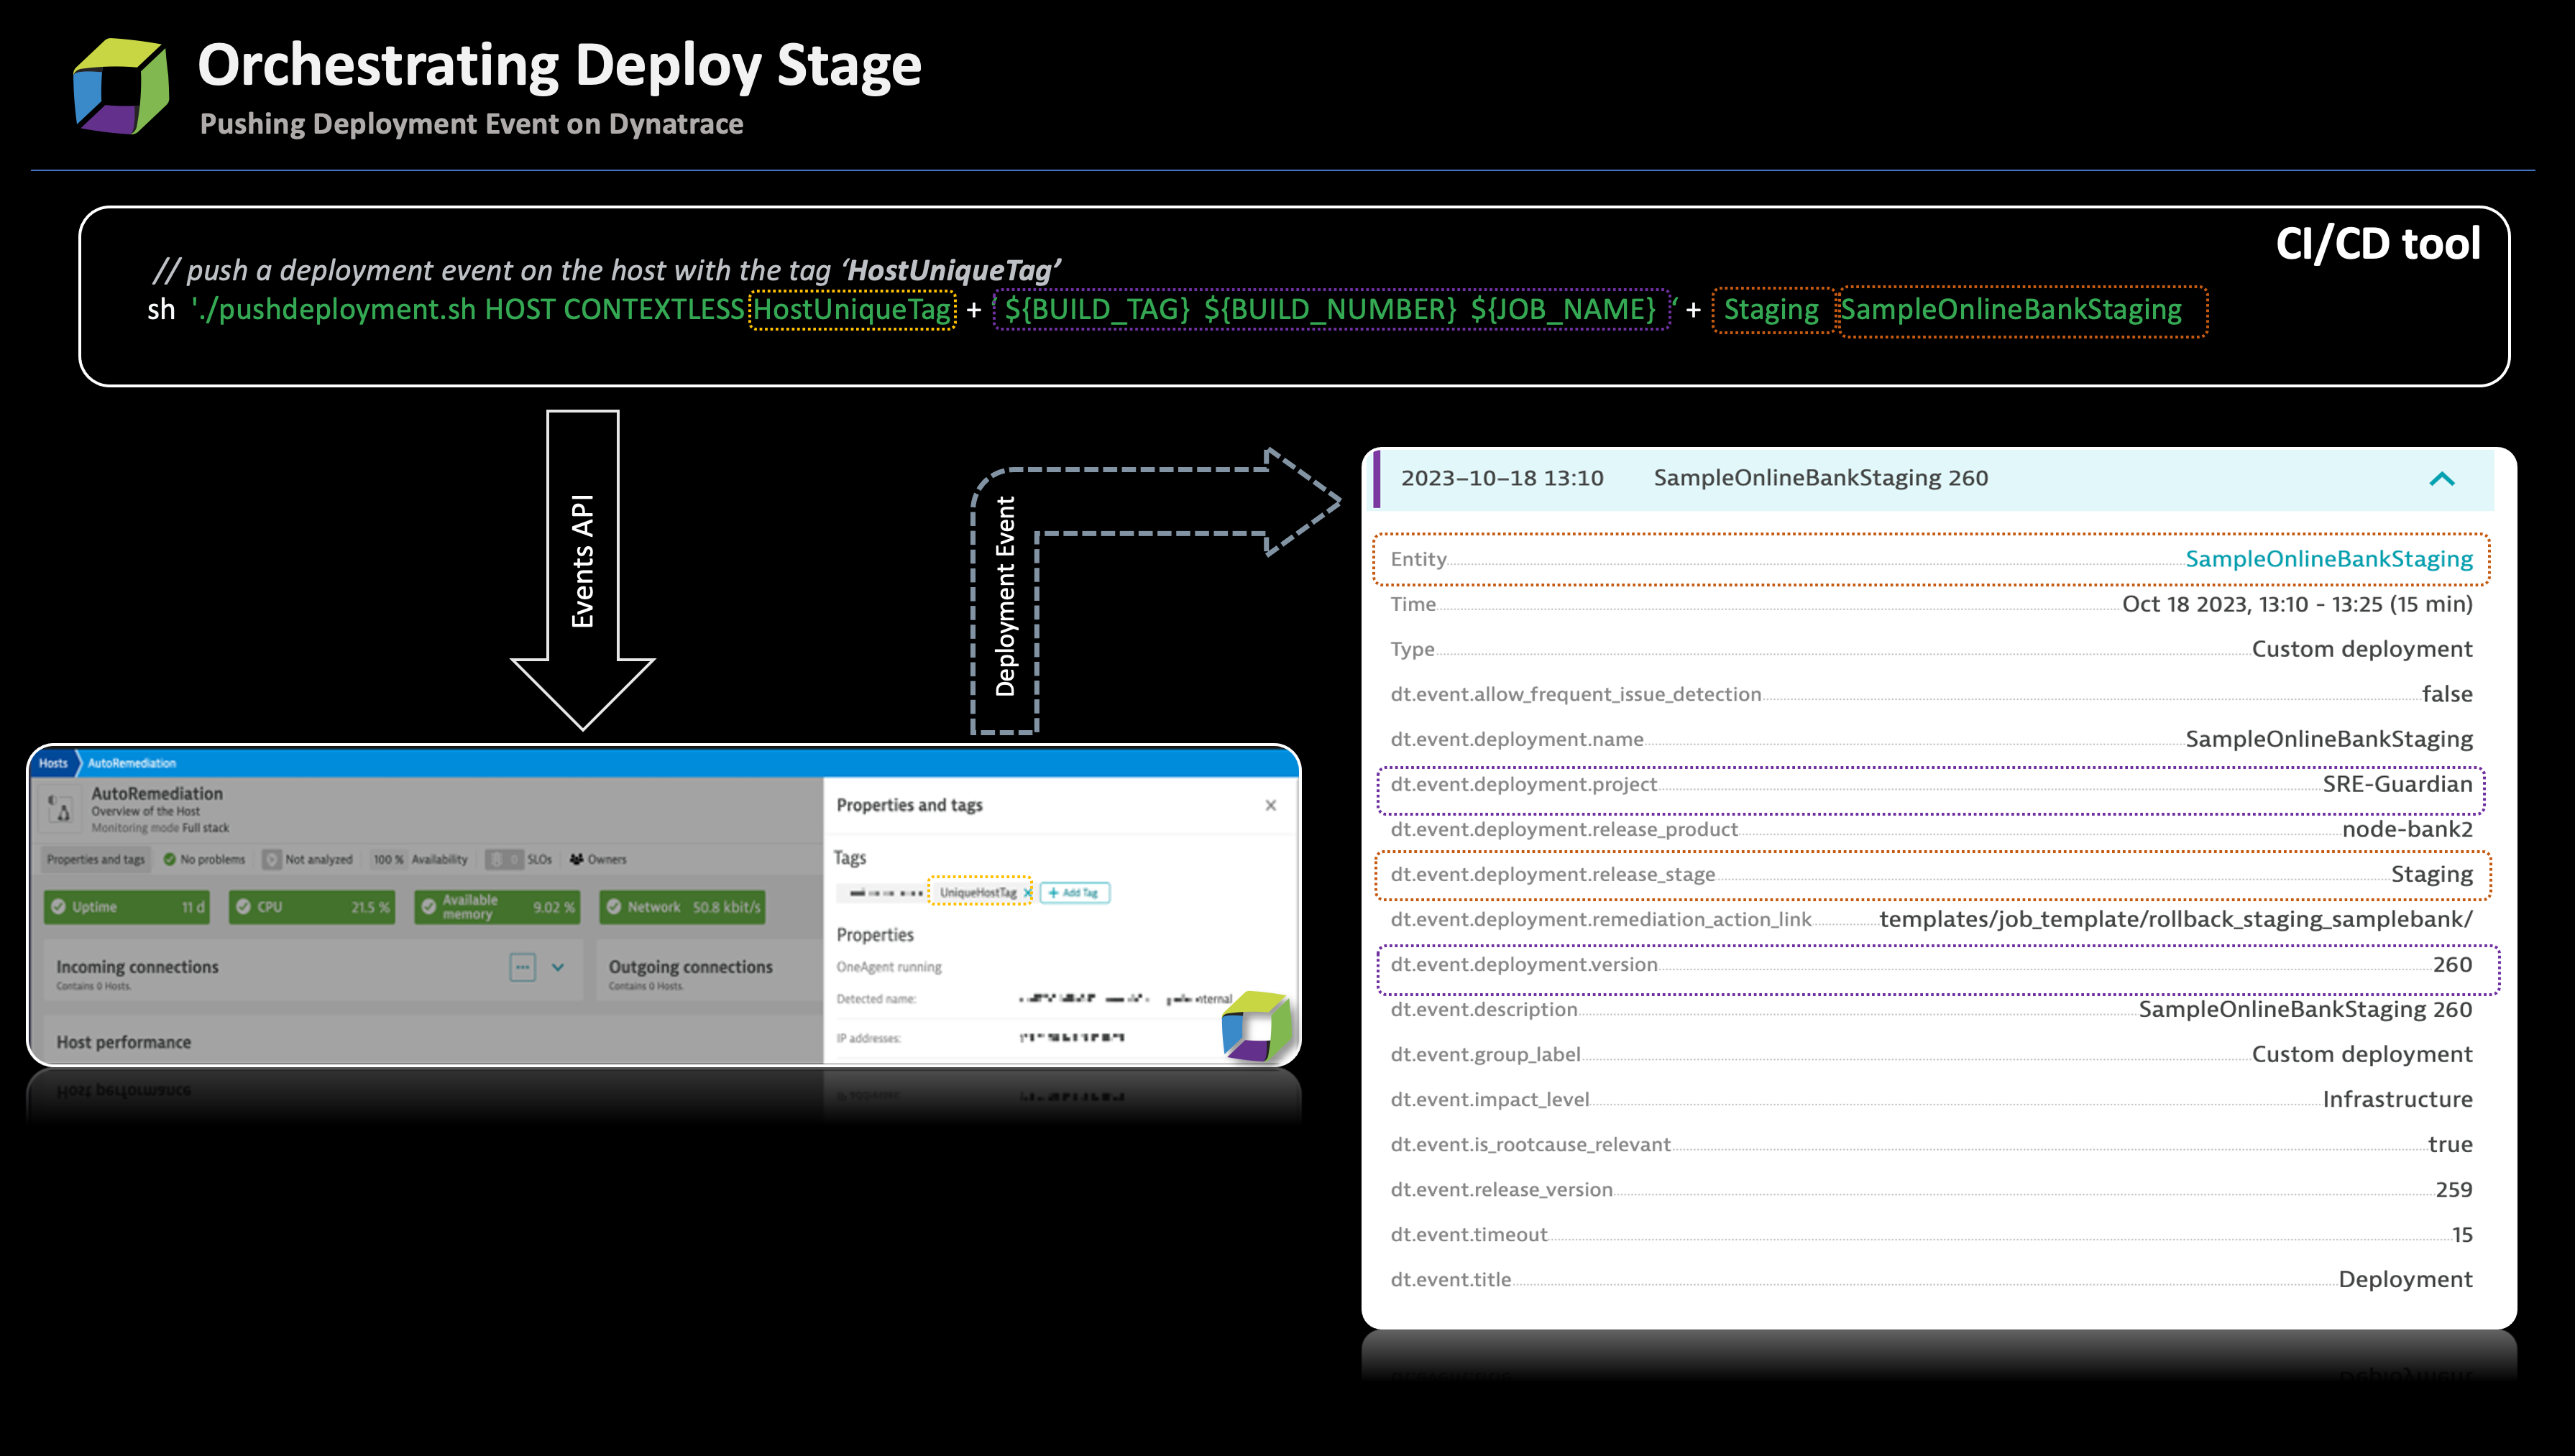
- At the onset of the deployment stage, send a deployment event to Dynatrace notifying it about the new deployment. These deployment events are important as they provide additional context to the Davis AI causation engine, aiding in evaluating deployment quality.
- To further aid with postmortem analysis, use the
DT_TAGSmetatag to clearly distinguish between different build and service requests. - Additionally, consider using the
DT_CUSTOM_PROPenvironment variable to include extra metadata about the build, providing valuable information for monitoring and analysis.

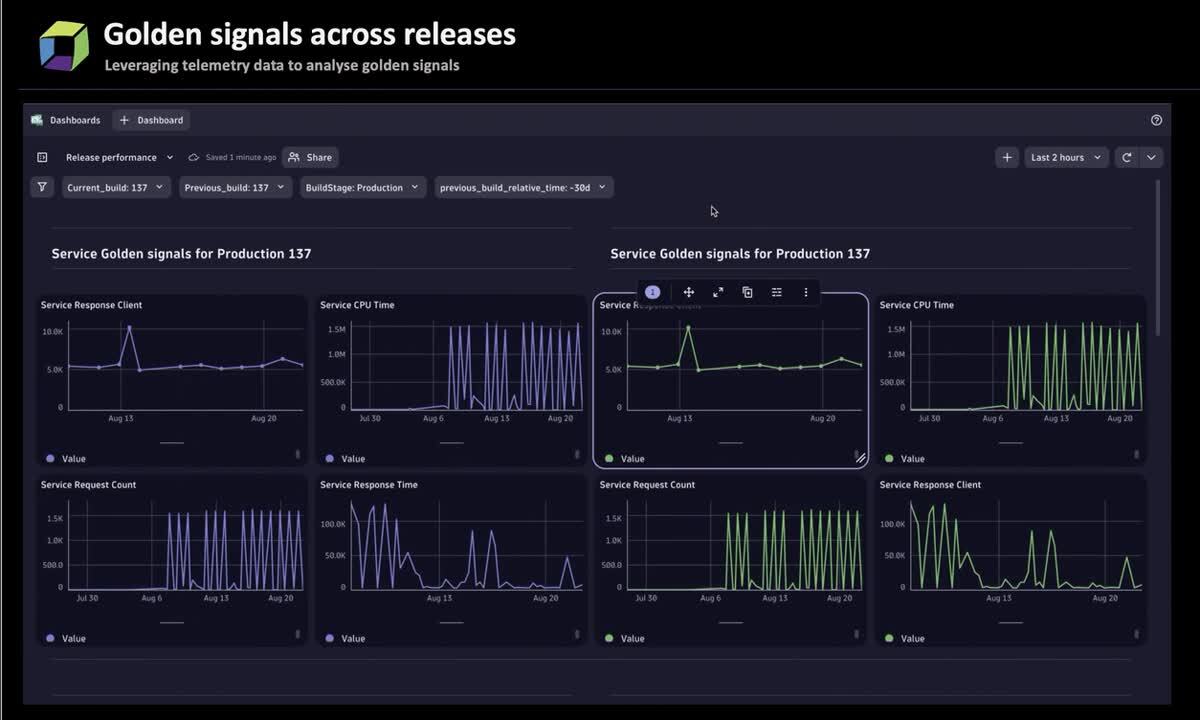
The framework outlined above provides a comprehensive view of the deployment process and facilitates comparisons across different releases. For instance, in the animation below, we utilized deployment events and DT_TAGS to assess the quality of releases and capture golden signals across various builds. This approach can be a valuable resource for developers in understanding underlying issues and identifying opportunities for enhancements.
Deploy stage orchestration in a platform engineering context
Deployment events automatically identified by OneAgent or manually triggered by app owners play a pivotal role in ensuring consistency across all environments. When issues are detected, causal AI determines if the problem is linked to deployment changes. This contributes significantly to increased productivity for development teams, as they spend less time troubleshooting and identifying discrepancies across environments. Additionally, the integration of predictive analysis, fueled by Davis AI, instills confidence in developers that their application’s behavior will withstand the anticipated load, including potentially high traffic.
Dynatrace as a deploy-stage orchestrator
You’ll find all the Jenkins pipeline and other scripts you need to set up Dynatrace as a deploy-stage orchestrator, including the referenced dashboard, in thisGit repository.
What’s next?
This blog post delved into how Dynatrace capabilities and telemetry data from a staging environment can effectively align staging with the production setup. In the next blog post in this series, we’ll further explore how Dynatrace can aid in streamlining the testing phase within an SRE pipeline.


Looking for answers?
Start a new discussion or ask for help in our Q&A forum.
Go to forum