Welcome back to the blog series, where we provide deeper dives into the latest observability awesomeness from Dynatrace, demonstrating how we bring scale, zero configuration, automatic AI driven alerting, and root cause analysis to all your custom metrics, including open source observability frameworks like StatsD, Telegraf, and Prometheus.
- In Part 1 we explored how you can use the Davis AI to analyze your StatsD metrics.
- Part 2 showed how to run multidimensional analysis for external metrics that are ingested via the OneAgent Metric API.
- In Part 3 we discussed how the Davis AI can analyze your metrics from scripting languages like Bash or PowerShell
- Part 4 showed how to leverage the power of Dynatrace Davis® for your Prometheus metrics in Kubernetes.
In this last part of the blog series, we’ll show you how to automatically analyze hundreds of Telegraf-provided metrics and get precise answers.
Telegraf collects a lot of data, but it’s up to you to analyze it
Telegraf, written by the guys at Influxdata, is a plugin-based system for collecting, processing, aggregating, and writing metrics. For example, the Telegraf OpenLDAP plugin gathers metrics from the OpenLDAP cn=Monitor backend. So if you’re using OpenLDAP for the authentication and authorization of your users, the OpenLDAP plugin is a great source to know if the service is down, or if it’s slow.
However, Telegraf is solely concerned with getting data into the right form and sending it somewhere. To make use if this data you need an easy means of analyzing it and gaining actionable insights from Telegraf, in real time.
This is the job of the Dynatrace platform.
Automatically analyze hundreds of Telegraf-provided metrics and get precise answers
By adding Dynatrace support to Telegraf, you now get intelligent observability and automatic root cause analysis for over 200 technologies. Your data is analyzed in context with all other sources that are supported by the Dynatrace platform and OneAgent. This means, you’ll automatically see how everything is connected—all the relationships and interdependencies between each layer, component, and bit of code in your application environment. To this end, Dynatrace is now available as an output plugin on the Telegraf backend.
All you need to do is install Telegraf alongside Dynatrace OneAgent and enable the new Dynatrace output plugin. This way you can easily add 200 additional plugins to your data analysis.
How to get started
The only thing that you need to change in your Telegraf configuration file is to uncomment the Dynatrace section; you can ignore the environment parameters if you have a OneAgent running locally. We’ve prepended the metrics with Telegraf to make them easier to find in Dynatrace.
# # Send telegraf metrics to a Dynatrace environment
[[outputs.dynatrace]]
#   ## For usage with the Dynatrace OneAgent you can omit any configuration,
#   ## the only requirement is that the OneAgent is running on the same host.
#   ## Only setup environment url and token if you want to monitor a Host without the OneAgent present.
#   ##
#   ## Your Dynatrace environment URL.
#   ## For Dynatrace OneAgent you can leave this empty or set it to "http://127.0.0.1:14499/metrics/ingest" (default)
#   ## For Dynatrace SaaS environments the URL scheme is "https://{your-environment-id}.live.dynatrace.com/api/v2/metric
s/ingest"
#   ## For Dynatrace Managed environments the URL scheme is "https://{your-domain}/e/{your-environment-id}/api/v2/metric
s/ingest"
#   environmentURL = ""
#
#   ## Your Dynatrace API token.
#   ## Create an API token within your Dynatrace environment, by navigating to Settings > Integration > Dynatrace API
#   ## The API token needs data ingest scope permission.
#   #   environmentApiToken = ""
#
#   ## Optional prefix for metric names (e.g.: "telegraf.")
   prefix = "telegraf."
#
#   ## Optional flag for ignoring tls certificate check
#   skipCertificateCheck = false
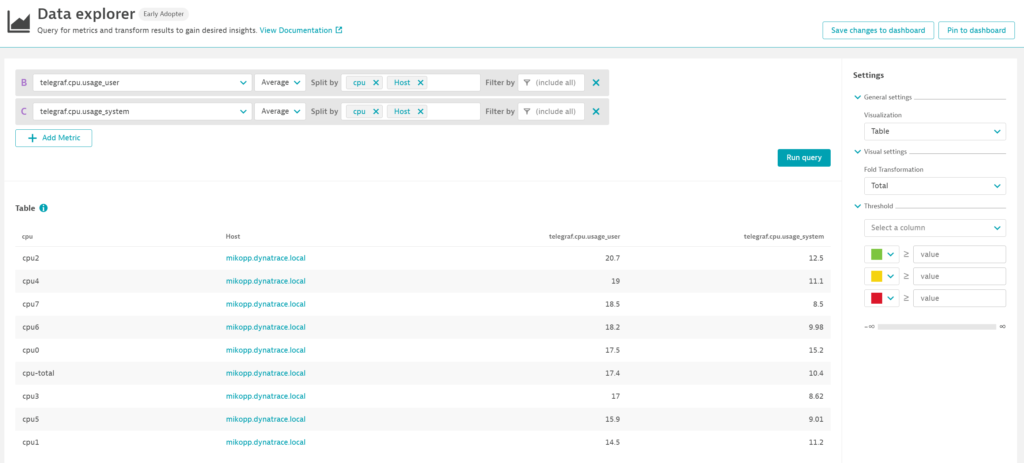
In this example, we simply use the CPU input plugin which gives us CPU per core like in part 3 of this series.
As you can see here we have prefixed all metrics with telegraf. What is important to note here is that the metrics have again been contextualized and are correctly mapped into the Smartscape topology (see the host link). This gives you and the Davis AI the context you need to derive proper answers from this data.
Make sure that OneAgent version 1.201+ is installed on the VM or host that you want to monitor. Enable the OneAgent metric API at the environment or host level and, if necessary, modify the default metric ingestion port. For details, see Telegraf integration in Dynatrace Help.
Seeing is believing!
New to Dynatrace? Try it out by starting your free trial today.


Looking for answers?
Start a new discussion or ask for help in our Q&A forum.
Go to forum