Last week was Google Cloud NEXT, Google’s big show all about their cloud offerings.
I was there because Dynatrace made some announcements about our support for GCP, including Kubernetes and Stackdriver – You can read about those in this blog post I wrote.
As you’d expect from a show like this, there was lots of cool stuff going on. I wanted to use this post to share some of the news that got me really excited at the show.
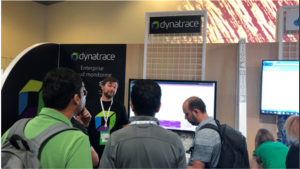
The first thing I noticed was what a hot topic Kubernetes is. I tried to drop in on a few breakout sessions when I had a chance, but anything with Kubernetes in the title was packed. It shouldn’t be a surprise since Kubernetes started at Google before they released it as open source. It’s great to see the momentum it’s picked up in just a few short years. As one speaker said – “containers are the building blocks of the cloud, and Kubernetes is the way you orchestrate and manage them.” Google also announced that their cloud solution for Kubernetes, GKE, was also now available as an on-premises deployment.
That’s great for Dynatrace, because Kubernetes is a technology that we support and are actively building for. We announced OneAgent Operator for Kubernetes a few months ago and we’ve continued to enhance the solution based on customer feedback. You can use the OneAgent Operator to automate the rollout of OneAgent to your Kubernetes nodes, and provides a mechanism for automated updates of OneAgent. It’s more than that though – see my colleague Alois blog post about the latest updates to OneAgent Operator for Kubernetes
I also learned a little about Knative, a solution for serverless workloads that run on Kubernetes. It’s a way for developers to just focus on writing code, and not the boring-but-important tasks like getting your code into containers or configuring routing or autoscaling. You can find out more about it here.
There was lots of buzz for Istio, as the product came out of beta and officially reached version 1.0. Istio is designed to make it easier to deploy and manage microservices. When it’s deployed, it can automate load balancing of web traffic, and provides the ability to route traffic with access controls and rate limits. What made my ears perk up though was the ability for Istio to automatically determine relationships between services, and automatically create a dependency map of your services.
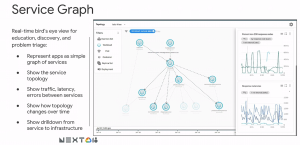
That’s really similar to the smartscape technology that’s in Dynatrace, so I wanted to learn more about it.
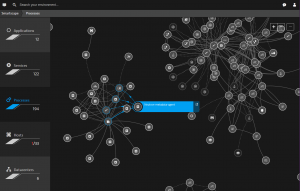
I’m still diving in to Istio to learn more, but it looks like it’s limited to services running on Kubernetes on Google Container Engine (GKE) or on premises, whereas Dynatrace can be deployed and used to monitor systems on any cloud platform, as well as on-premises and even legacy systems like mainframe. Istio also seems to only be able to automatically detect the services running at the container level – it can see what services talk to each other, and what the transaction times are, but it’s up to developers to do most of the instrumentation in their code for Istio to monitor, and then it’s up to devs to analyze that data too. Dynatrace can build relationship maps of not just services, but processes and hosts as well. And Dynatrace can automatically do all the tracing in your code, including analysis, without Devs having to change their code. I’ll have more to say about Istio after I’ve had a chance to kick the tires a little more.
Broader integration with Stackdriver was a pretty common theme in many of the sessions. This is great news for Dynatrace customers, because we have a remote plugin that will bring metrics from Stackdriver into Dynatrace, allowing Dynatrace to use that data as part of it’s analytics. As long as Google continues to support the Stackdriver API and makes those metrics available, we’ll be able to bring them in to Dynatrace. (We’re still finalizing and refining the metrics that will be included out-of-the-box with the Stackdriver plugin. I’d love to get feedback on what some of those should be. Let me know what services you’re using on GCP, and what monitoring metrics you’d like to see from those. Ping me on twitter @adambomb00 or email me: adam.carter@dynatrace.com .
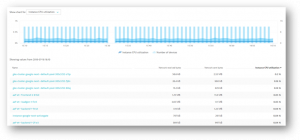
I did manage to catch a session about SRE (Site Reliability Engineering) that talked about a couple of interesting concepts. One of the things they talked about was how minutes of uptime is not the most effective way to measure the reliability of your services and suggested instead measuring successful interactions per minute.
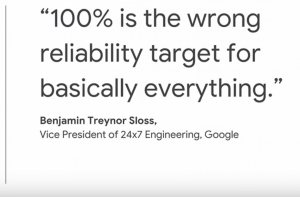
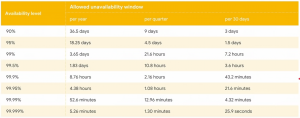
This makes a lot of sense. If you’ve got a distributed app and one of your sites fails, but users aren’t impacted, it doesn’t really count as downtime. This is where Dynatrace RUM (Real User Monitoring) comes in to play – measuring user experience right from the end user’s device (Web, Mobile, Iot, etc.). They also talked about the concept of an error budget for your services as a way to determine how major the impact is – the faster an outage burns through your error budget, the bigger the impact on the business. They had some interesting data about “9’s” of uptime. If you’re at 99% uptime (that’s downtime of 7 hours per month) and want to go to 99.9% (that’s 43 minutes of downtime per month) , it costs 10x in operations costs, and every additional 9 you add that (99.99 is 4.3 minutes of downtime per month, 99.999 is 26 seconds) it adds another 10x in cost.
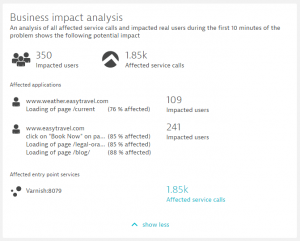
Dynatrace has functionality built in to enable this kind of metric – Dynatrace measures and reports on the number of users active on the system that are impacted by a problem, and because we’ve got instrumentation running at the code level, Dynatrace detects errors based on HTTP response and backend code errors like exceptions and error handler method execution and can even calculate the cost of lost revenue as a result of an outage. Want to know more? My colleague Wolfgang talks about it here.
There were a couple of other announcements that I really liked. As seems to be the trend these days, everyone talks about their AI and Machine Learning solutions, and Google talked a lot about AutoML – new solutions that can be easy trained by mere mortals. They showed examples like AutoML Vision – where you can provide AutoML with some images that are tagged appropriately to teach AutoML what they are images of, and it will use that knowledge to identify future images. It reminded me of the “Not Hotdog” app from the TV show Silicon Valley – just provide AutoML with some pictures of hot dogs, and it will quickly learn to identify what’s a hot dog and what’s not, greatly speeding up your development process. If you prefer Schnitzel to Hotdogs, you might find the app “Schnitzel or Not” from my colleague Gergely Kalapos interesting. He showed it in Episode 15 of his .NET Concepts of the Week.
Because my team does a lot of work with DevOps and CI/CD, I made a trip through the expo hall and stopped and talked with some Google engineers about Cloud Build and Spinnaker and how we can integrate Dynatrace into that pipeline .
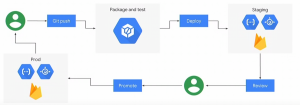
Did you know you can use Dynatrace to enable CI/CD? You can use Dynatrace to do automated validation on your builds and deployments, and have Dynatrace auto approve or reject releases, or even regress to previous builds if performance benchmarks aren’t met. You can use it to enable Shift-Left (earlier and automated feedback so bugs are found sooner) and Shift-Right (to understand performance in production). You can do all this with Dynatrace already on AWS (check out this great tutorial built by my boss, Andi), Visual Studio Team Server (thanks to Abel Wang and Donovan Brown) as well as Jenkins (See GitHub tutorial). It was great to confirm that all the building blocks are there to do the same on GCP.
This was my first Google Next conference, and I look forward to attending again. It’s great to see Google really getting parity (and in some cases surpassing) the offerings available from the other big cloud platform providers. As they continue to expand their offering, Dynatrace will to continue to invest in expanding our support and capabilities too. See you NEXT year!


Looking for answers?
Start a new discussion or ask for help in our Q&A forum.
Go to forum