Header background

A Brief Intro to Full Stack Performance Monitoring on Google Cloud Platform

Hi everyone, Adam Carter here. I am a Tech Alliance Manager at Dynatrace, and I work with all the major cloud providers to enable customers to reduce complexity and risk on their platforms using Dynatrace.

I’m on my way to San Francisco for Google Cloud NEXT. This is Google’s big conference to educate and share how people are using Google Cloud Platform (GCP) and what is coming “NEXT” for the platform. 😊

This is perfect timing for me to talk about the work that Dynatrace has done to provide deep insights into performance on GCP. In fact, I just finished a webinar with Andi Grabner where we walked through some of the new functionality, “Monitoring Google Cloud Platform with Dynatrace – 101”. What I’d like to do here is a quickly recap some of those high points.

What’s Google Cloud Platform (GCP)?

Google continues to add functionality like virtual machine hosting, container hosting, cloud storage, SQL, etc. to their cloud offering.

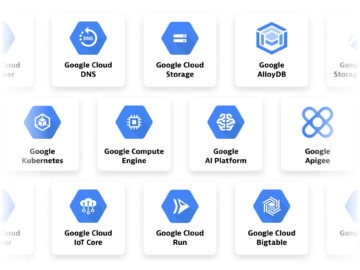
Google Cloud Platform offerings
A few of the Google Cloud Platform offerings

How does Dynatrace raise the performance bar? Well, one of the cool things about Dynatrace is that we can pull metrics and performance data directly into our monitoring technology. The simplest way to get started is to install OneAgent on your hosts – in GCP, you can do that with your Compute Engine (GCE) virtual machines, and containers running in App Engine (GAE) and Kubernetes (GKE).

For native services on GCP, where you can’t install OneAgent, we leverage the Stackdriver Monitoring API, to quickly extract and integrate those metrics.

Monitoring GCP with Dynatrace

For the GCP Services listed under “Compute”, you can install OneAgent to enable Full Stack monitoring. This is great because it automatically determines where the host is running, and what applications, processes, and services, are running there.

Automated FullStack Monitoring from End User to your Compute Resources with Dynatrace OneAgent
Install the OneAgent – That’s It! Automated FullStack Monitoring from End User to your Compute Resources!

Dynatrace is basically ‘Google aware’. The Dynatrace OneAgent automatically determines when it is running on a host in GCP and discovers information about the host, which datacenter it is running in, and what Google project it is associated with – along with a lot of other metadata about your deployment.

Example of properties OneAgent detected about the host, with the GCP metadata highlighted
This is an example of properties OneAgent detected about the host, with the GCP metadata highlighted

You can use this metadata in a lot of valuable ways, like for automated tagging to be used for filtering custom dashboards or management zones. For example, if you want to create a custom Dynatrace dashboard and view just components of a specific GCP project, you can use the project name as a tag to automatically filter the view.

For hosts running in GCE – install OneAgent, and you’re done! OneAgent will start reporting on the performance of underlying systems, like CPU utilization, network throughput, as well as determine what processes are running. It also monitors these processes to track other associated systems, and automatically detects log files, and starts collecting this data as well. This works easily for both Windows and Linux hosts.

Overview page for a host running in GCE. From here you can click through to the performance metrics about the host, or any of the services OneAgent detected
This is the overview page for a host running in GCE. From here you can click through to the performance metrics about the host, or any of the services OneAgent detected.

Monitoring GAE (Google AppEngine) with Dynatrace

Google manages the underlying hosts when deploying your services via AppEngine. As we won’t have access to these GAE managed hosts to install OneAgent’s we have to use a different approach. We simply include OneAgent in the container image and it will execute alongside the other binaries in the container and feed that monitoring data into Dynatrace. My colleague, Alois Mayr, has more detailed info on GAE monitoring in his blog “Google App Engine application monitoring now available (beta)”. There is also a document on how to install and configure here “Monitoring Google Applications”. It’s pretty straight forward – just a few lines of config info to add to your dockerfile when creating an image.

Dynatrace will display all kinds of insight data about the host performance:

Overview page from Dynatrace for a service running in a container. You can see all the details about where the container is running, and any current problems. You can access log files generated by the container too
This is the overview page from Dynatrace for a service running in a container. You can see all the details about where the container is running, and any current problems. You can access log files generated by the container too.
Metrics about how the apps in the container are performing
Here we have metrics about how the apps in the container are performing.

Monitoring GKE (Kubernetes Engine) with Dynatrace 

If you are using GKE, Dynatrace can automatically monitor every single container deployed by Kubernetes. In order to automatically instrument these containers, we leverage the Dynatrace OneAgent Operator for Kubernetes and OpenShift which ensures that a Dynatrace OneAgent is automatically loaded with every container instance.

Once the Operator is active every single container will report data to Dynatrace. You can get a high level overview of all containers, on which kubernetes nodes they run, which images are actually used and how traffic is distributed. Simply start with the Dynatrace Docker View:

Dynatrace gives us a high level overview of all images, container and container hosts with drill down capabilities to each container
Dynatrace gives us a high level overview of all images, container and container hosts with drill down capabilities to each container!

Because the OneAgent is actually monitoring each individual container instance we get to see the same level of detail as we saw earlier when monitoring your GCE or GAE instances:

Dynatrace OneAgent provides full visibility and automated instrumentation of your containers running in GKE
Dynatrace OneAgent provides full visibility and automated instrumentation of your containers running in GKE.

Key Use Cases for GCP and Dynatrace

With all this functionality, what’s the best place for Dynatrace within your GCP deployment? Let’s take a look at some use cases that I’ve seen customers using today:

  • Dynatrace RUM (Real User Monitoring) – analyze true user experiences across all transactions
  • Service Flow – understand what is happening inside the transaction and find bottle necks and issues that are implication performance
  • Diagnostics – understand fully where exceptions are occurring in your application and why
This chart shows the number of exceptions occurring in an application over time. They're broken out and stacked by the type of exception
This chart shows the number of exceptions occurring in an application over time. They’re broken out and stacked by the type of exception.

Using Dynatrace PurePath technology analyze every single transaction end to end across every tier of your application technology stack—beginning at the browser and extending through all services, all the way down to the code and database level. (p.s. nobody else can do this. Other APM vendors provide this granular level of detail for only some transactions, but usually only after an alert has been triggered).

An example of PurePath for our service, showing the endpoints that called the service, including the call stack and trace for the call
An example of PurePath for our service, showing the endpoints that called the service, including the call stack and trace for the call.

Dynatrace gives you the same insights into SQL queries – helping you identify which queries are the slowest – so you can optimize them. You can also use PurePath to find inefficient code.

Dynatrace also has some really slick log analytics – in addition to automatically discovering log files, Dynatrace automatically aggregates them – you can see all your logs from a single console, and search across them from one place. Dynatrace will also use the log data in problem analysis to help identify root cause.

An example of the logs collected from one of our apps. Dynatrace can utilize these logs as part of problem analysis, and you can search across all your logs from one place

What’s Next and Additional Resources

There is a lot happening on the GCP platform, and Dynatrace gives you full visibility into your Google Cloud Platform and shows you whether or not your applications are performing as they should and delivering the user experience you expect.

Looking for more info on how to implement any of these? Here are some additional resources:

If you haven’t already, get started with Dynatrace. All you need is an email to get started – you’ll get set up with a free tenant, begin installing OneAgent, and immediately see the insights Dynatrace can reveal about the performance of your environment and how you can improve and optimize it. Get your free trial

And lastly – if you’d like to participate in our Early Access Program, or to help shape the future of our Stackdriver plugin as mentioned above – don’t forget and drop me a line at adam.carter@dynatrace.com.