
In March 2024, Dynatrace made its AI-powered platform generally available on Microsoft Azure. You can now leverage the unique features of the Dynatrace® platform and Grail with the Azure Native Dynatrace Service (ANDS) to get instant insights into Azure resources within your Azure subscriptions. This offers a best-in-class product experience with deep integration into Microsoft Azure, such as instant deployment of Dynatrace OneAgent® from the Microsoft Azure Portal and data flowing into the Dynatrace platform with no-touch configuration. Furthermore, leveraging the unique features of the Dynatrace platform allows you to get deep insights into any workload, whether in the cloud or on-premises.
Dynatrace platform’s unique features are now available on Azure
As of today, Azure customers can leverage the latest Dynatrace core innovations on Microsoft Azure, including:
- Dynatrace Grail™ data lakehouse unifies the massive volume and variety of observability, security, and business data from cloud-native, hybrid, and multicloud environments while retaining data context to deliver instant, cost-efficient, and precise analytics.
- Dynatrace® AutomationEngine features a no- and low-code toolset and leverages Davis® AI to empower teams to create and extend customized, intelligent, and secure workflow automation across cloud ecosystems.
- Dynatrace® AppEngine features a no- and low-code toolset and leverages Davis AI to empower teams to easily create and share custom, intelligent, and secure apps that leverage insights from data generated by their clouds.
- The new Dynatrace user experience, including powerful dashboarding capabilities and interactive Dynatrace Notebooks, drives tighter cross-team collaboration and enables more people within the organization to make data-backed decisions.
Azure Native Dynatrace Service allows easy access to new Dynatrace platform innovations
Dynatrace has long offered deep integration into Azure and Azure Marketplace with its Azure Native Dynatrace Service, developed in collaboration with Microsoft. With the AI-powered Dynatrace platform now generally available on Azure, Azure Native Dynatrace Service customers can now leverage the full AI power of the Dynatrace platform directly from Azure. With Dynatrace directly connected to your Azure subscriptions, Dynatrace OneAgent® can be deployed directly to VMs and App Services from the Microsoft Azure Portal. One-click activation of log collection and Azure Monitor metric collection in the Microsoft Azure Portal allows instant ingest of Azure Monitor logs and metrics into the Dynatrace platform. For more details, see the blog post, Set up AI-powered observability for your Microsoft Azure cloud resources in just one click.
The following figure shows the benefits of Azure Native Dynatrace Service. For more details, please see the blog post Dynatrace and Microsoft Azure integrate to help accelerate your cloud transformation.
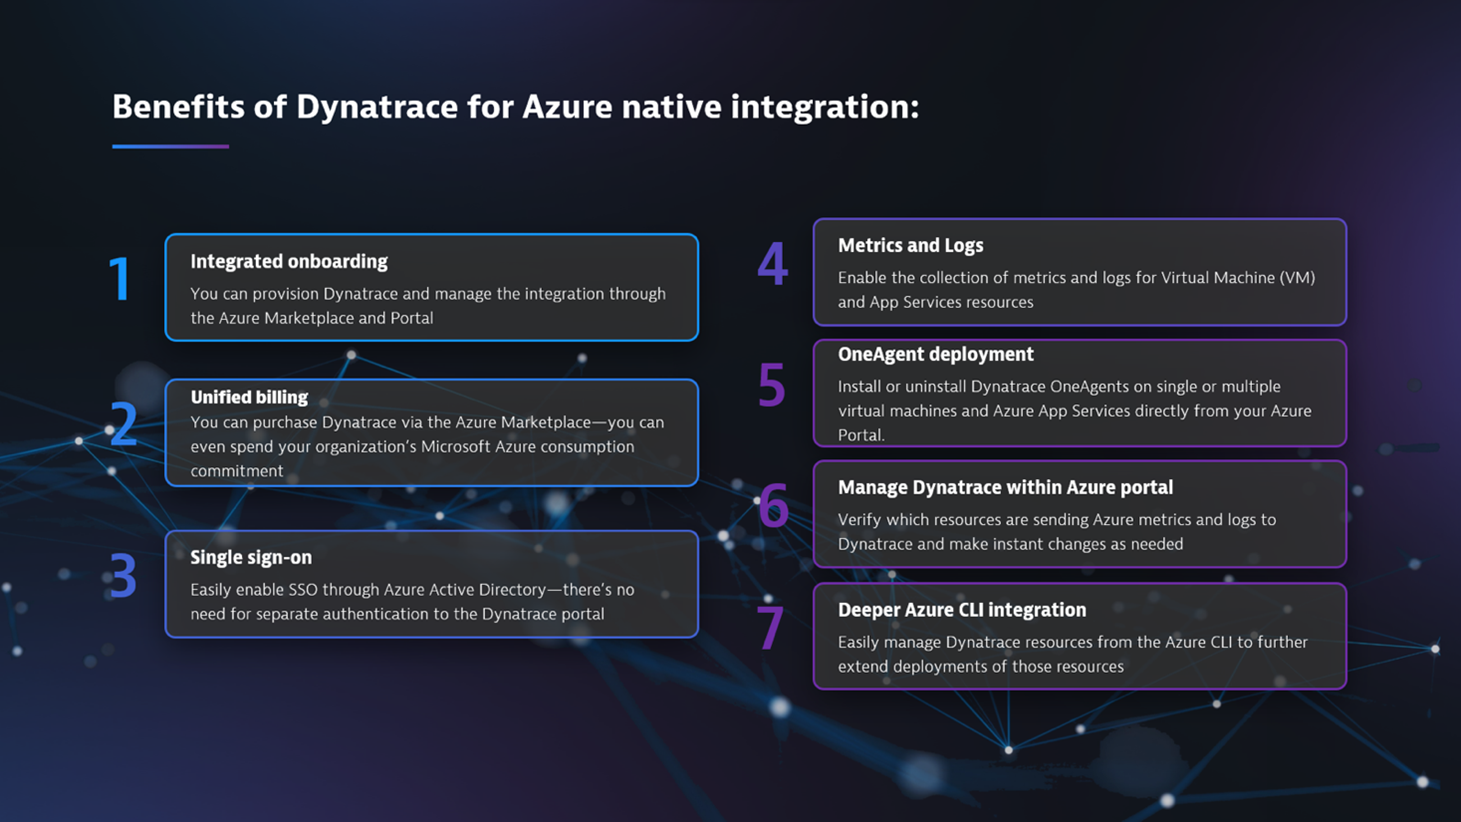
Using the Dynatrace platform on Azure allows Azure Native Dynatrace Service customers to get instant insights into their workloads with a comprehensive set of new innovative features with the best product experience from the Microsoft Azure Portal:
- The Dynatrace platform is automatically provisioned as part of the Azure Marketplace purchase process, allowing you to set up observability for workloads in minutes.
- Configuring the Dynatrace platform and deploying Dynatrace OneAgent from the Microsoft Azure Portal ensures that observability data from Azure resources arrives in Dynatrace within seconds.
- New Dynatrace platform features—with the Grail data lakehouse at their core—allow you to easily query and get insights into your workloads with the new Dynatrace user experience using DQL, Notebooks, and Dashboards, driven by a new Automation Engine, and AppEngine.
Leverage Dynatrace to get observability into all resources in your Azure tenant
This blog post shows you how the Dynatrace platform, together with the Azure Native Dynatrace Service—and unique new capabilities such as Grail, Dashboards, Notebooks, and the Cloud app—can give instant insights into all the Azure resources deployed in your Azure tenant.
Set up complete monitoring for your Azure subscription with Azure Monitor integration
After activating the Azure Native Dynatrace Service (see Dynatrace Documentation for details), the Azure Monitor integration is enabled easily via the Microsoft Azure Portal, as shown in the following screenshot. There’s no need for configuration or setup of any infrastructure.
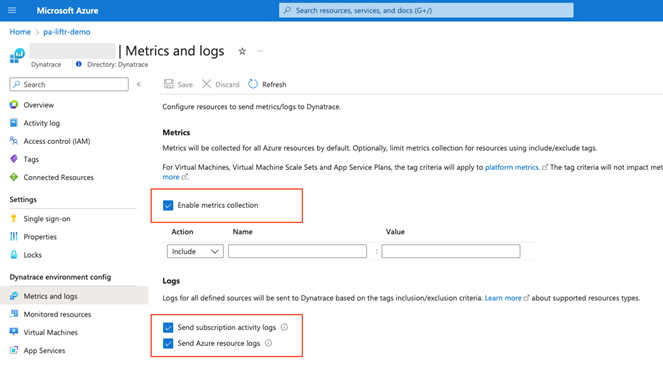
Enabling the Azure Monitor integration in the Microsoft Azure Portal triggers the linked Dynatrace environment to start polling metrics and resource metadata for the Dynatrace Smartscape® topology model. Furthermore, as shown in the above screenshot, the collection of resource logs and activity logs is easy to turn on.
Integrate multiple Azure subscriptions under a single Dynatrace environment
If you have multiple Azure subscriptions in your Azure tenant, it’s best practice to integrate the Azure subscriptions with a single Dynatrace environment. Establishing a single source of truth for all observability data reveals the full power of the Dynatrace platform by querying all data with comprehensive new capabilities from the one Dynatrace Grail data lake house for data storage.
To monitor multiple subscriptions within your Azure tenant
- Create a new Dynatrace environment within the first subscription by creating the first Dynatrace resource (Option Create a new Dynatrace environment as shown in the following screenshot).
- Then, create a Dynatrace resource in all other Azure subscriptions and link the Dynatrace environment created in Step 1 (the option Link Azure subscription to an existing Dynatrace environment is shown in the following screenshot).

More information can be found at Dynatrace link to existing. Also, see how to automate this process with bicep and how to automate with Azure CLI.
Azure use cases with Dynatrace Apps
The following new Dynatrace® Apps can be leveraged to get instant insights into all Azure resources of Azure subscriptions connected via the Azure Native Dynatrace Service:
- Clouds enables cross-subscription and cross-region observability in one place.
- Dashboards leverages the power of DQL for Azure monitoring in one place.
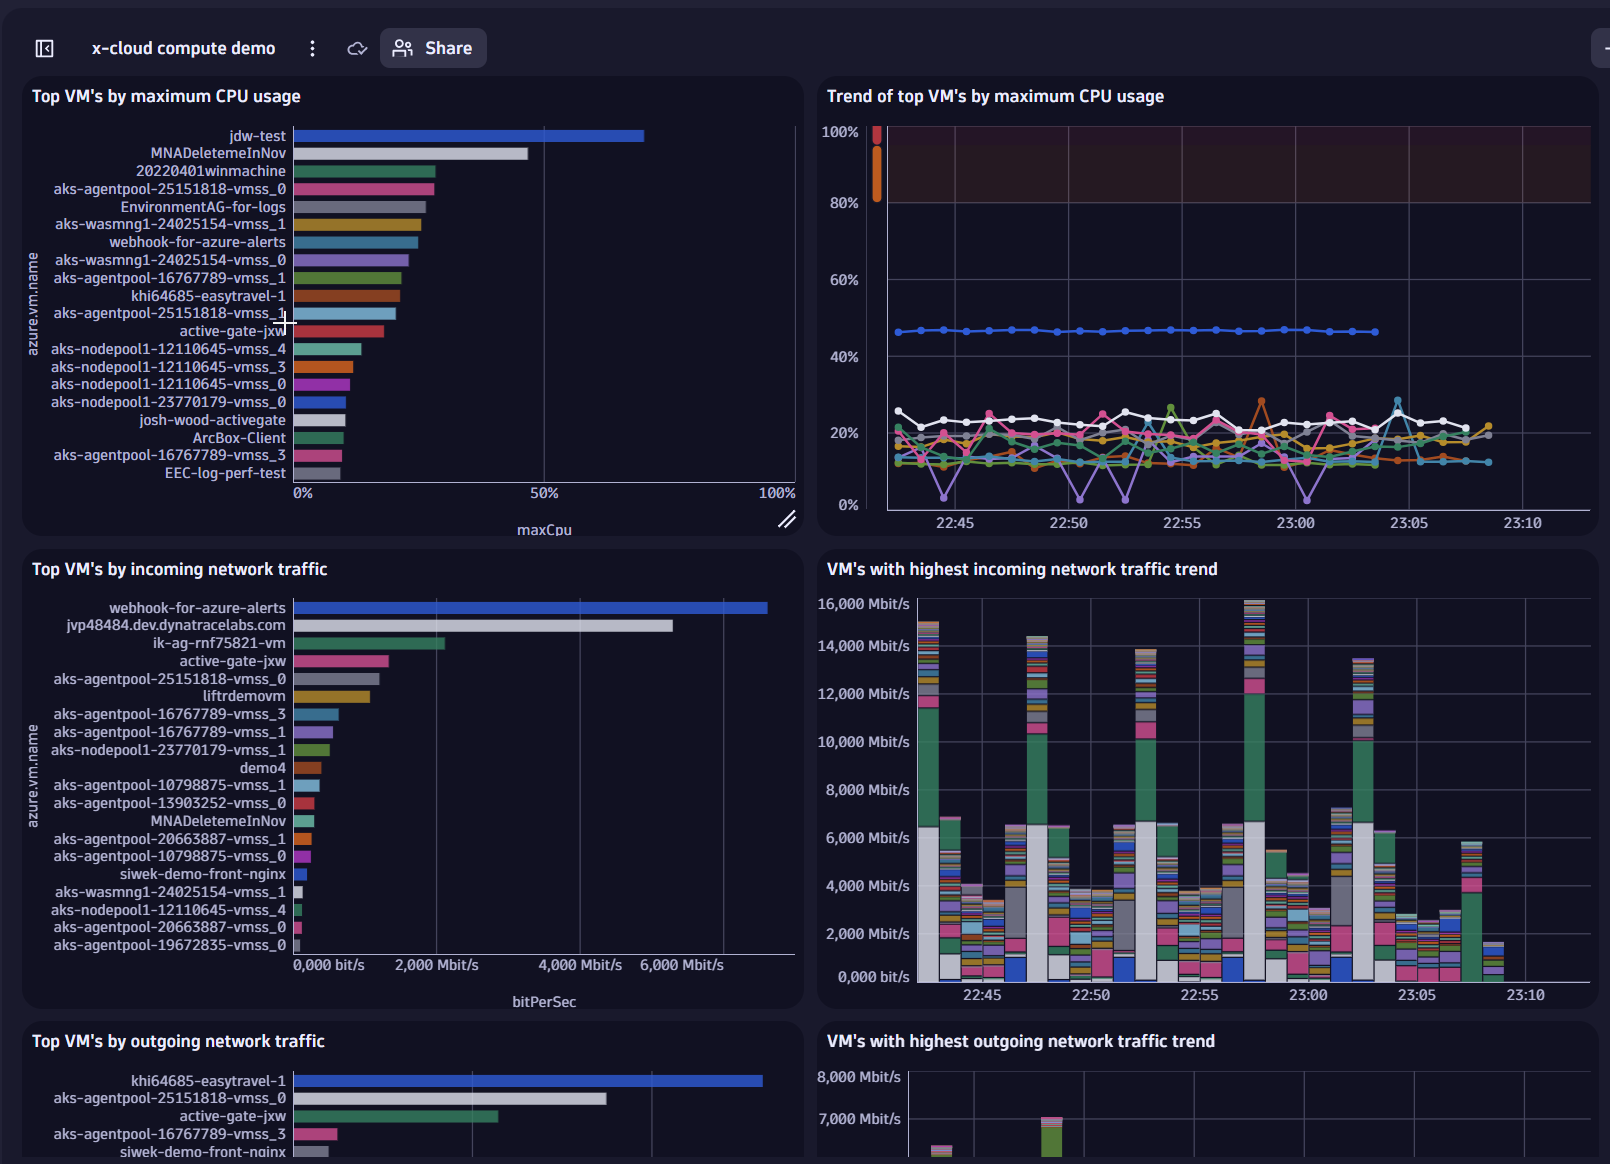
- Notebooks offers advanced Azure observability analytics with DQL.
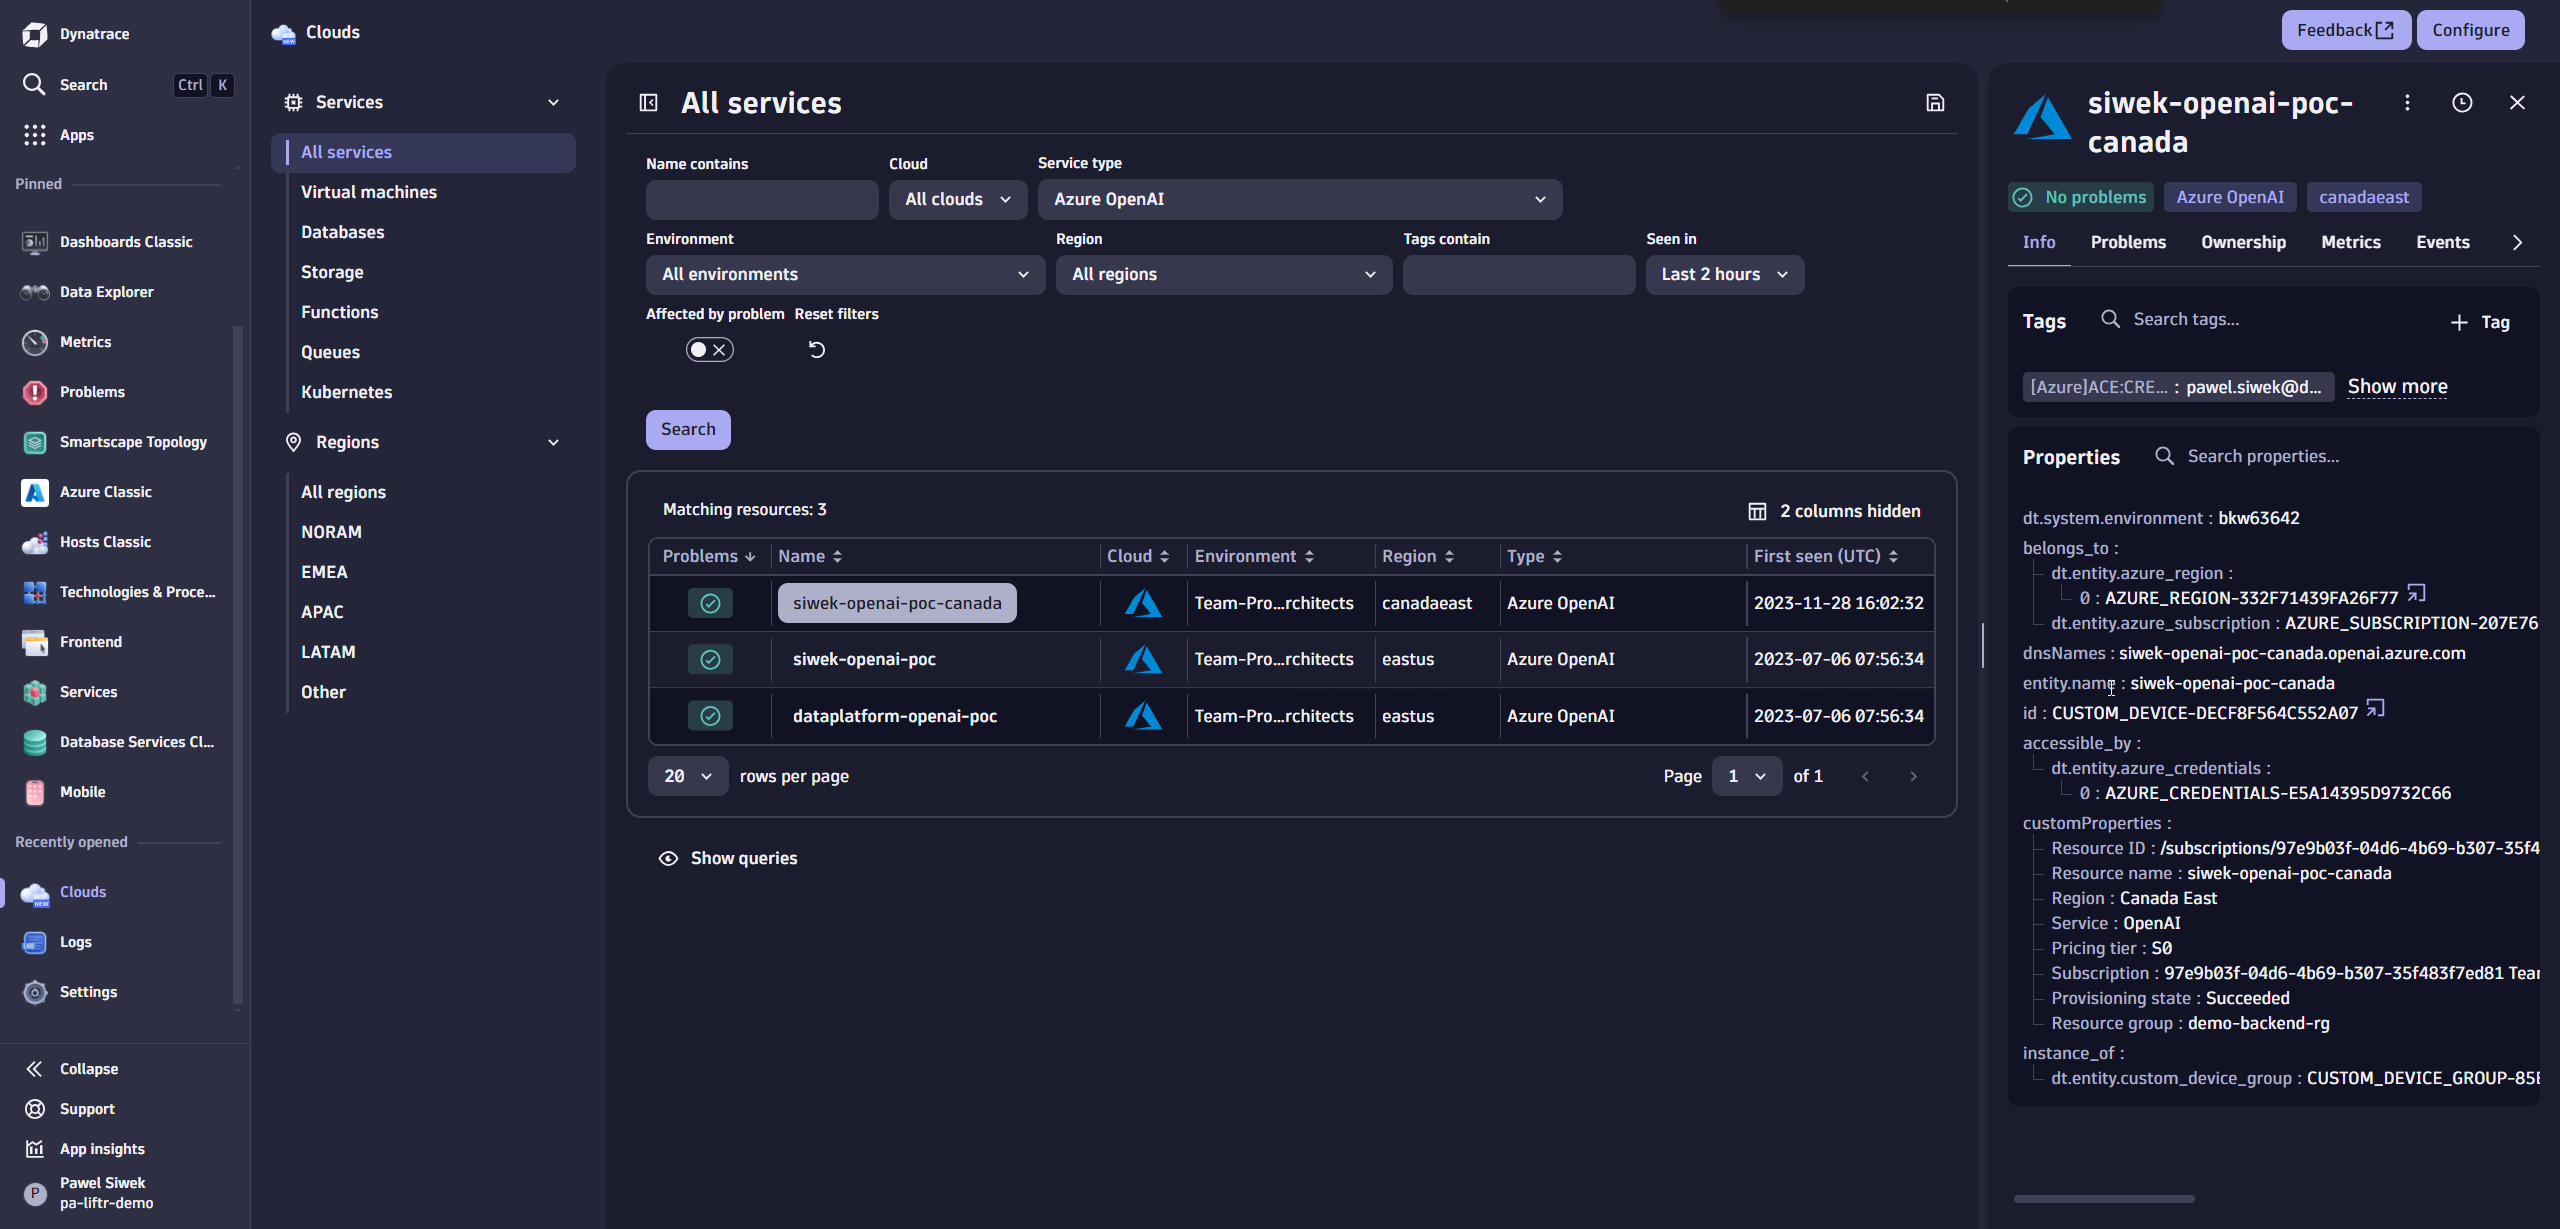
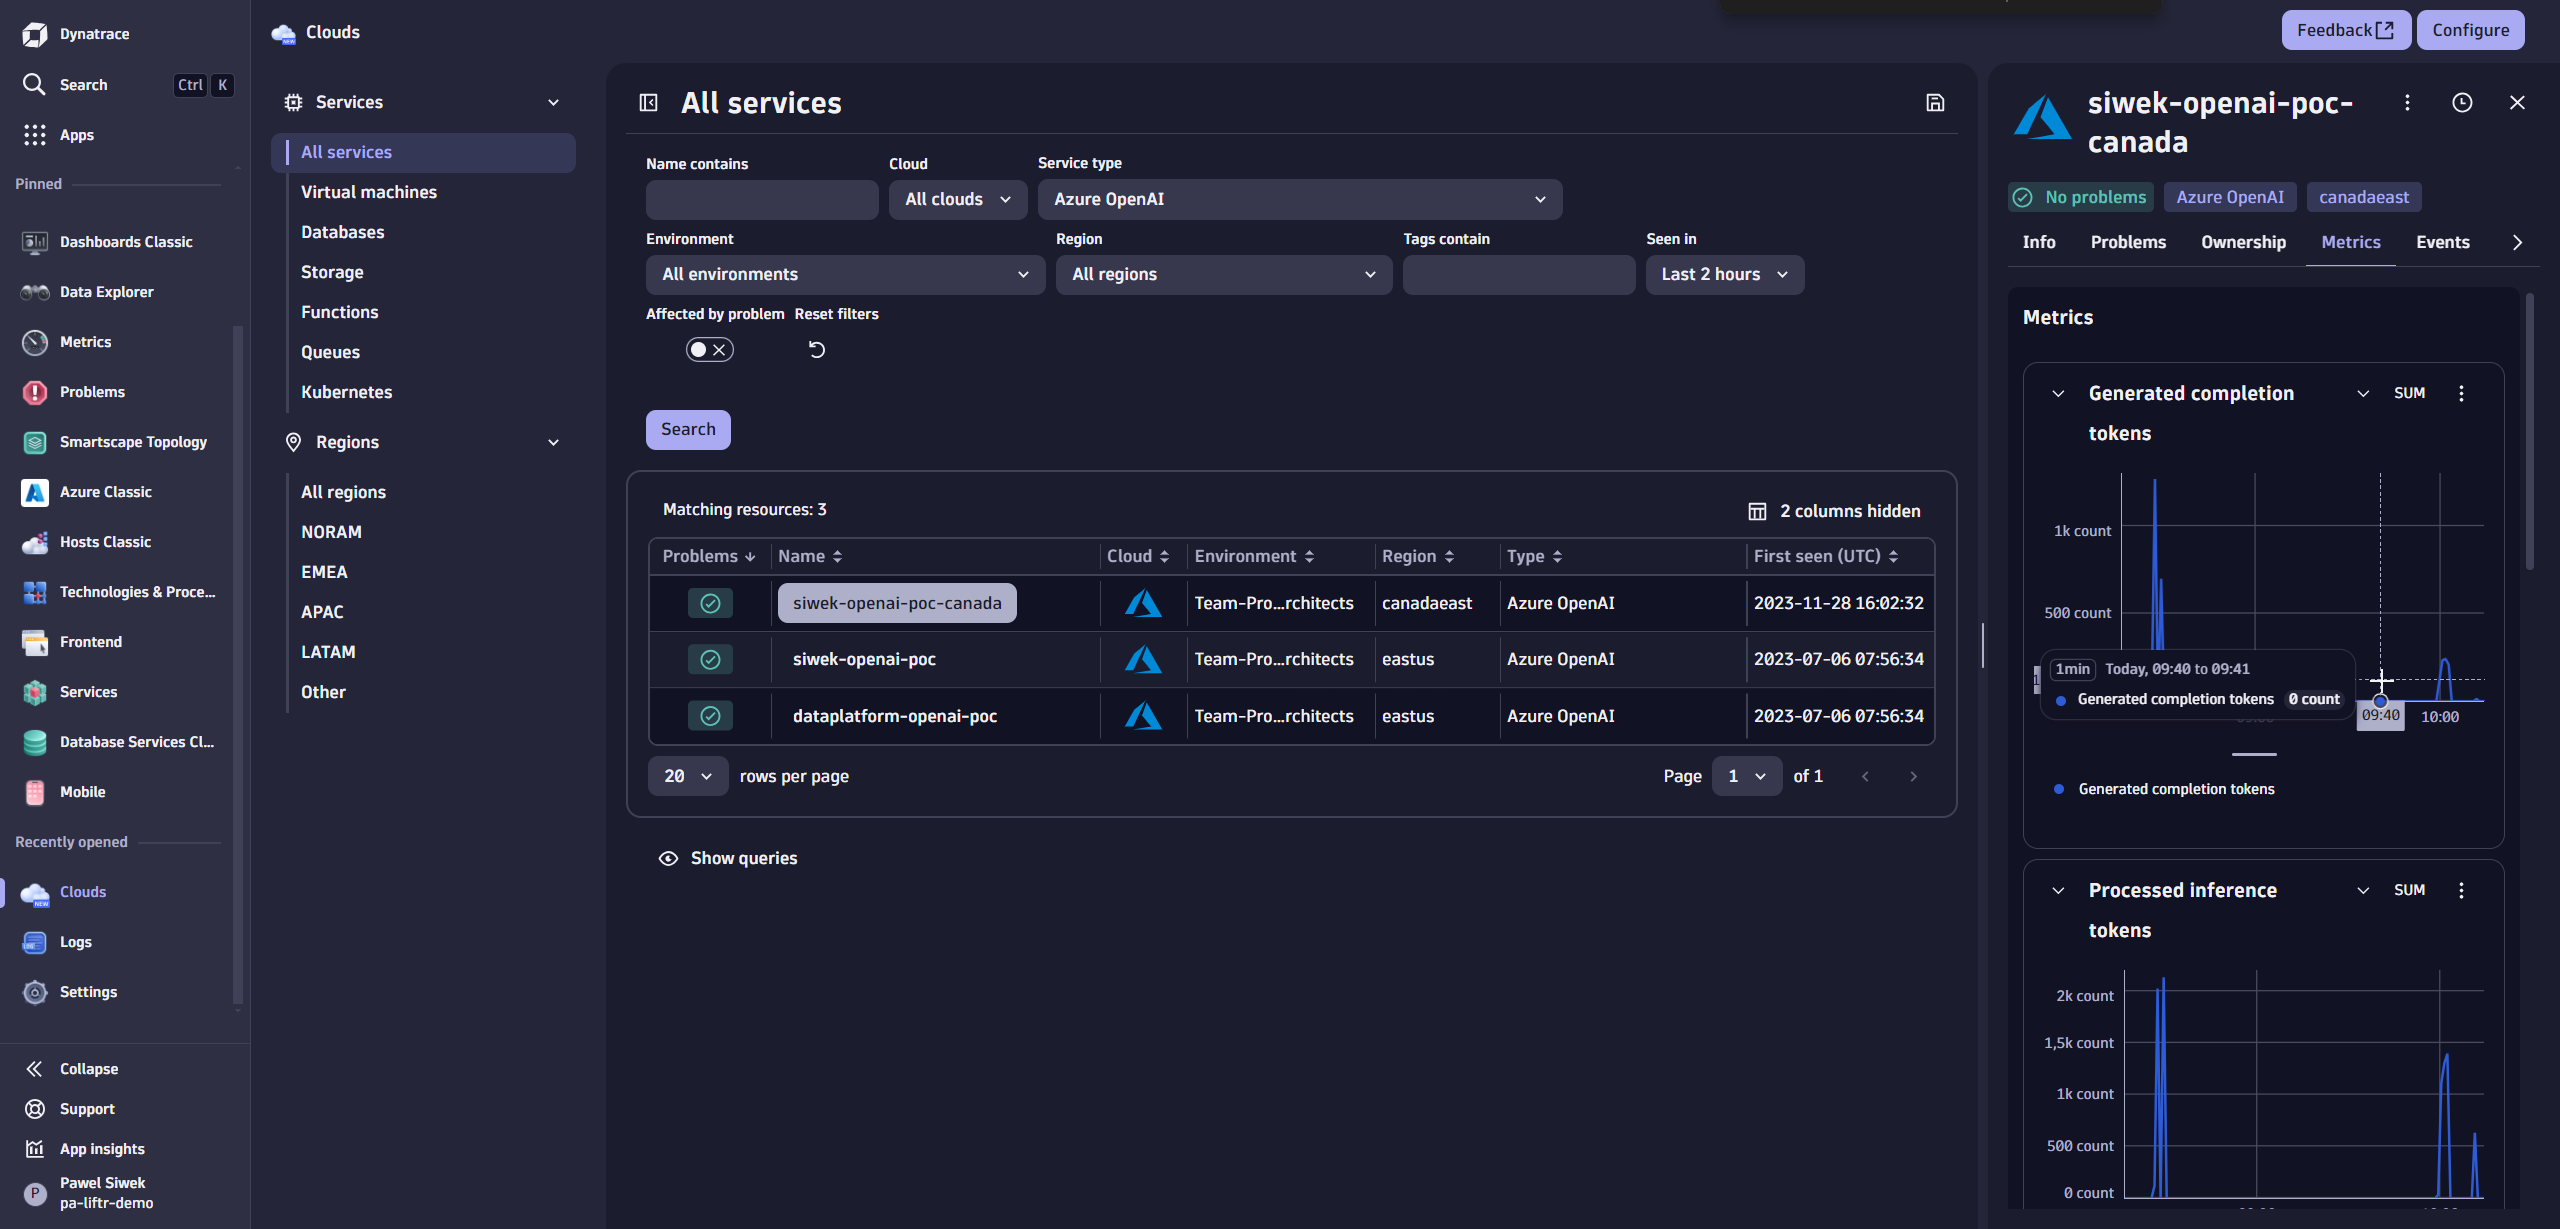
Clouds
Clouds allows easy investigation and troubleshooting of all Azure resources from the subscriptions previously connected to Dynatrace.
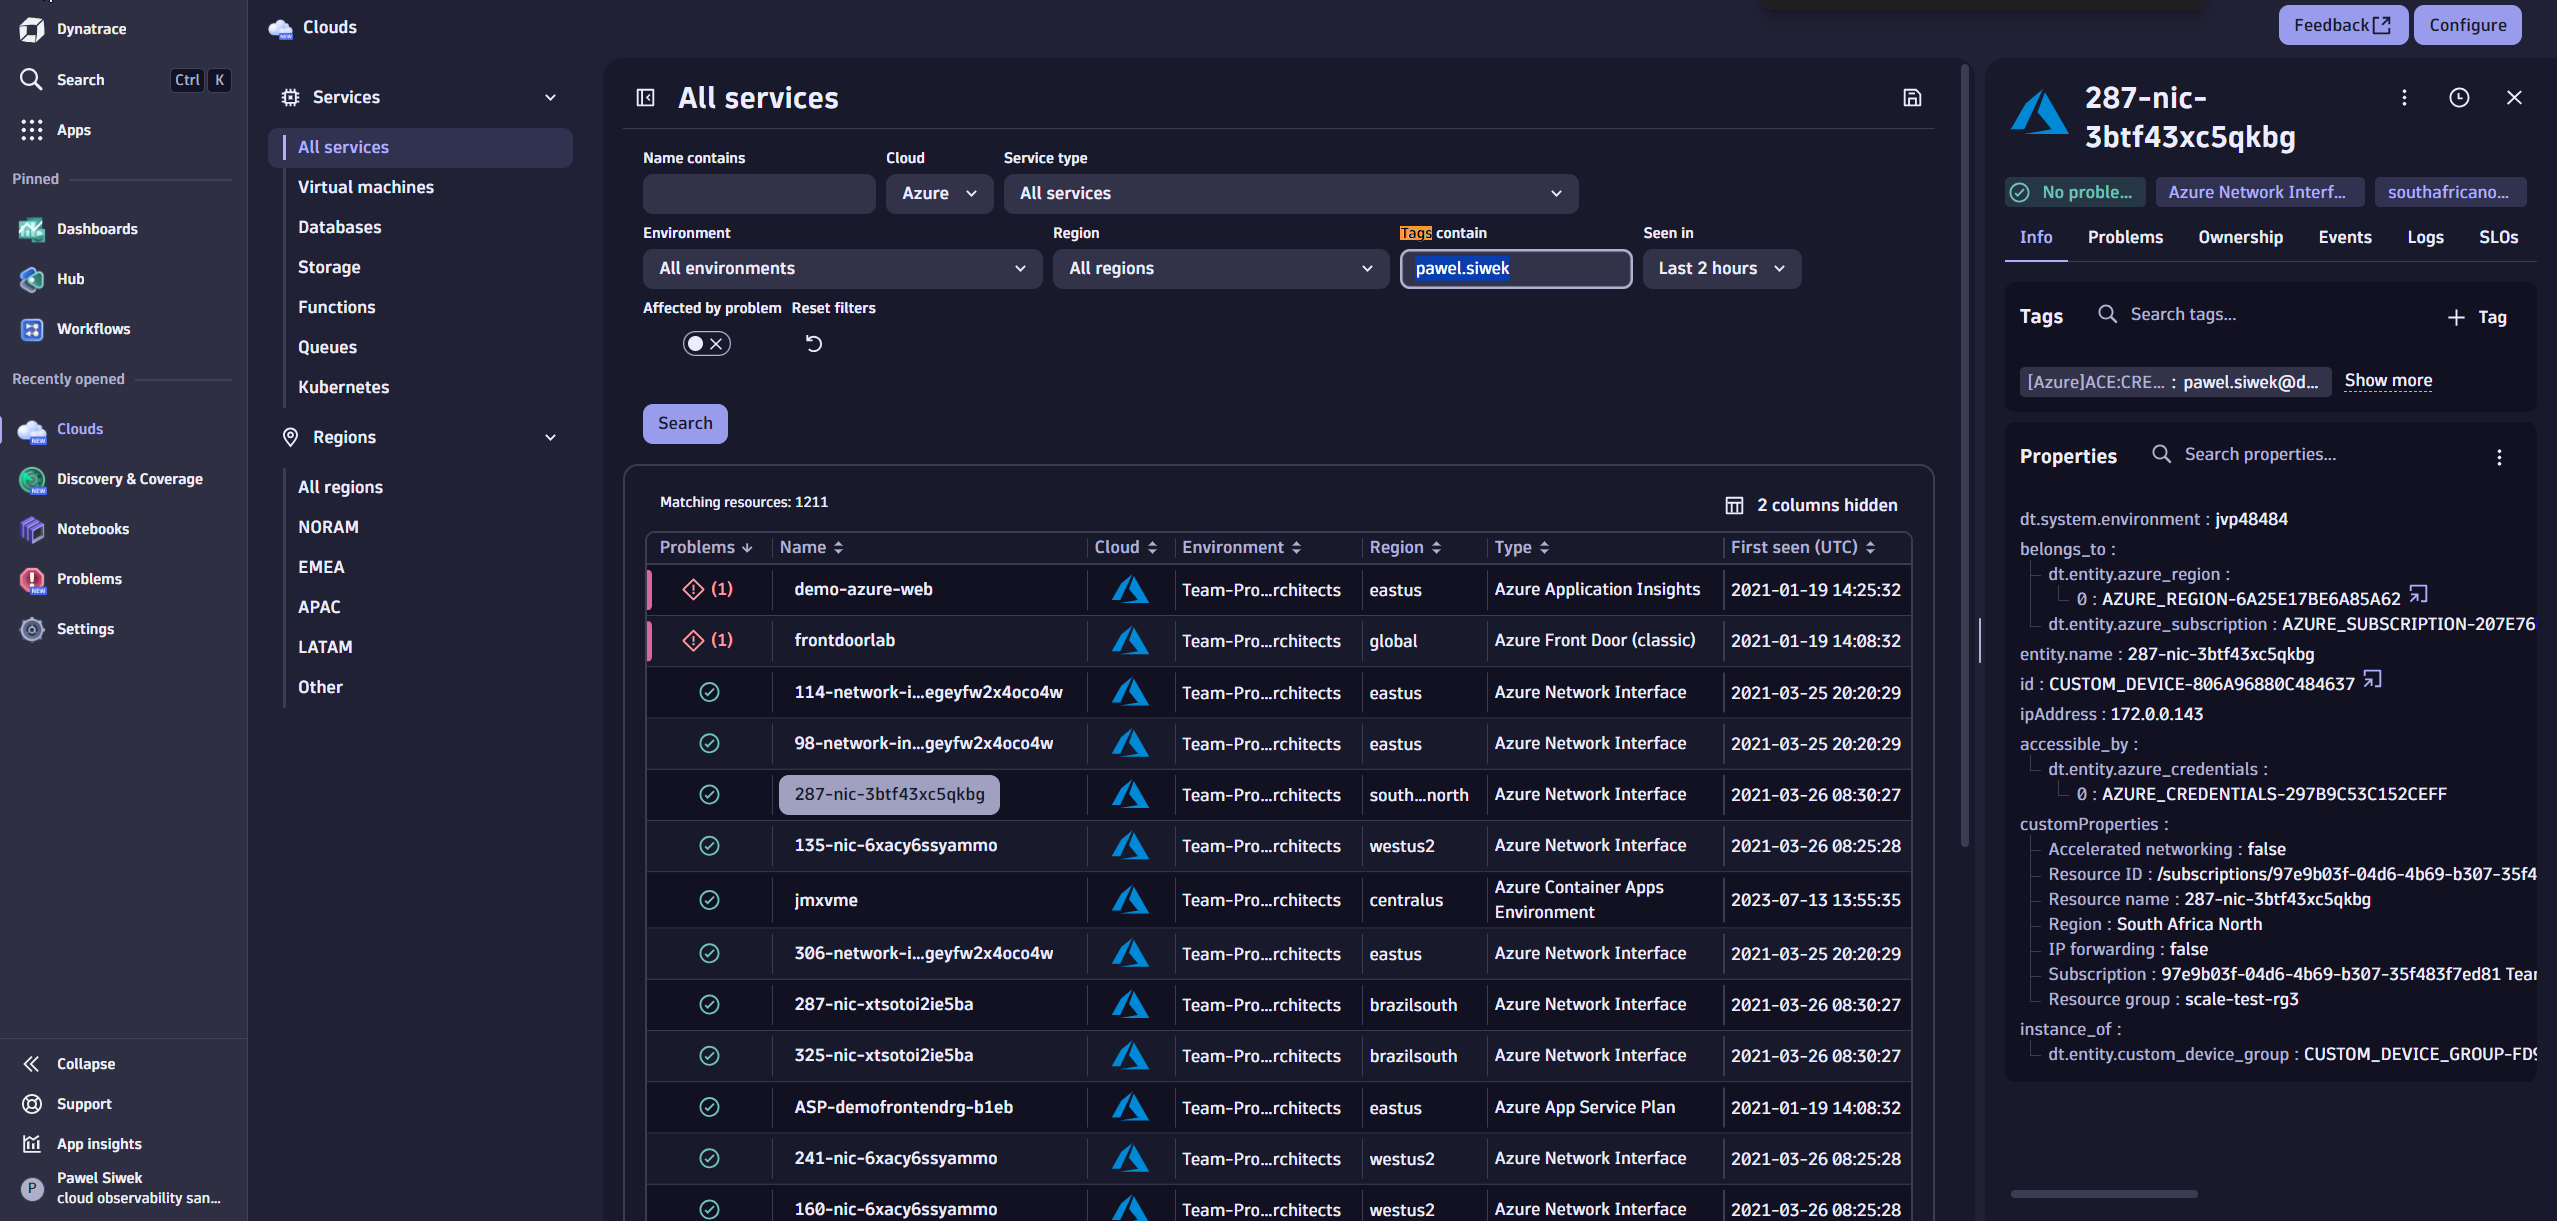
The following screenshot shows that you can easily search for resources by name, resource type, region, and tags across all connected Azure subscriptions.
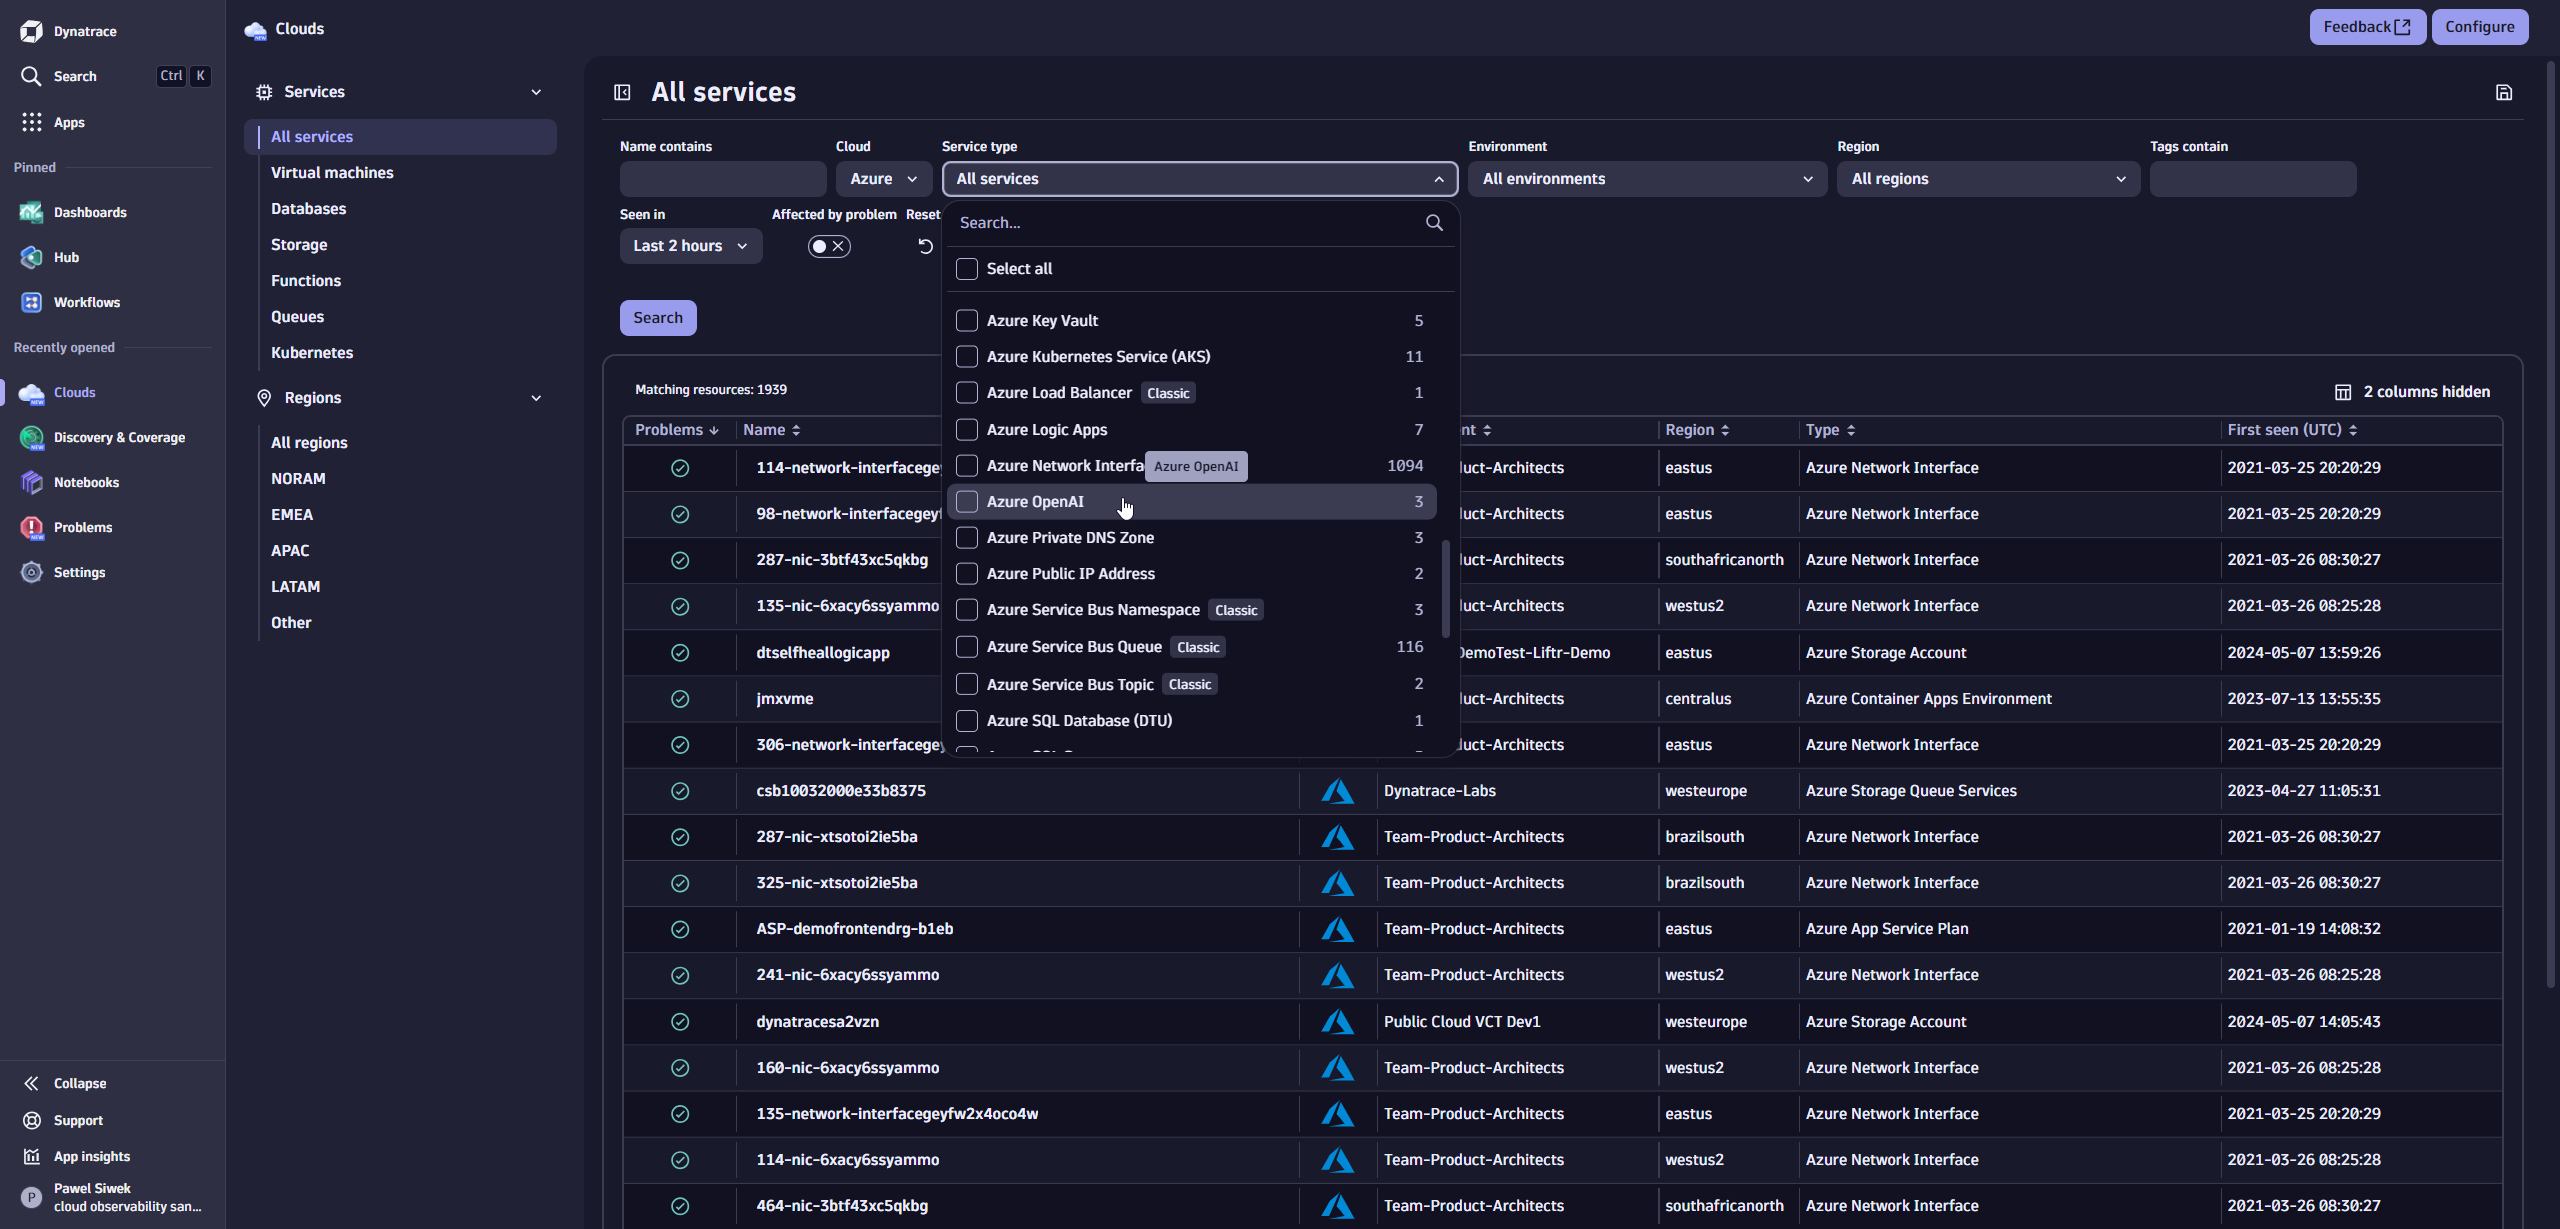
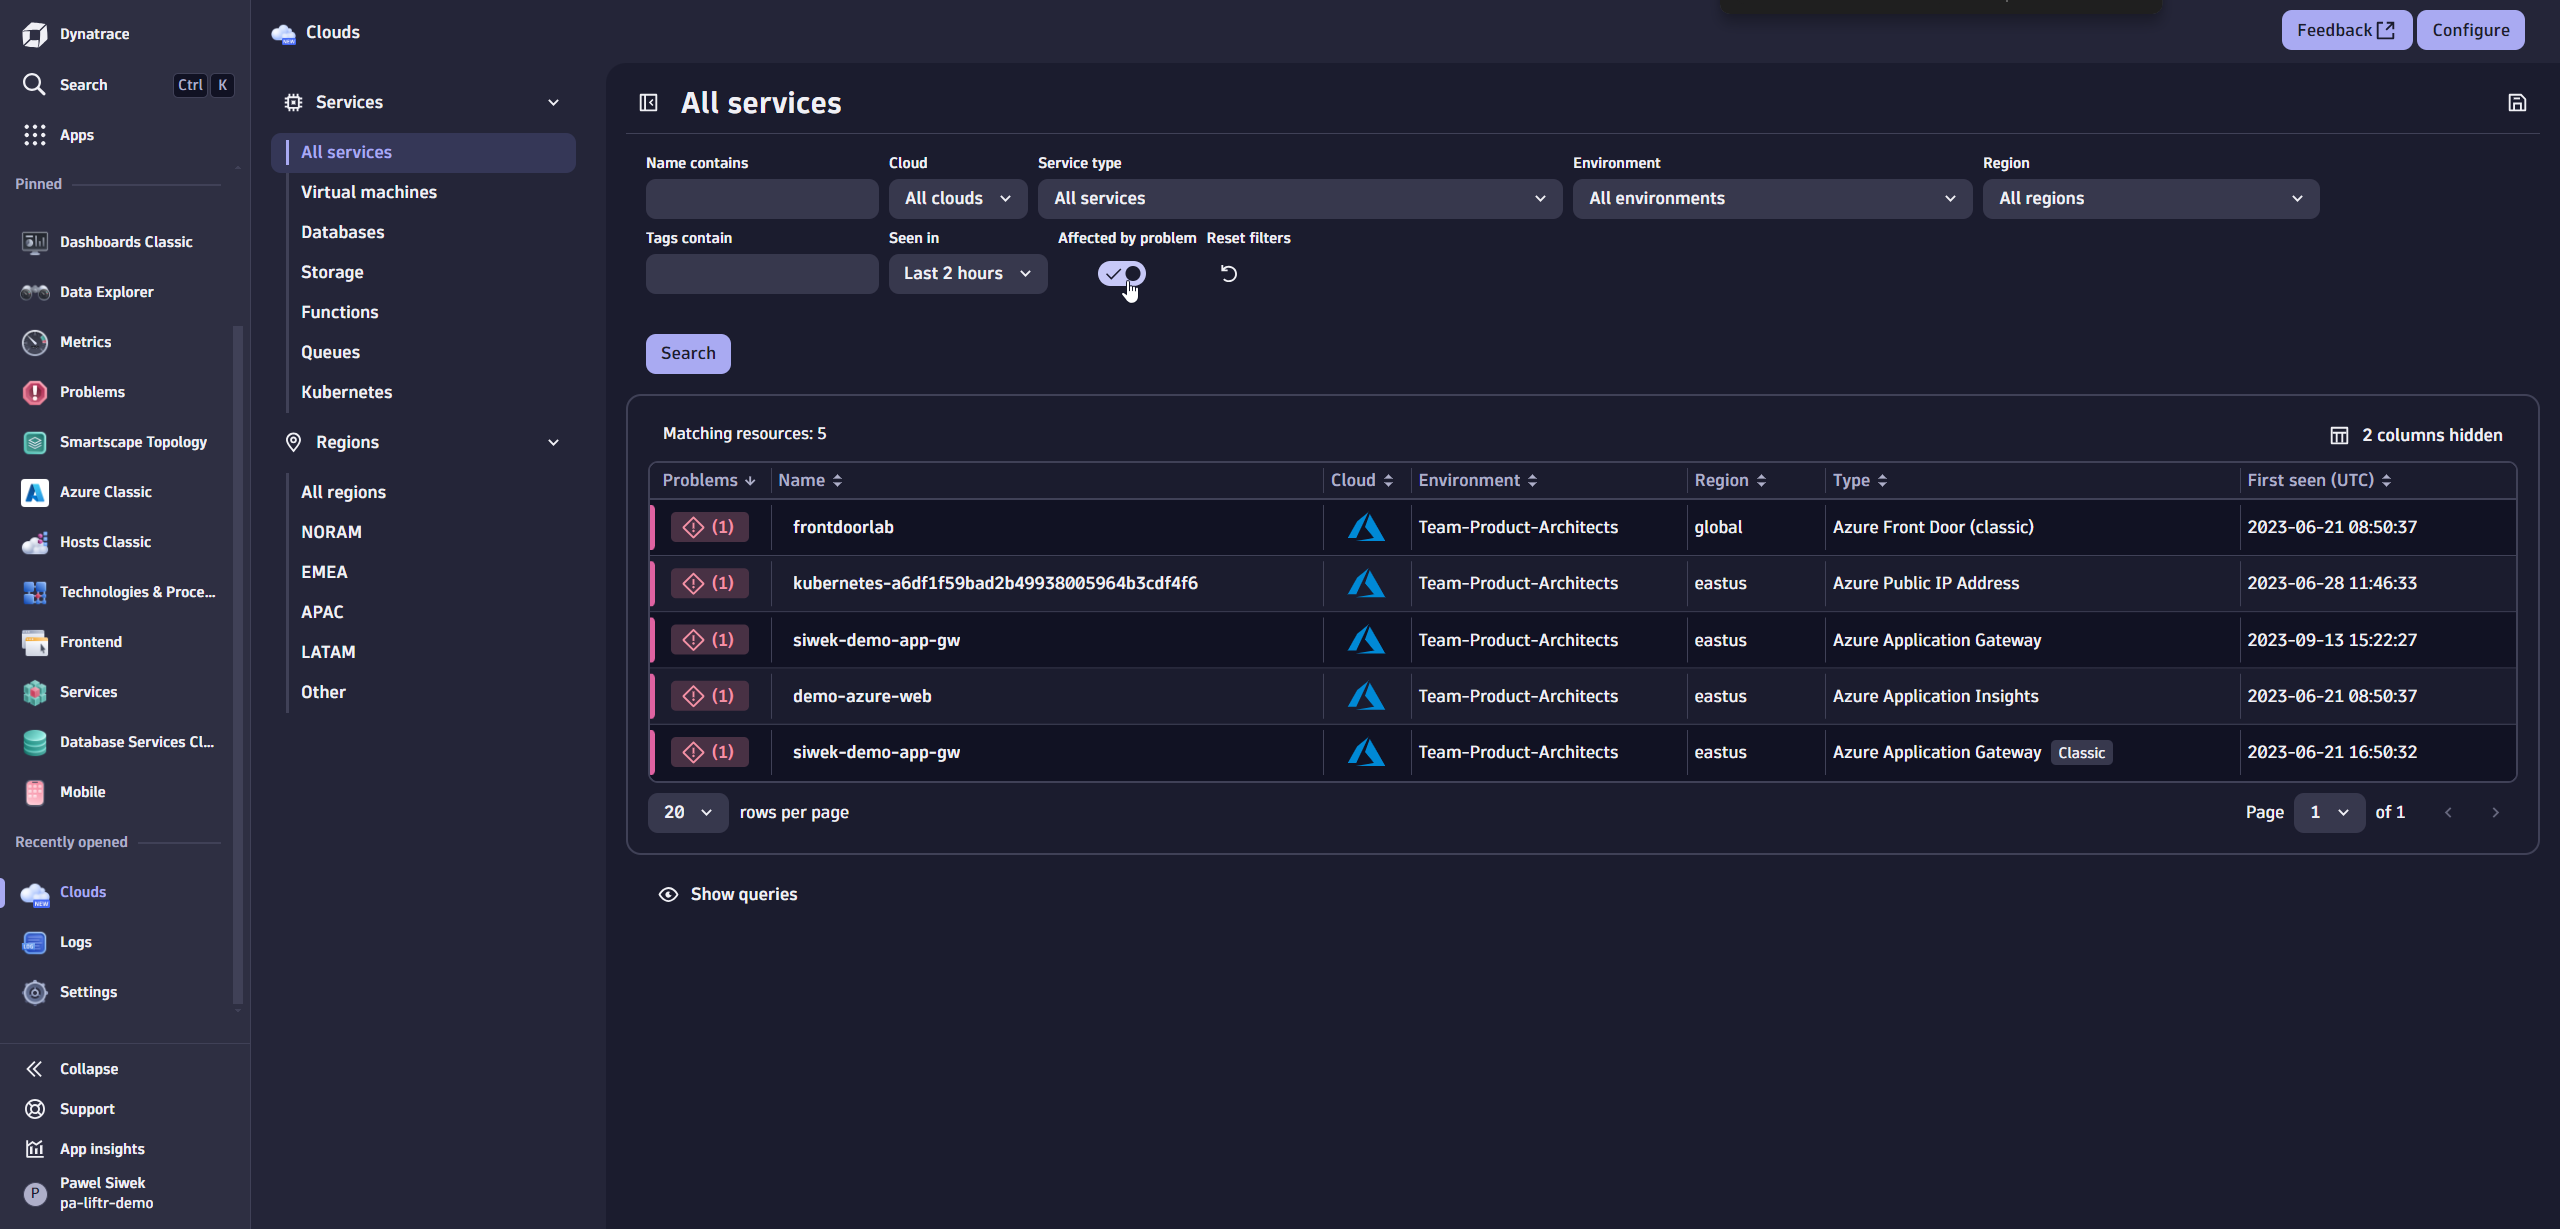
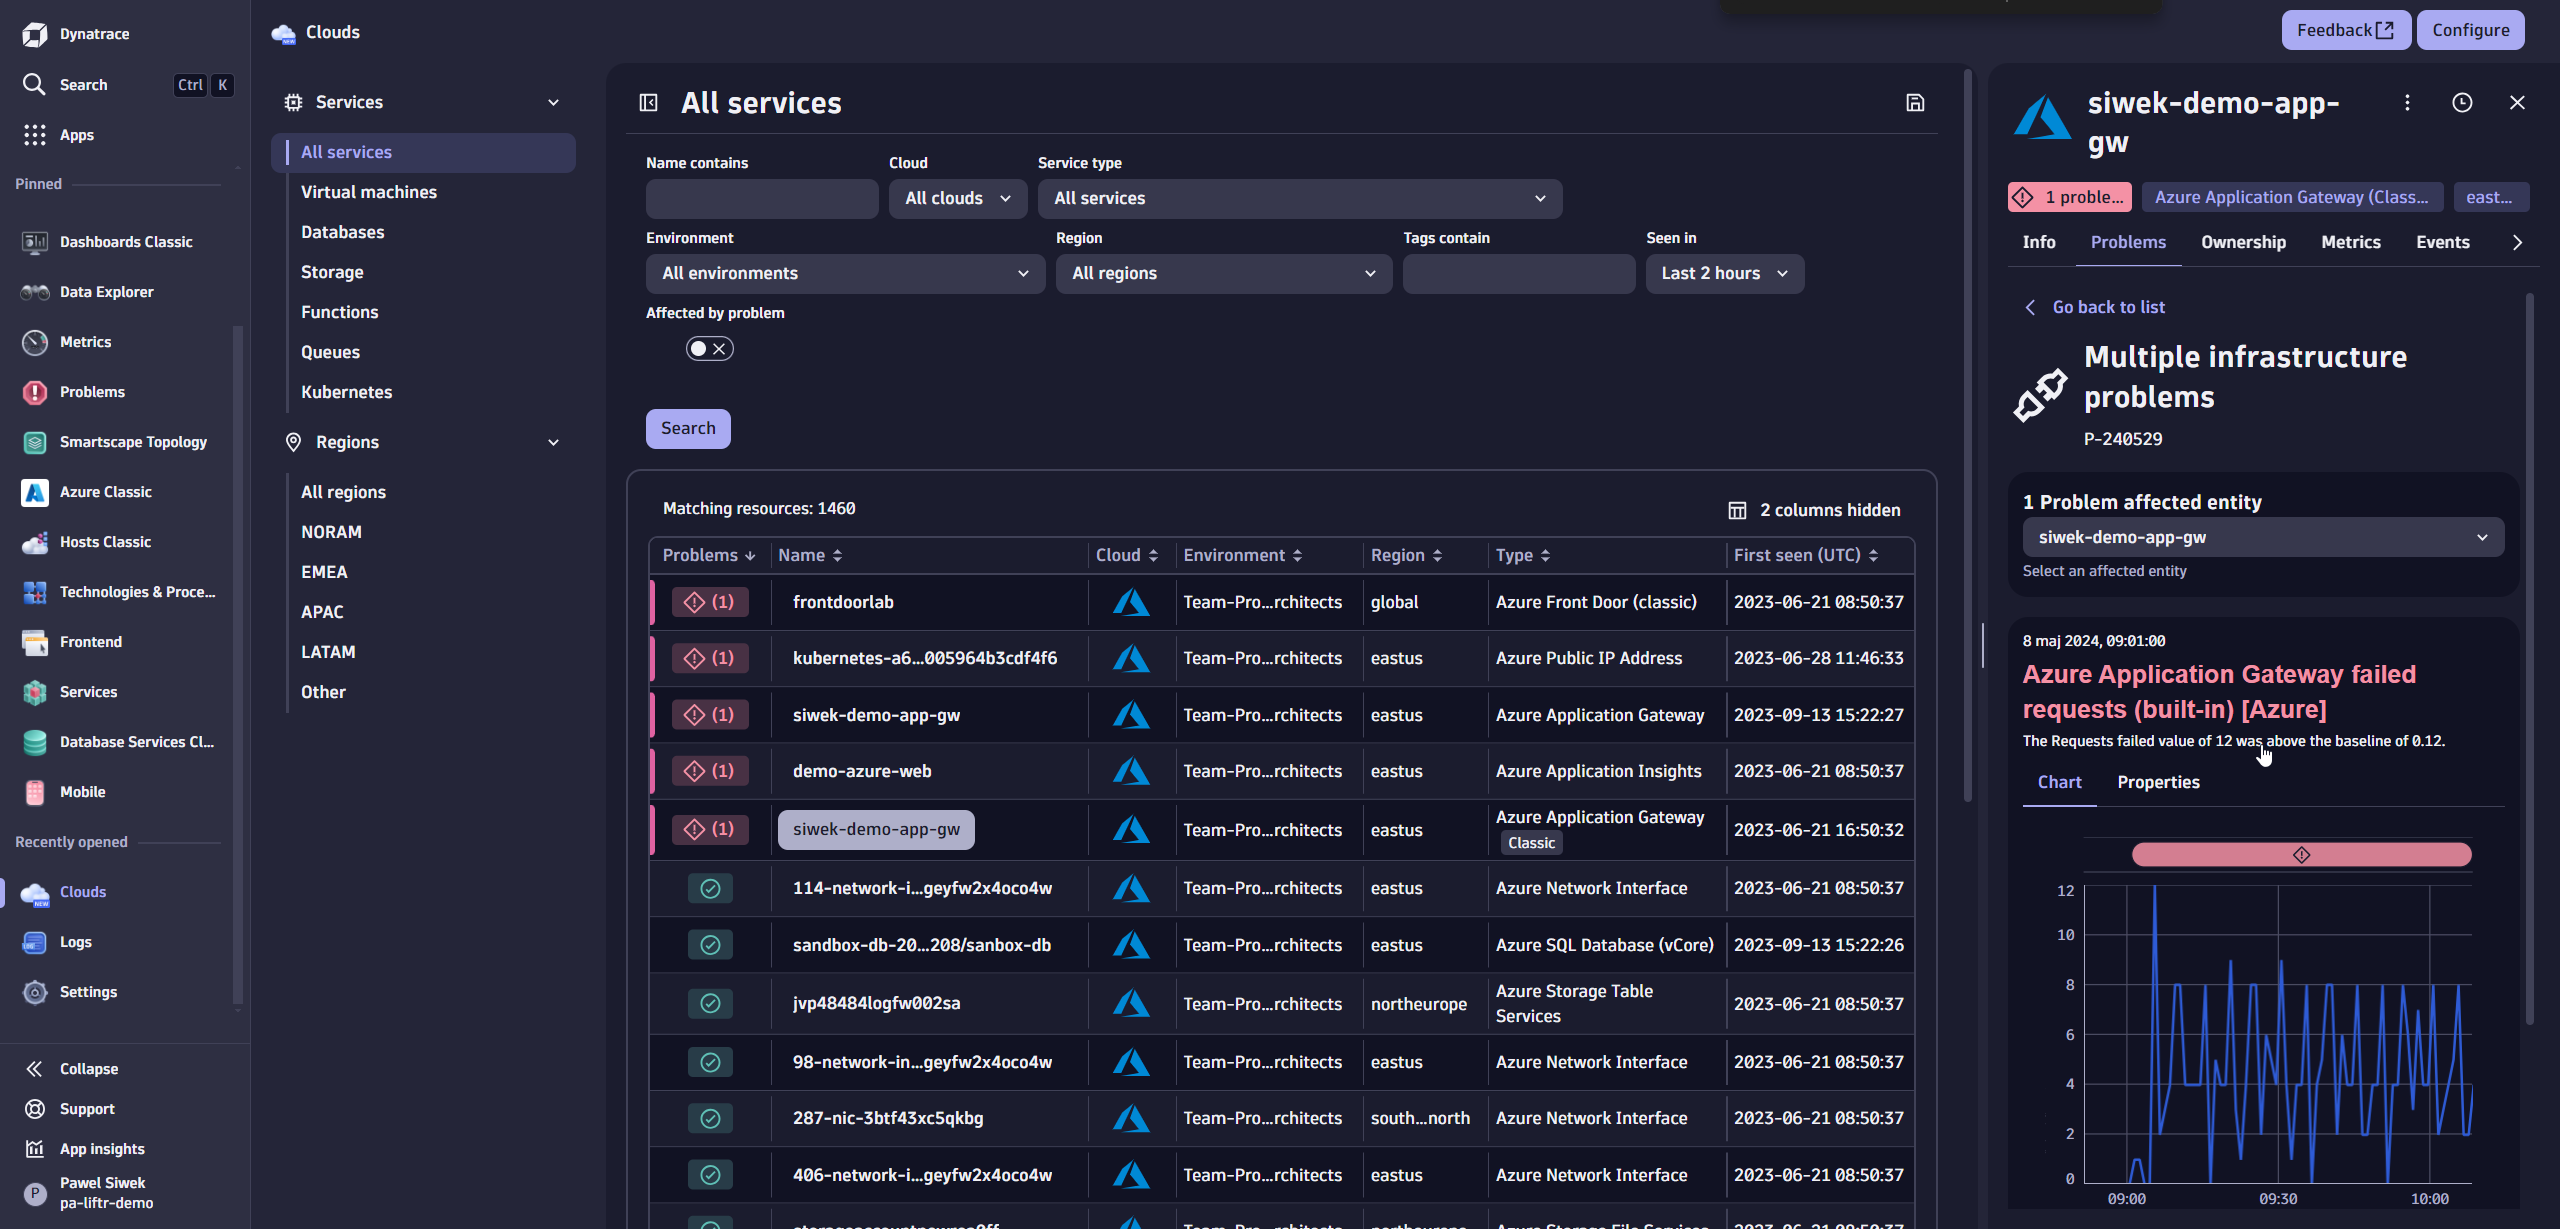
Clouds provides resource properties, metrics, problems, and events in a single view, as shown below.
Davis AI automatically analyzes ongoing problems with your resources. Clouds makes it easy to search for all resources affected by detected problems and navigate directly to the problem details.
Clouds also supports getting the necessary insights for cloud governance. For example, Dynatrace uses automatic tagging to mark the user who created an Azure resource. Searching for all resources with a specific tag (for example, created-by) across your connected Azure subscriptions is easy with Clouds.
Dashboards
Dashboards provides new dashboarding capabilities powered by the new Dynatrace platform query language (DQL), which fully leverages the new Dynatrace experience.
With DQL and Dashboards, combining all observability data in one dashboard is easy. For example, it’s possible to combine resource metadata, resource health from activity logs, Azure Monitor metrics, Davis AI problems, OneAgent process details, Synthetic monitoring results, and much more in a single view, as shown below.
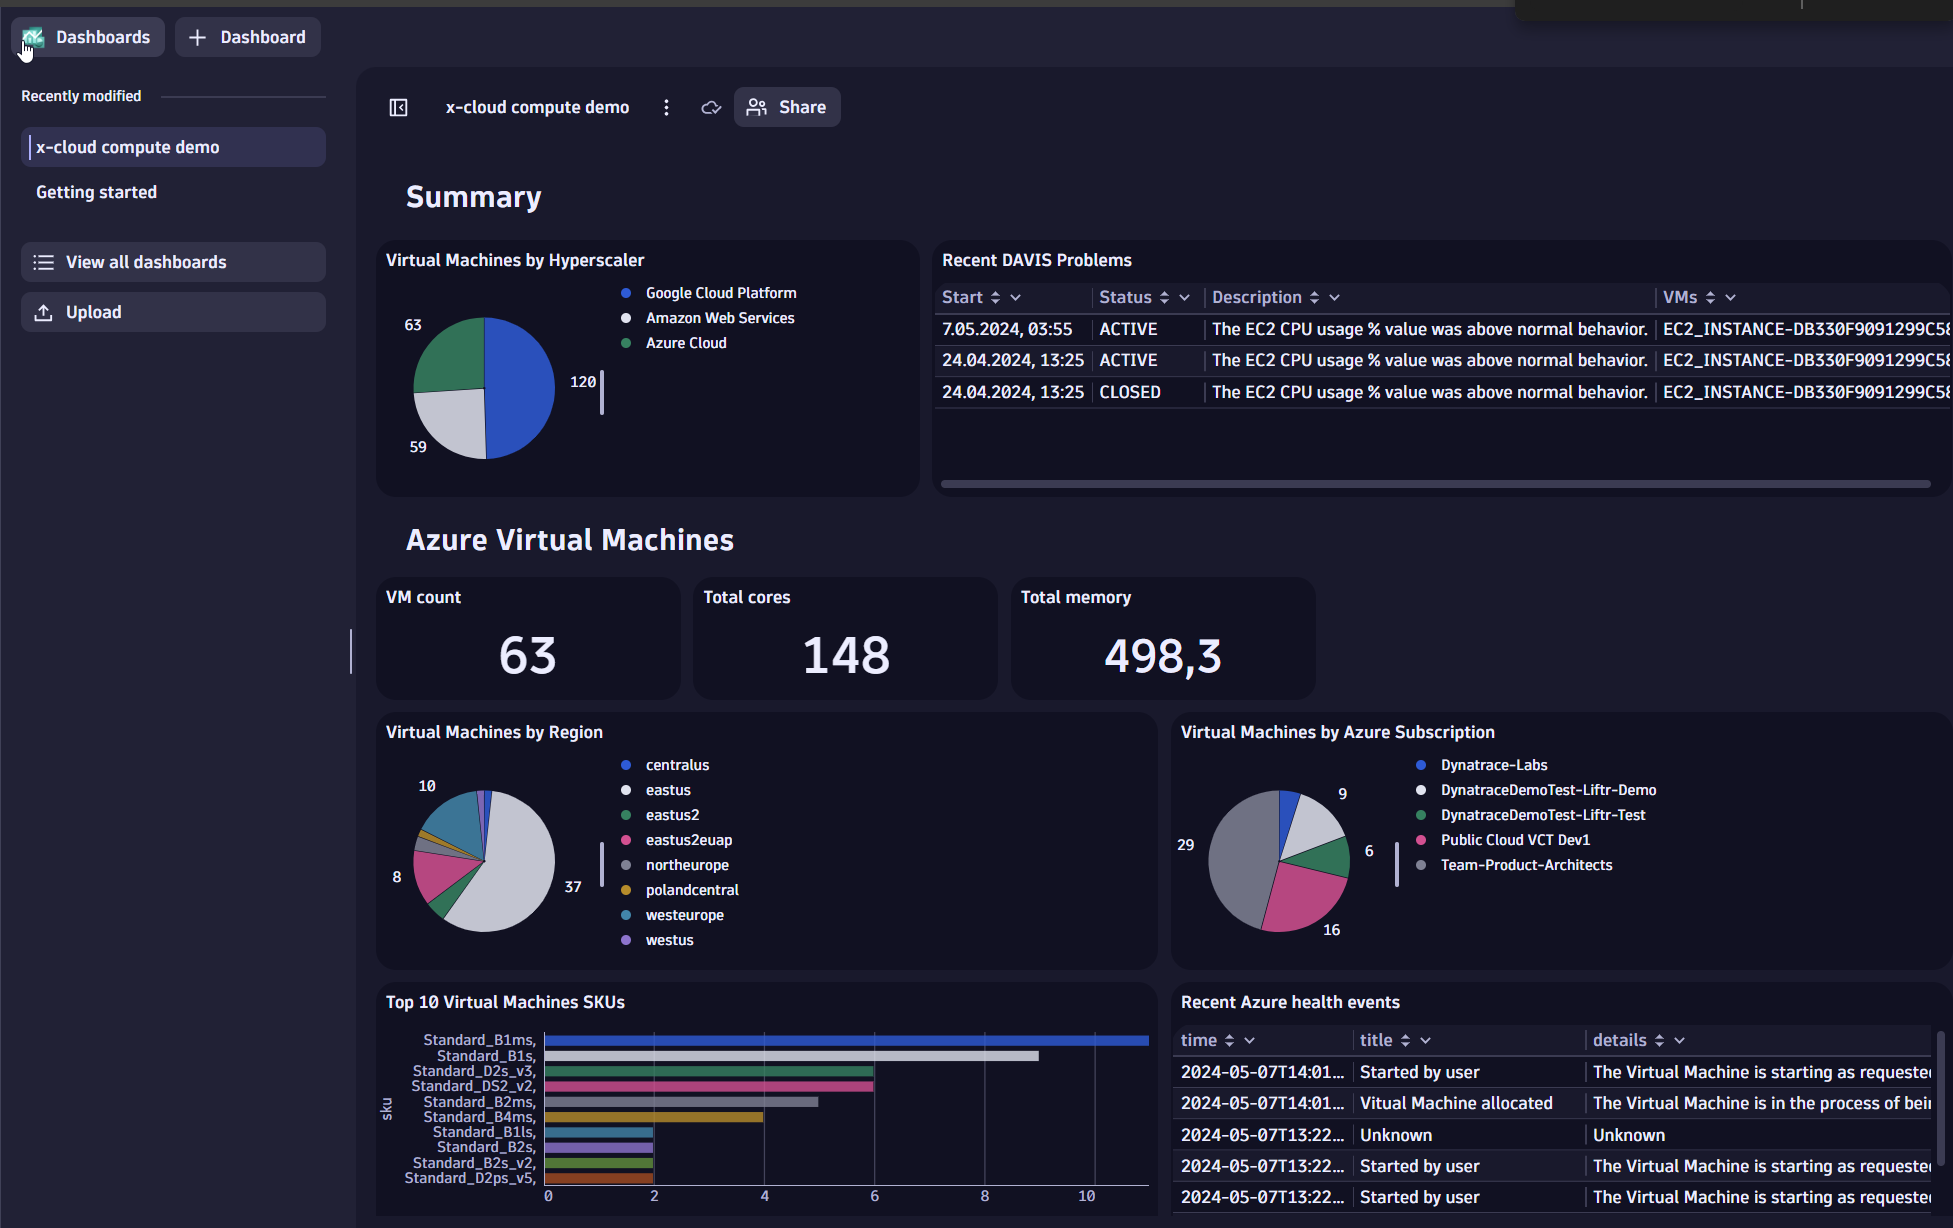
For each section, it’s possible to drill down for detailed context and learn the underlying DQL query.
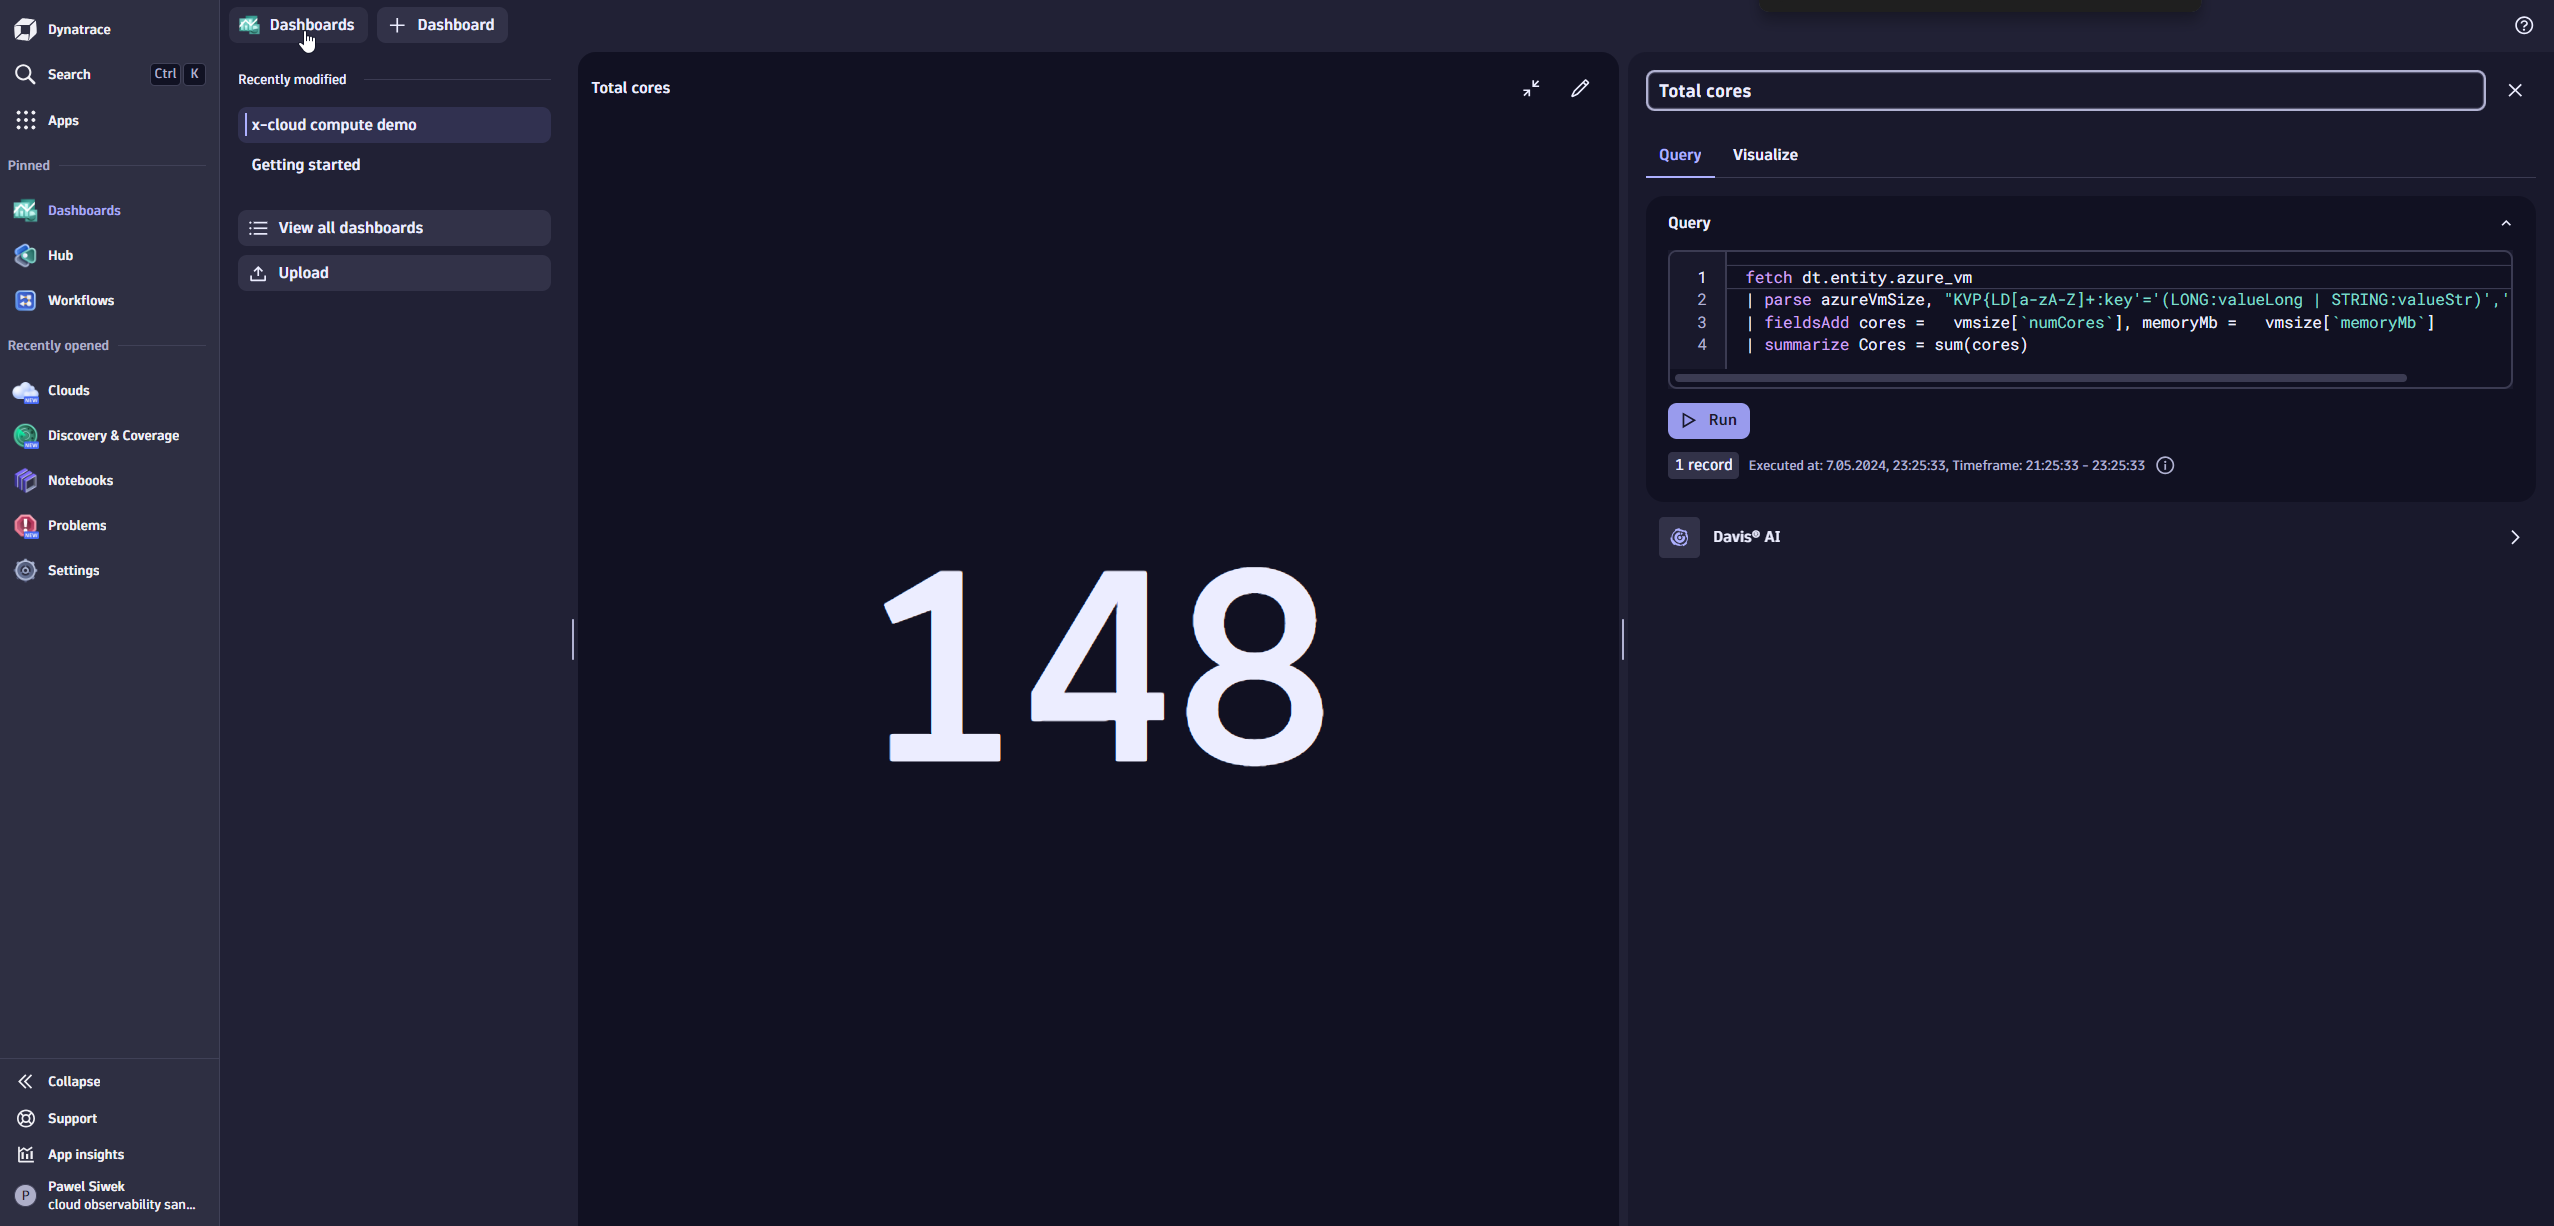
The following shows a simple DQL summarizing all Azure Virtual Machine cores in the connected Azure subscriptions. By querying the Dynatrace entity model, cores are summed up from entity metadata.
fetch dt.entity.azure_vm
| parse azureVmSize, "KVP{LD[a-zA-Z]+:key'='(LONG:valueLong | STRING:valueStr)','?}:vmsize"
| fieldsAdd cores =   vmsize[`numCores`], memoryMb =   vmsize[`memoryMb`]
| summarize Cores = sum(cores)
Notebooks
Dynatrace Platform offers Notebooks, which allows advanced ad-hoc analysis of Azure environments based on metrics, logs, spans, events, and entities.
The following DQL from Notebooks queries data for all recent Azure health events and aggregates all resource health events from all Azure subscriptions connected via the Azure Native Dynatrace service.
fetch logs //, scanLimitGBytes: 500, samplingRatio: 1000
| filter matchesValue(cloud.provider, "Azure")
| filter azure.resource.type == "MICROSOFT.COMPUTE/VIRTUALMACHINES" or azure.resource.type == "MICROSOFT.COMPUTE/VIRTUALMACHINESCALESETS/VIRTUALMACHINES"
| parse content, "JSON:json"
| fieldsAdd operationName=json[operationName],
category=json[category],
resultType=json[resultType],
callerIpAddress=json[callerIpAddress],
action=json[identity][authorization][action] ,
principalId=json[identity][authorization][evidence][principalId] ,
principalType=json[identity][authorization][evidence][principalType] ,
name=coalesce(json[identity][claims][name],json[identity][claims][xms_mirid]),
time= json[time],
title=json[properties][title],
details=json[properties][details],
current=json[properties][currentHealthStatus],
previous=json[properties][previoustHealthStatus],
type=json[properties][type],
cause=json[properties][cause]
| filter  category== "ResourceHealth"
| fieldsKeep  time, title, details, type, cause, azure.resource.name
| sort  time desc
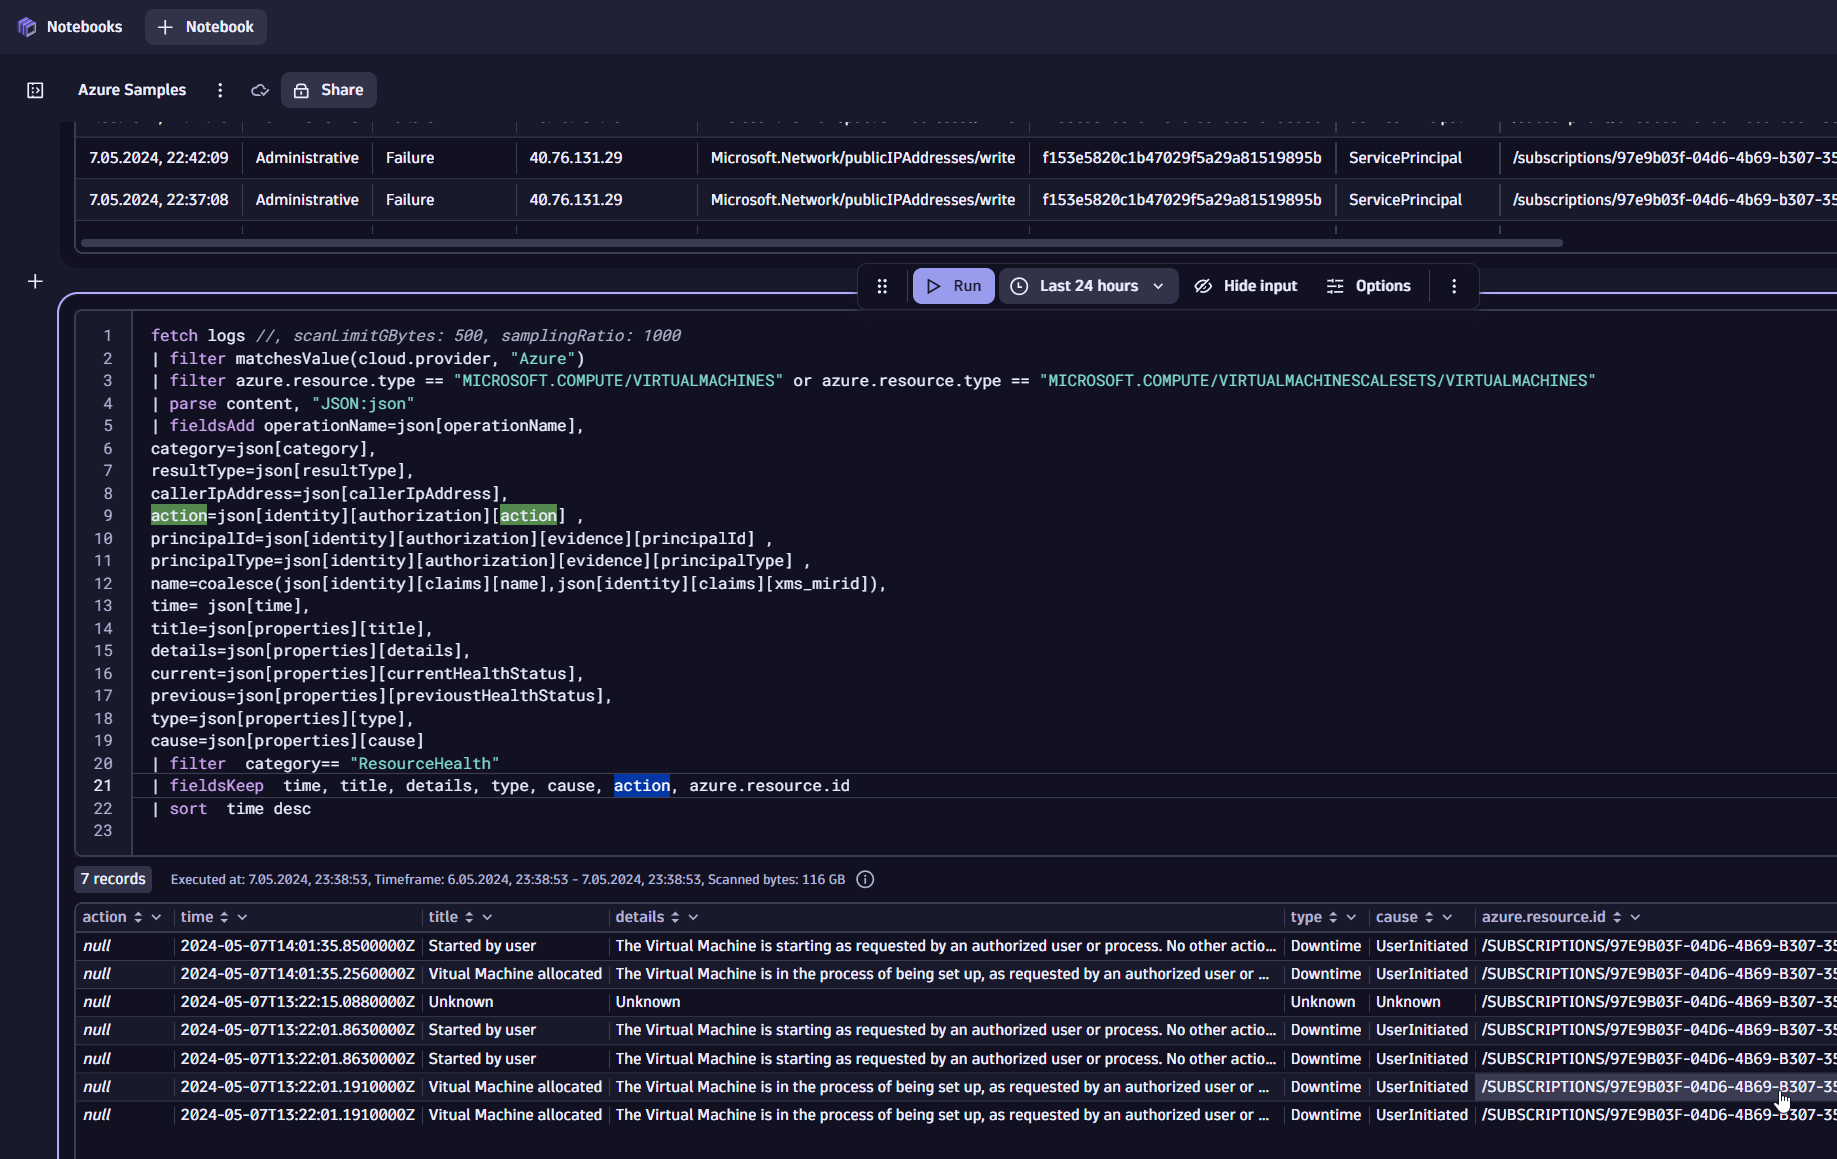
Utilizing the Dynatrace platform to observe your Azure subscriptions allows you to address compliance requirements beyond the standard; for example, the retention period for Azure activity logs is 90 days. With Dynatrace, you can configure up to a 10-year retention period in Dynatrace Grail (for full details, see data retention periods).
Here are further examples that show the power of DQL and Grail for Azure analysis:
Count the number of VMs per Azure Subscription
fetch dt.entity.azure_vm
| fieldsAdd  azure_subscription = accessible_by[dt.entity.azure_subscription][0], azure_region = belongs_to[dt.entity.azure_region]
| lookup [fetch dt.entity.azure_subscription | fieldsAdd name = entity.name ,  uuid = azureSubscriptionUuid], sourceField:azure_subscription, lookupField:id, prefix:"azure.subscription."
| lookup [fetch dt.entity.azure_region | fieldsAdd name = entity.name], sourceField:azure_region, lookupField:id, prefix:"azure.region."
| summarize  count=count(), by: azure.subscription.name
Count the number of VMs per Azure region
fetch dt.entity.azure_vm
| fieldsAdd  azure_subscription = accessible_by[dt.entity.azure_subscription][0], azure_region = belongs_to[dt.entity.azure_region]
| lookup [fetch dt.entity.azure_subscription | fieldsAdd name = entity.name ,  uuid = azureSubscriptionUuid], sourceField:azure_subscription, lookupField:id, prefix:"azure.subscription."
| lookup [fetch dt.entity.azure_region | fieldsAdd name = entity.name], sourceField:azure_region, lookupField:id, prefix:"azure.region."
| summarize  count=count(), by: azure.region.name
Identify the VMs with top CPU usage
timeseries max= max(dt.cloud.azure.vm.cpu_usage),
 by:  {dt.entity.azure_vm}
| fieldsAdd maxCpu = arrayMax(max)
| sort maxCpu desc
| lookup [fetch dt.entity.azure_vm | fieldsAdd name = entity.name, azure_subscription=accessible_by[dt.entity.azure_subscription][0],  azure_region=belongs_to[dt.entity.azure_region] ], sourceField:`dt.entity.azure_vm`, lookupField:id, prefix:"azure.vm."
| lookup [fetch dt.entity.azure_subscription | fieldsAdd name = entity.name ,  uuid = azureSubscriptionUuid], sourceField:azure.vm.azure_subscription, lookupField:id, prefix:"azure.subscription."
| lookup [fetch dt.entity.azure_region | fieldsAdd name = entity.name], sourceField:azure.vm.azure_region, lookupField:id, prefix:"azure.region."
| fieldsKeep   maxCpu,azure.vm.name, azure.subscription.name, azure.region.name
| limit 20
Get the latest 10 log lines from Azure
fetch logs | filter cloud.provider == "Azure" or cloud.provider == "azure" | sort timestamp desc | limit 10
Upgrade to Dynatrace for Azure
If you’re an existing Dynatrace customer, please contact us to learn how to upgrade to Dynatrace on Azure. An overview of how to upgrade to Dynatrace is available in our guide, Upgrade to Dynatrace SaaS.
Get started with the AI-powered Dynatrace platform and Azure Native Dynatrace Service
Visit the Azure marketplace to start a trial of the Dynatrace platform on Azure and the Azure Native Dynatrace Service.
Please see Data Security Controls in Dynatrace documentation for an overview of the Azure regions currently supported by Dynatrace.


Looking for answers?
Start a new discussion or ask for help in our Q&A forum.
Go to forum