
Real-time, AI-powered Dashboards
Visualize and explore all your observability, security, and business data effortlessly and in context.


Create interactive dashboards with rich visualizations in seconds
Visualize any data from your platform instantly, with no query language required. Choose from a set of curated visualizations and customization options.
Leverage AI to take your dashboarding to the next level
Expand your understanding of your data by leveraging Dynatrace Intelligence to execute truly insightful queries via natural language interface. Analyze charts with Dynatrace Intelligence to spot anomalies instantly or to predict future trends and risks.
Visualize any data from anywhere and get rid of silos
Search for any data type across our Platform and combine them even with external data in a single view. Incorporate RUM, metrics, logs, events, traces and security data for true end-to-end observability.
Faster troubleshooting through seamless drill-downs and collaboration
Get all the necessary details instantly by jumping from your Dashboards into use-case-specific applications for Kubernetes, Cloud, Logs, Services or many others. Create cross-collaborative documents or worfklows and share findings with your teams.
Explore our Dashboards
-
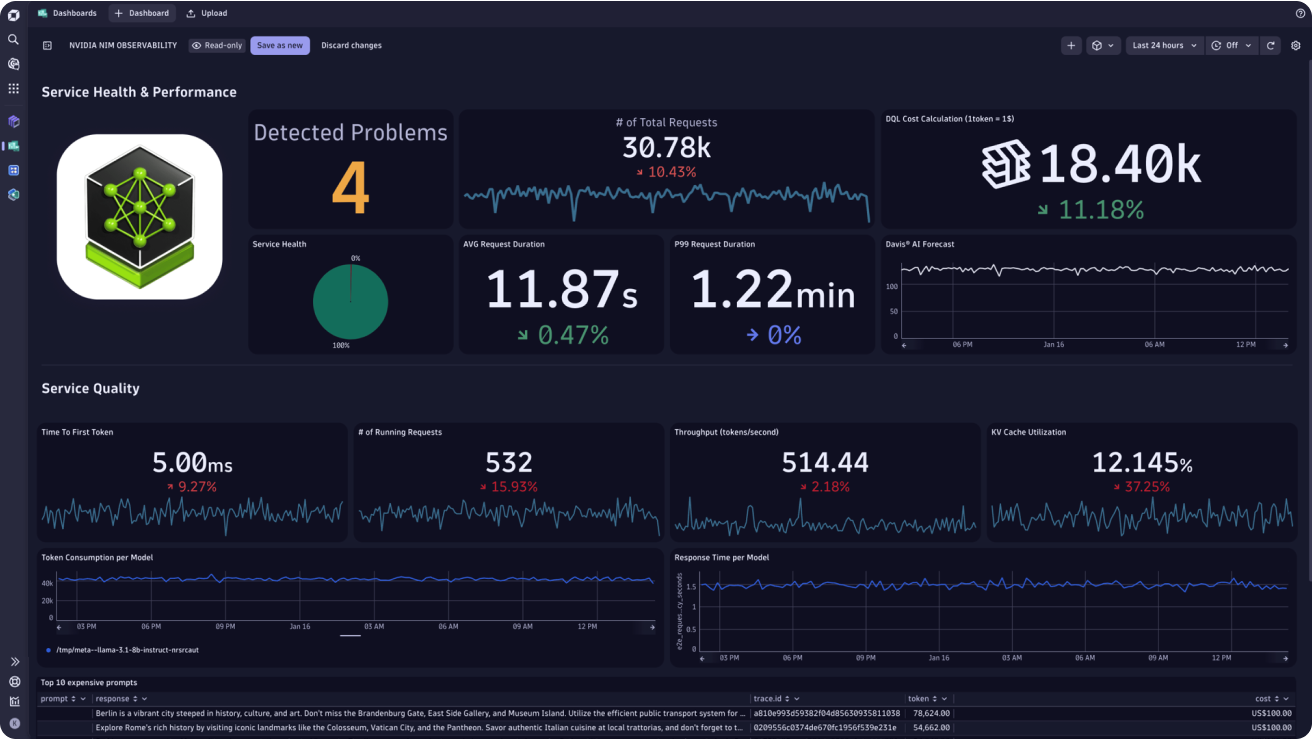
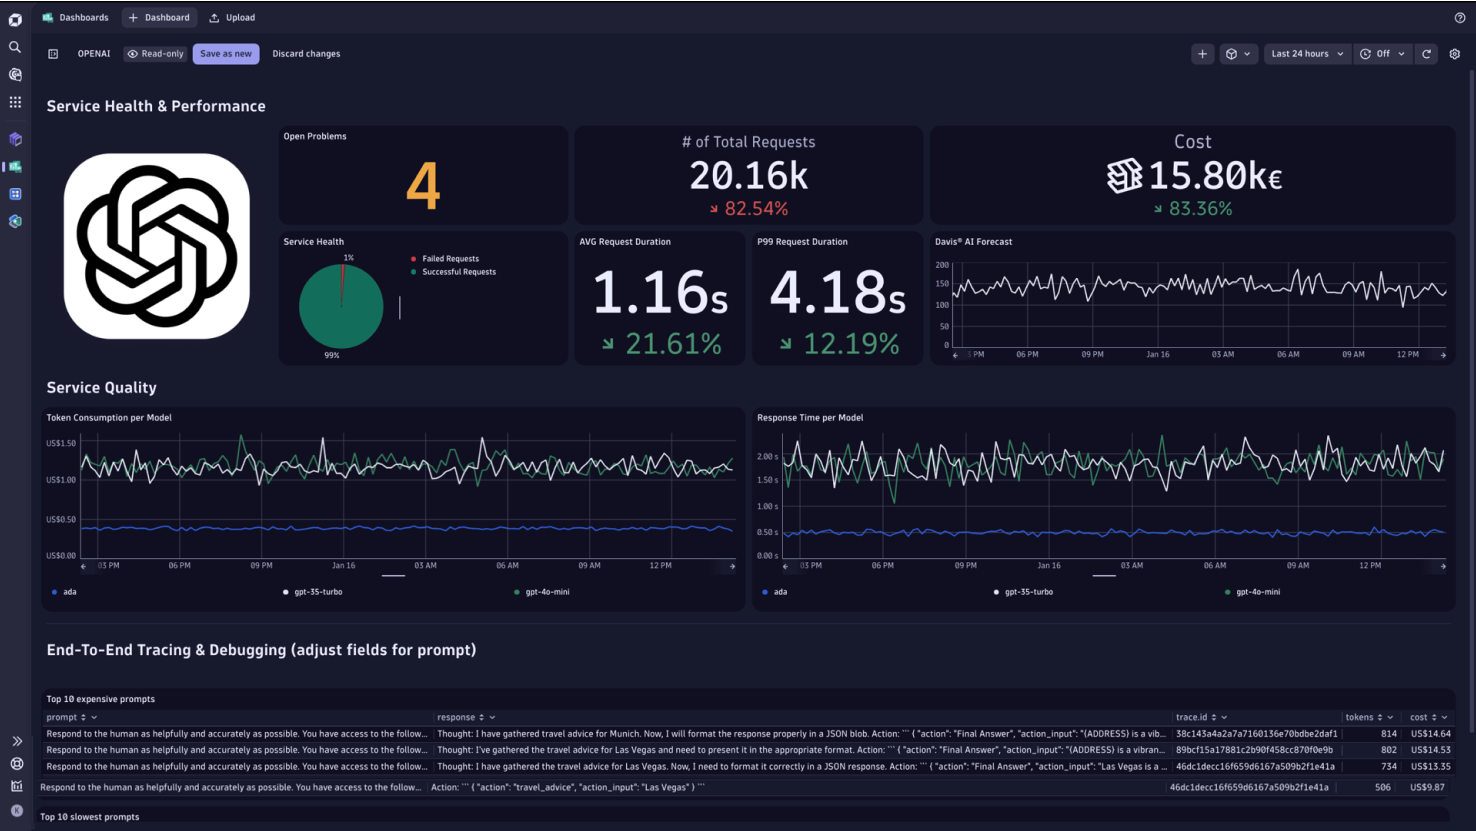
AI Observability
Monitor service health, performance, quality and cost of your genAI integration.
-
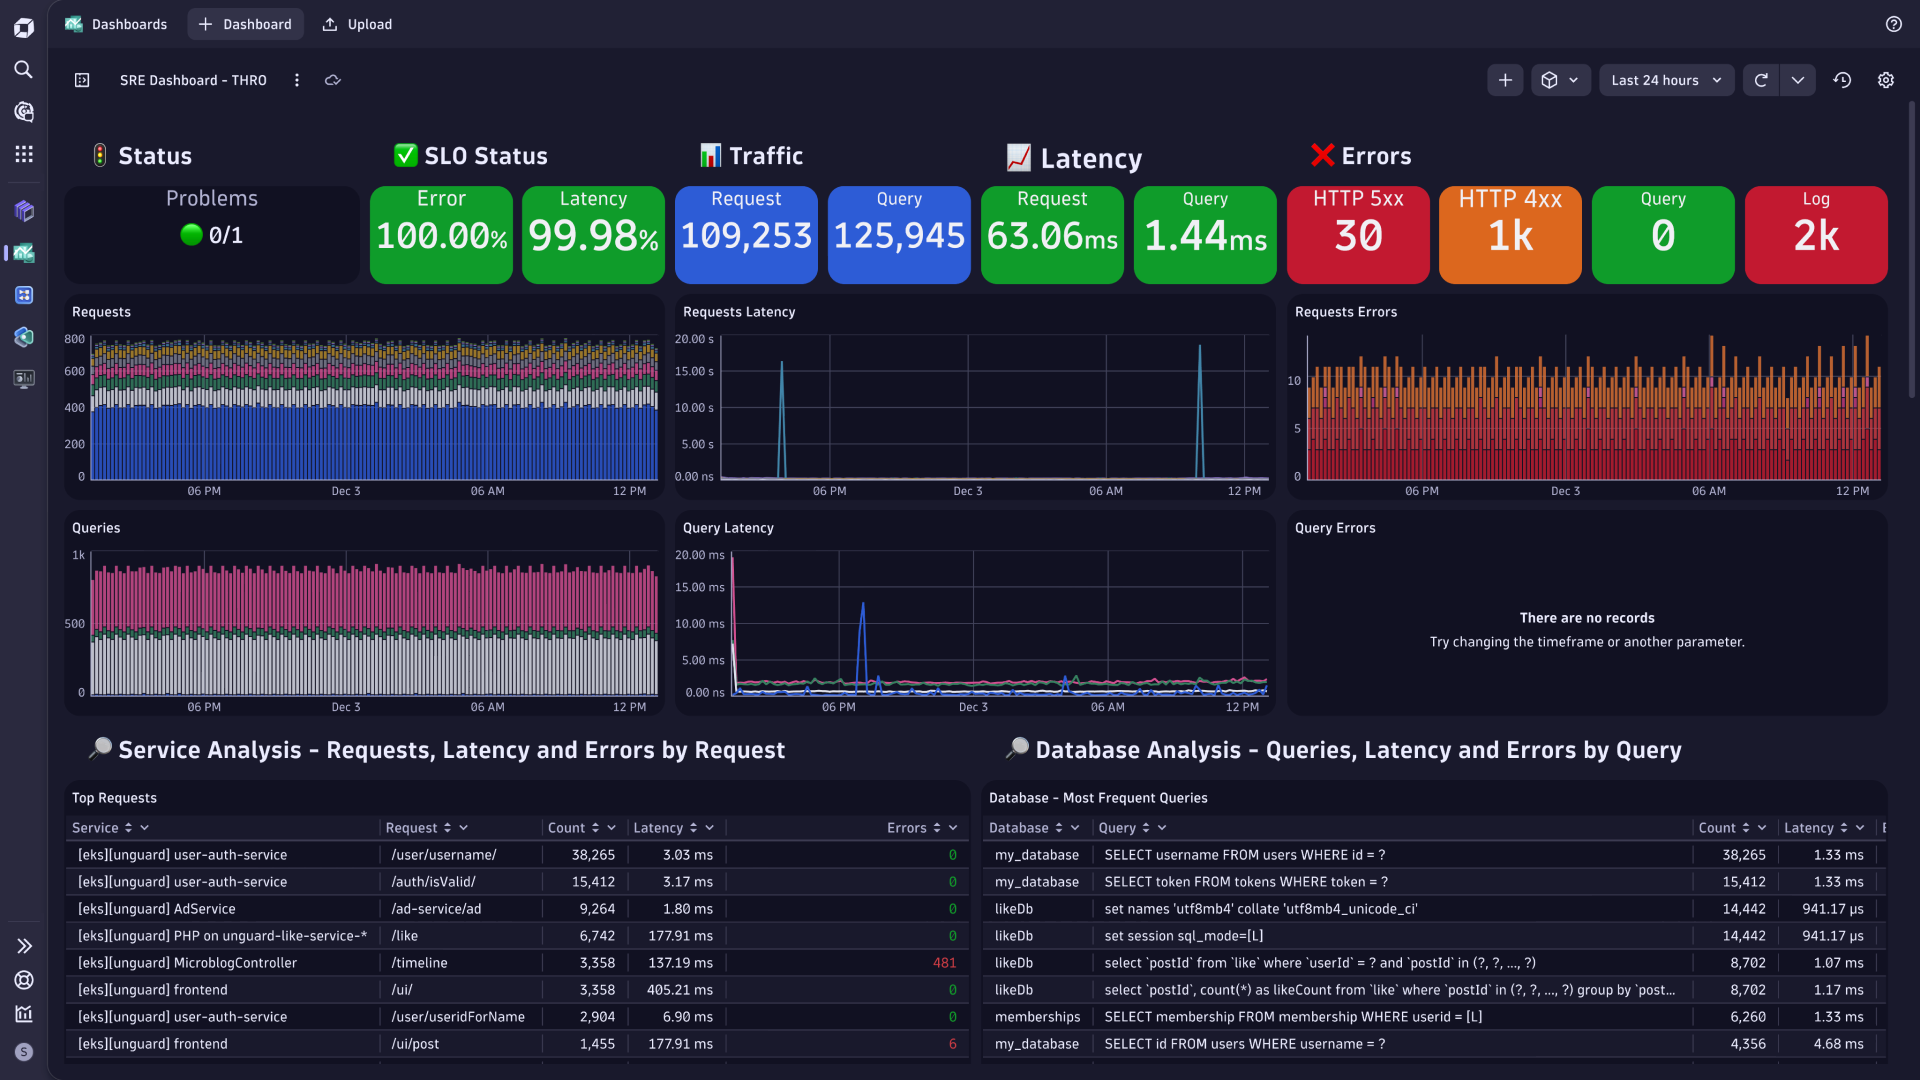
End-to-End Observability
Get a view of your entire system including traces, metrics, and logs for effective troubleshooting.
-
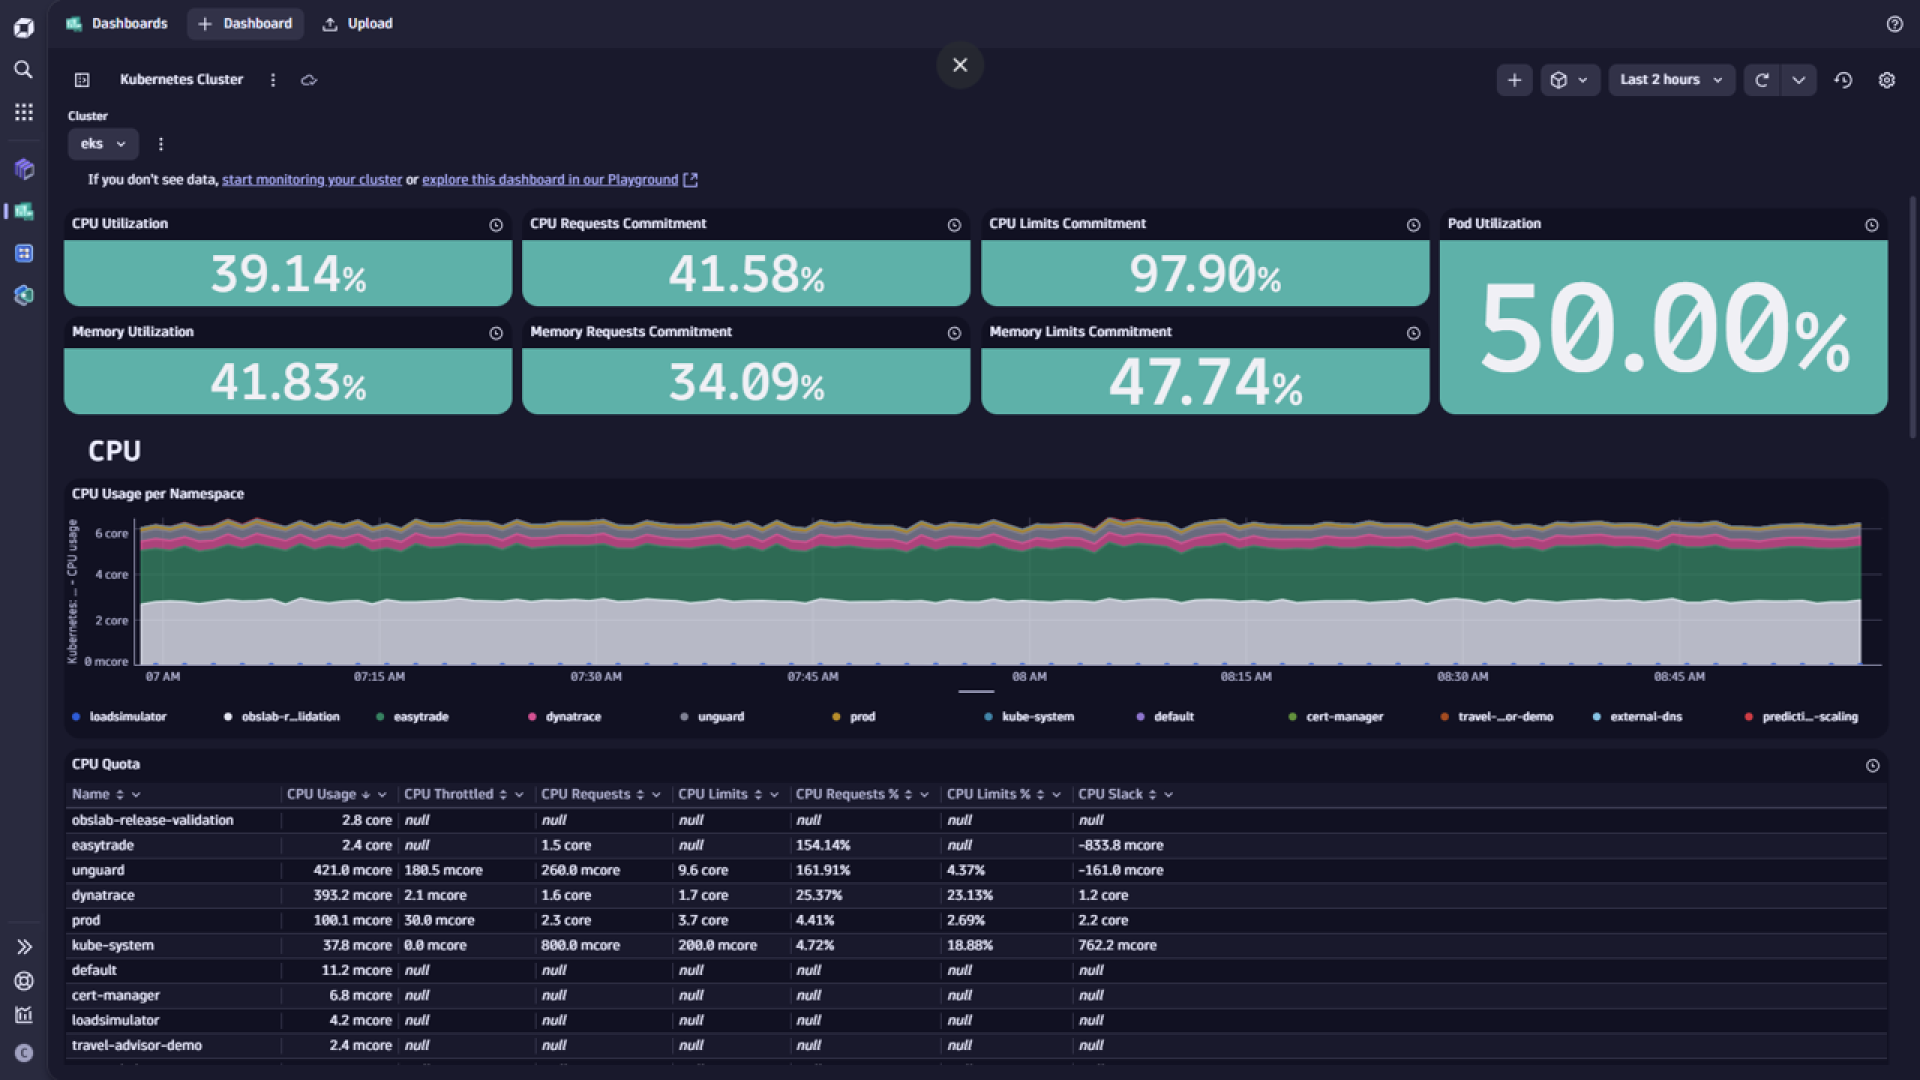
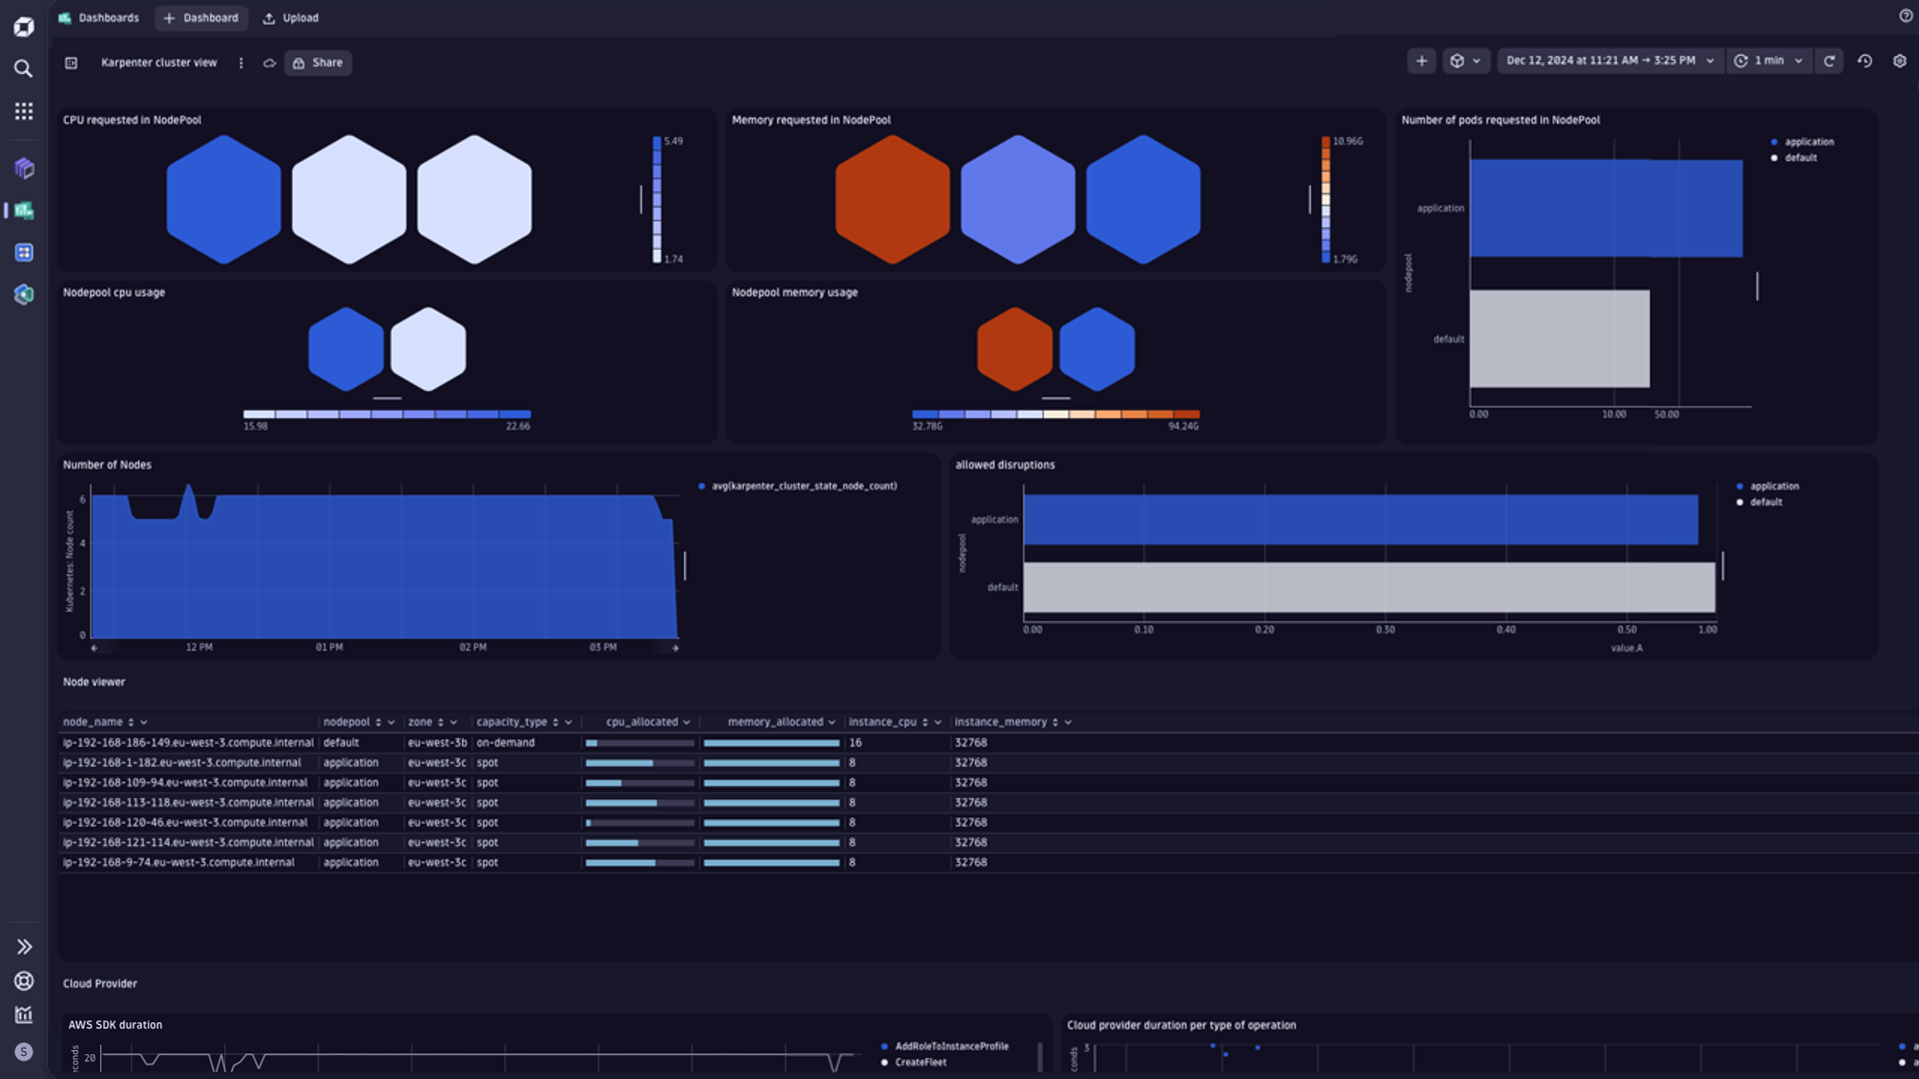
Kubernetes
Get visibility into your Kubernetes clusters, pods and workloads.
-
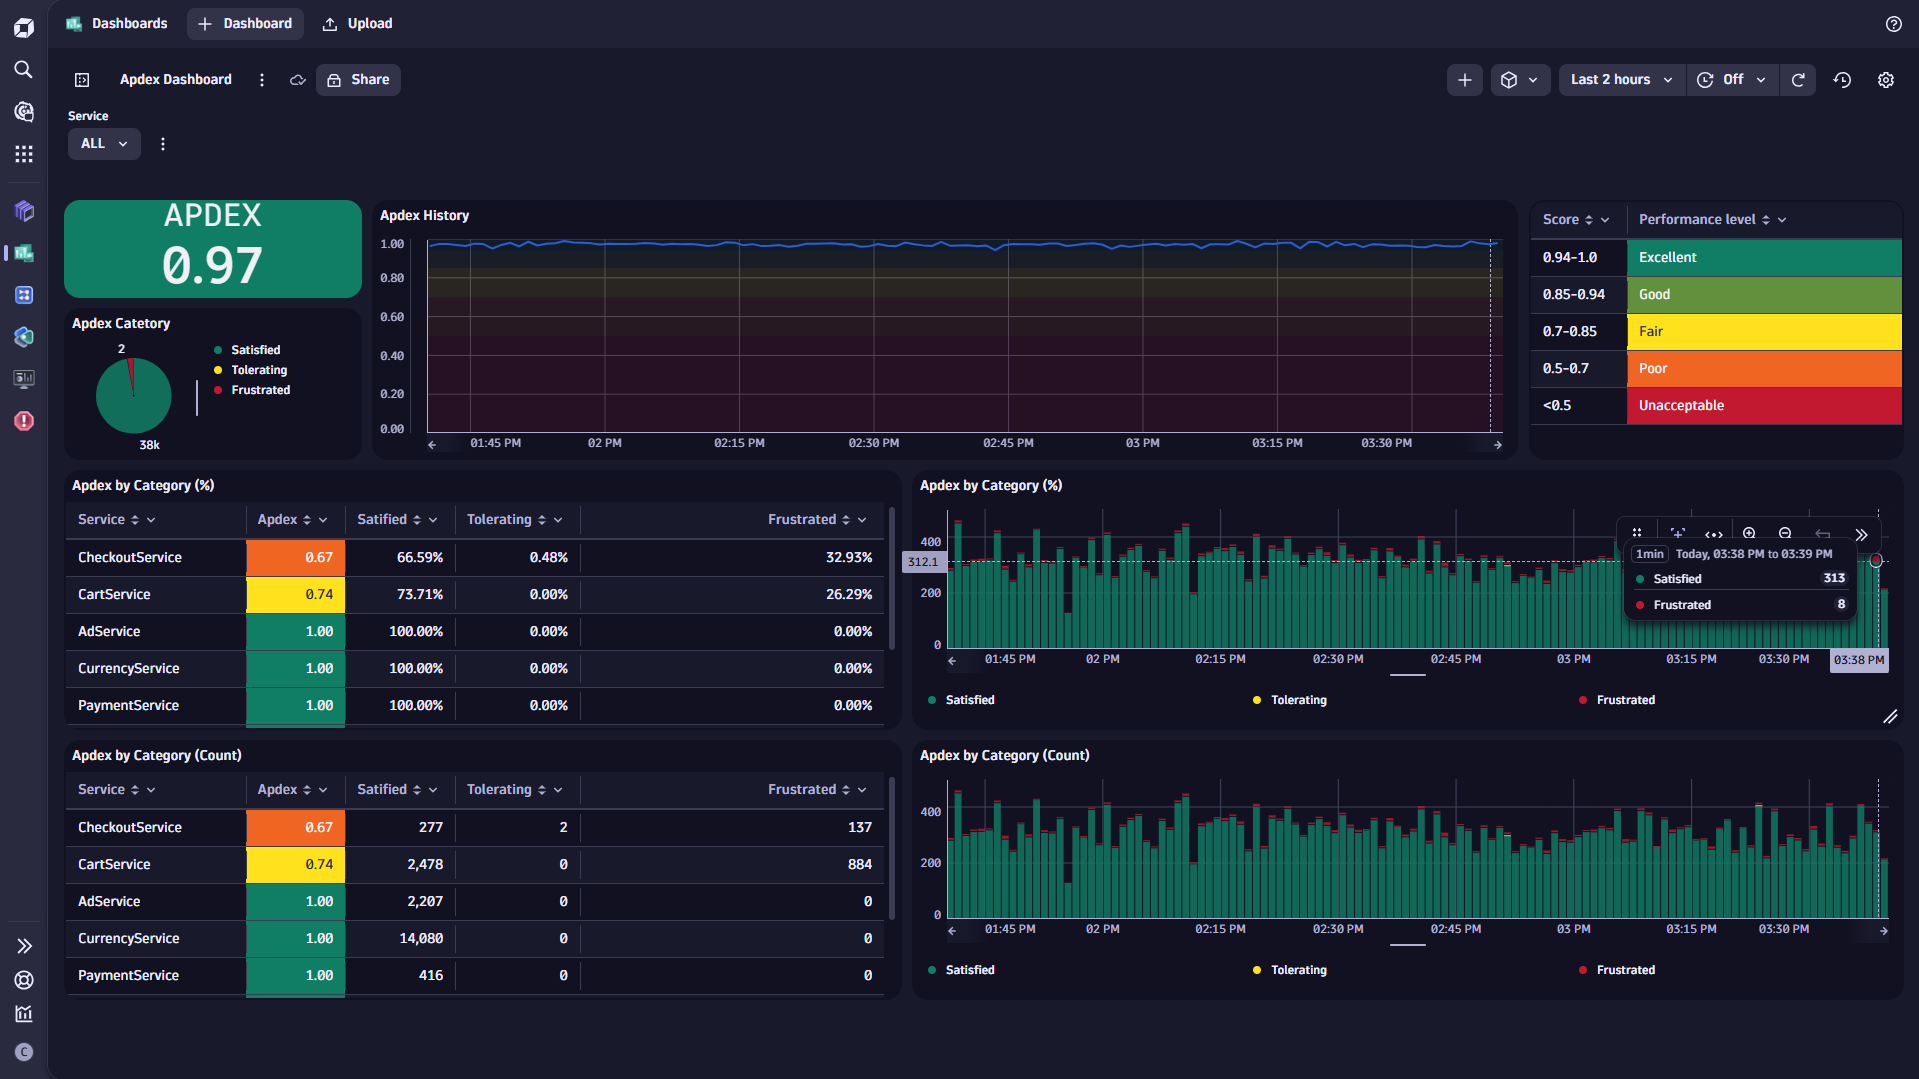
Application Performance
Check metrics, error rates, response times, and user interactions to monitor and optimize application performance.
-
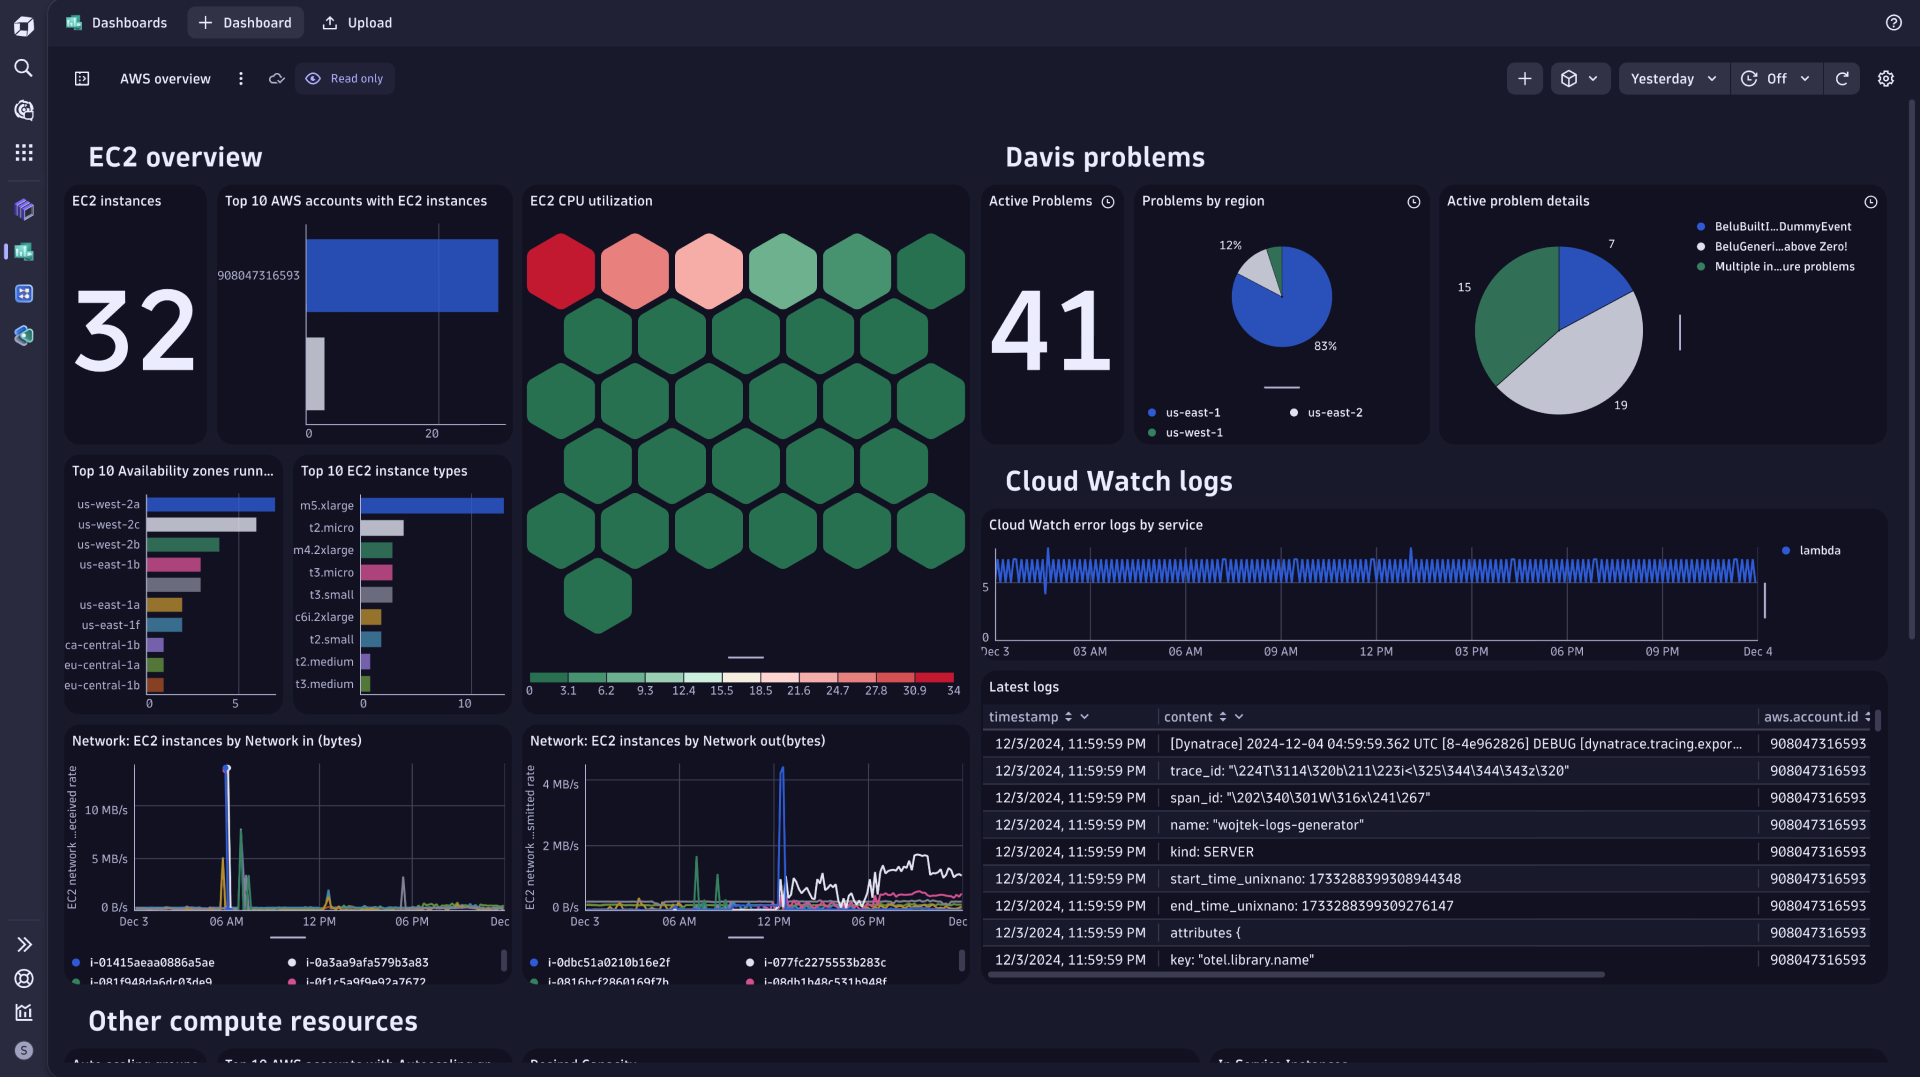
Infrastructure
Get insights into the health and performance of your on-premise, cloud or hybrid infrastructure.
-
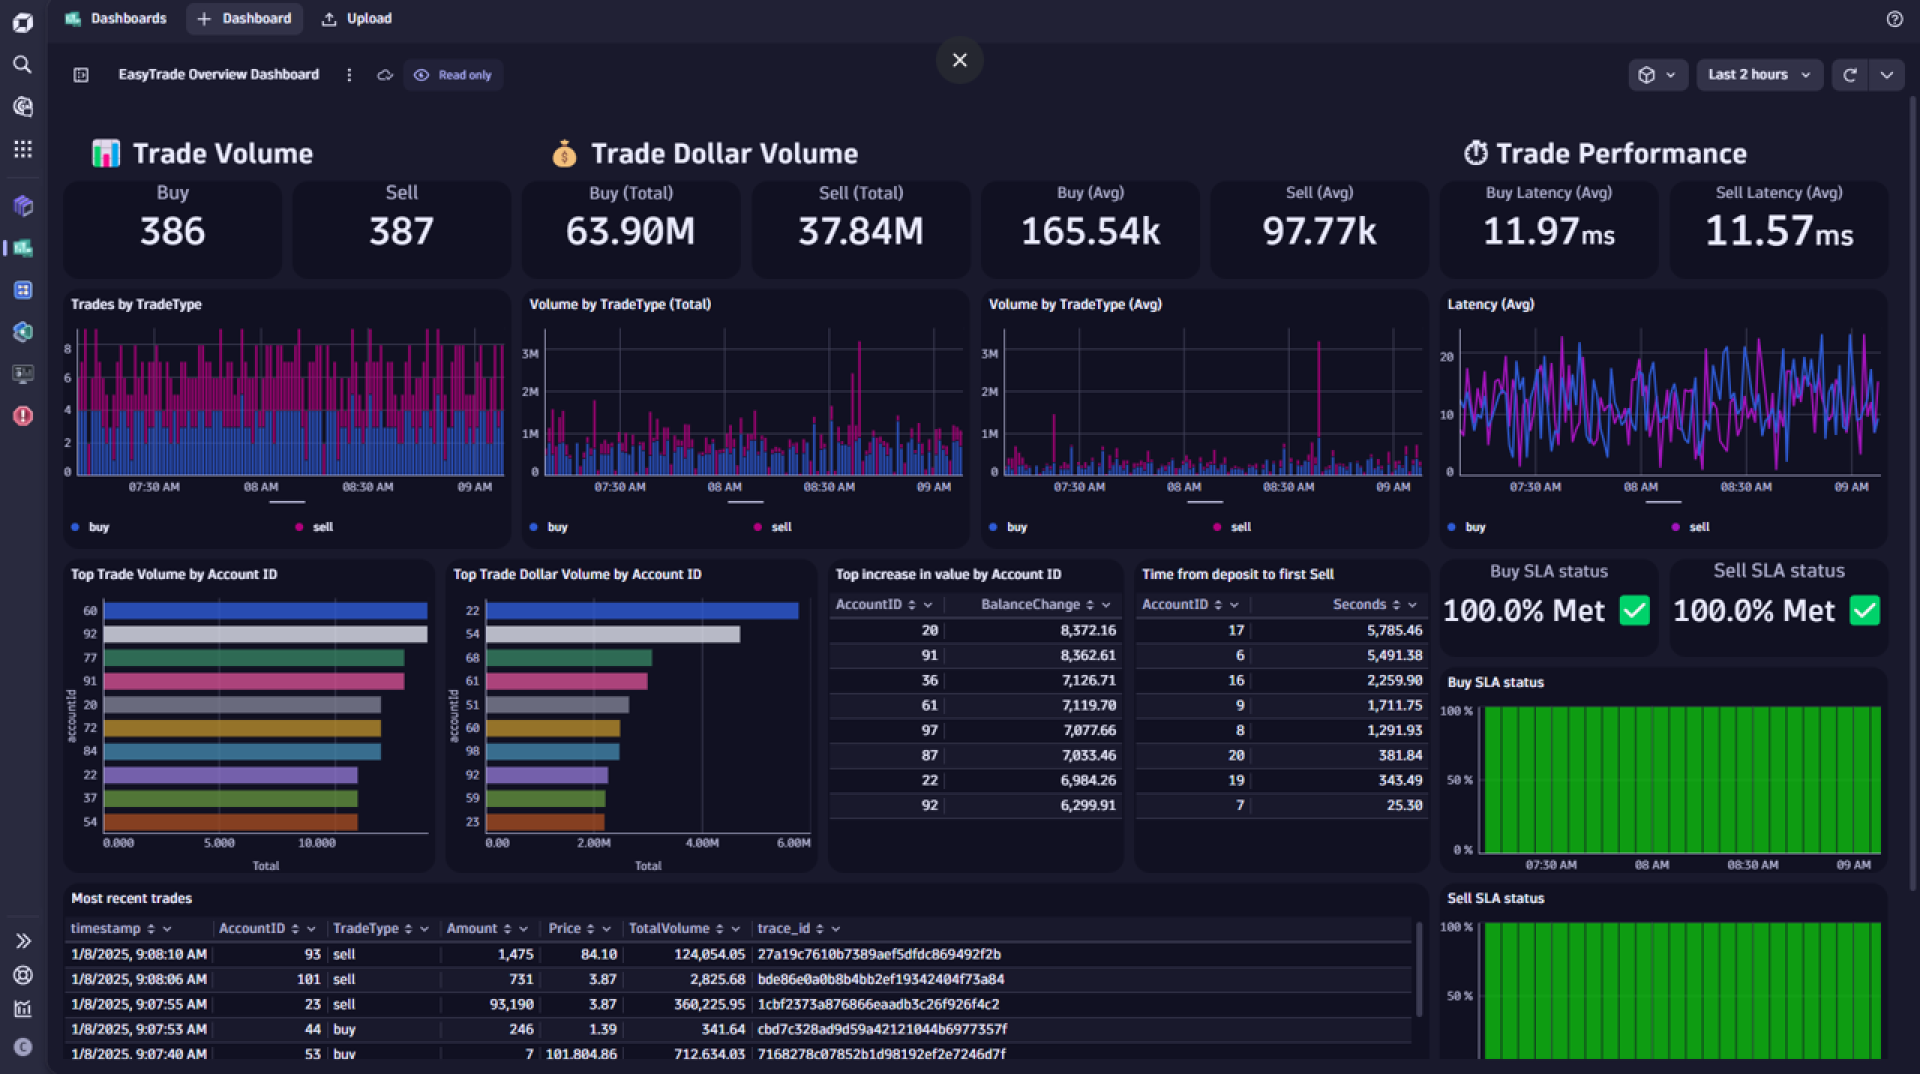
Business
Monitor KPIs and leverage optimization opportunities in your business processes.
-
Prometheus
Monitor and analyze your system performance utilizing Prometheus.
-
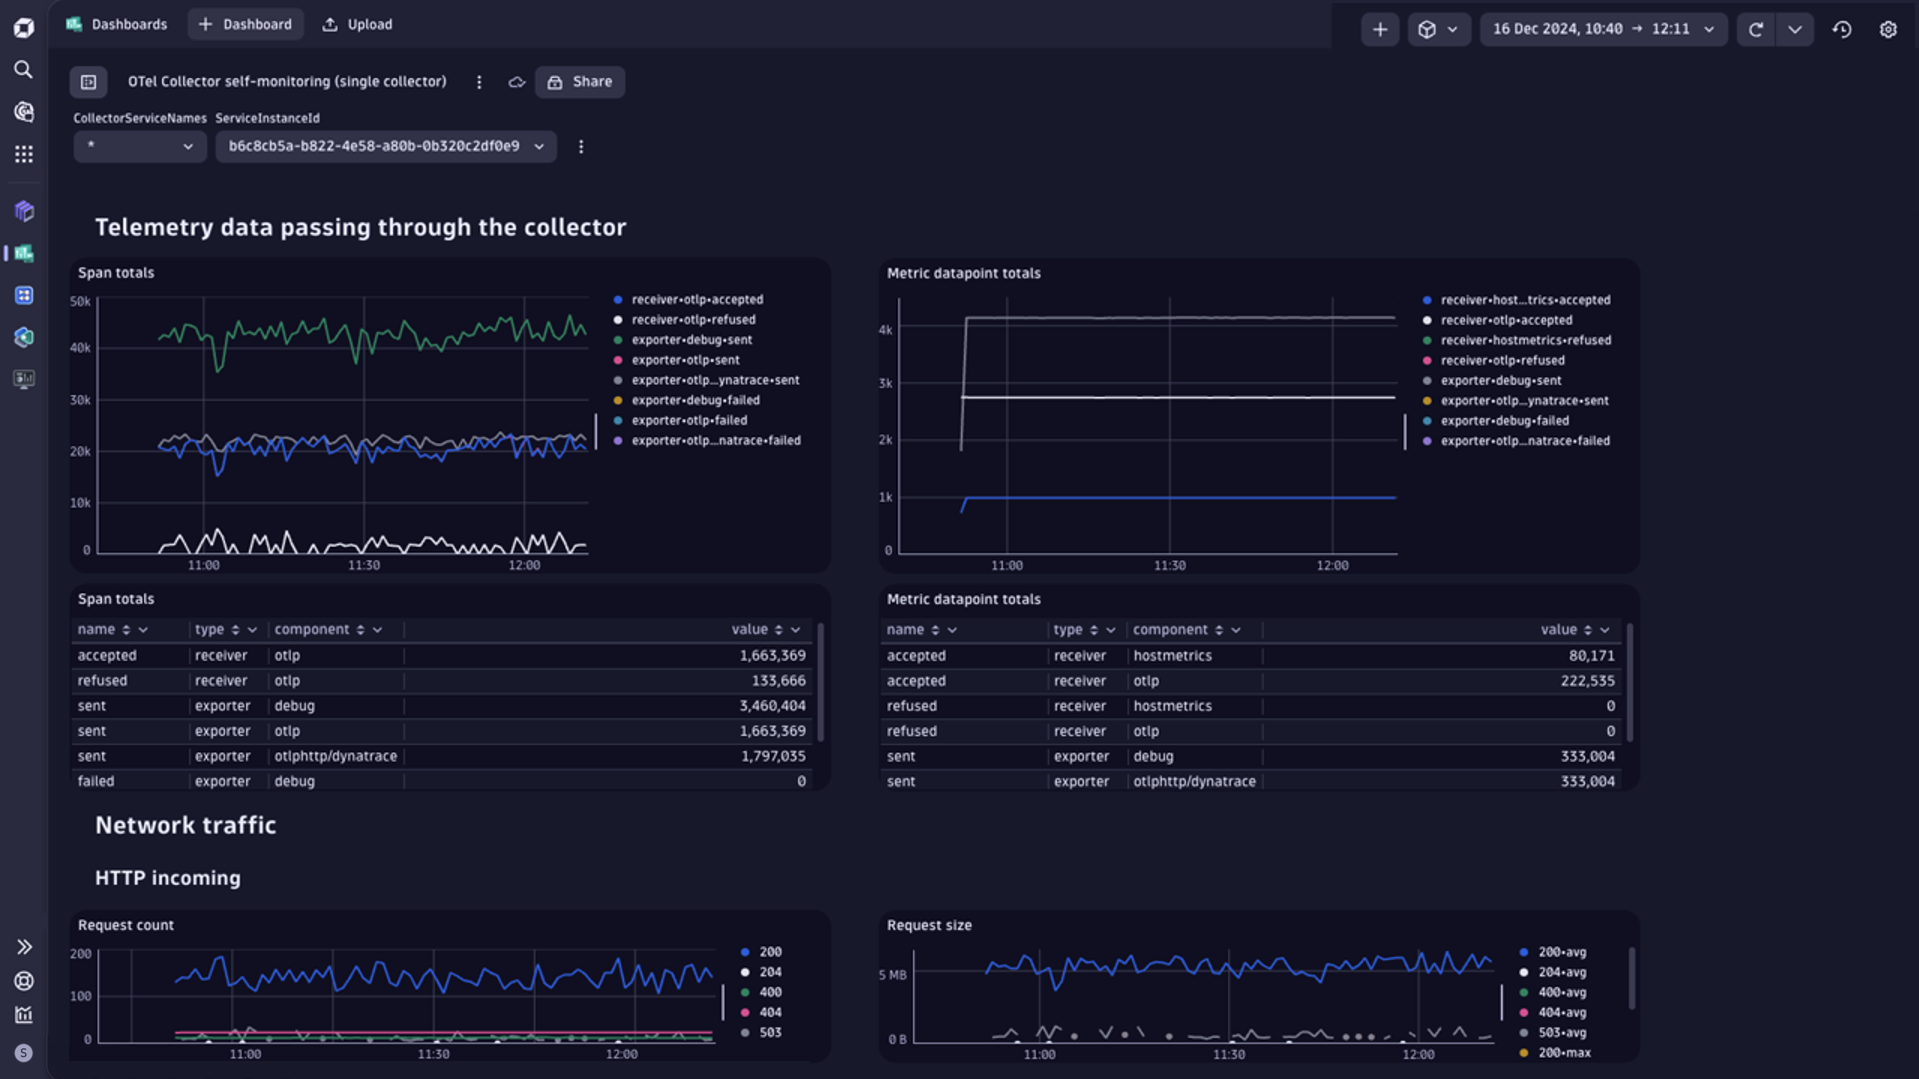
OpenTelemetry
Monitor and analyze your system performance utilizing OpenTelemetry.
-
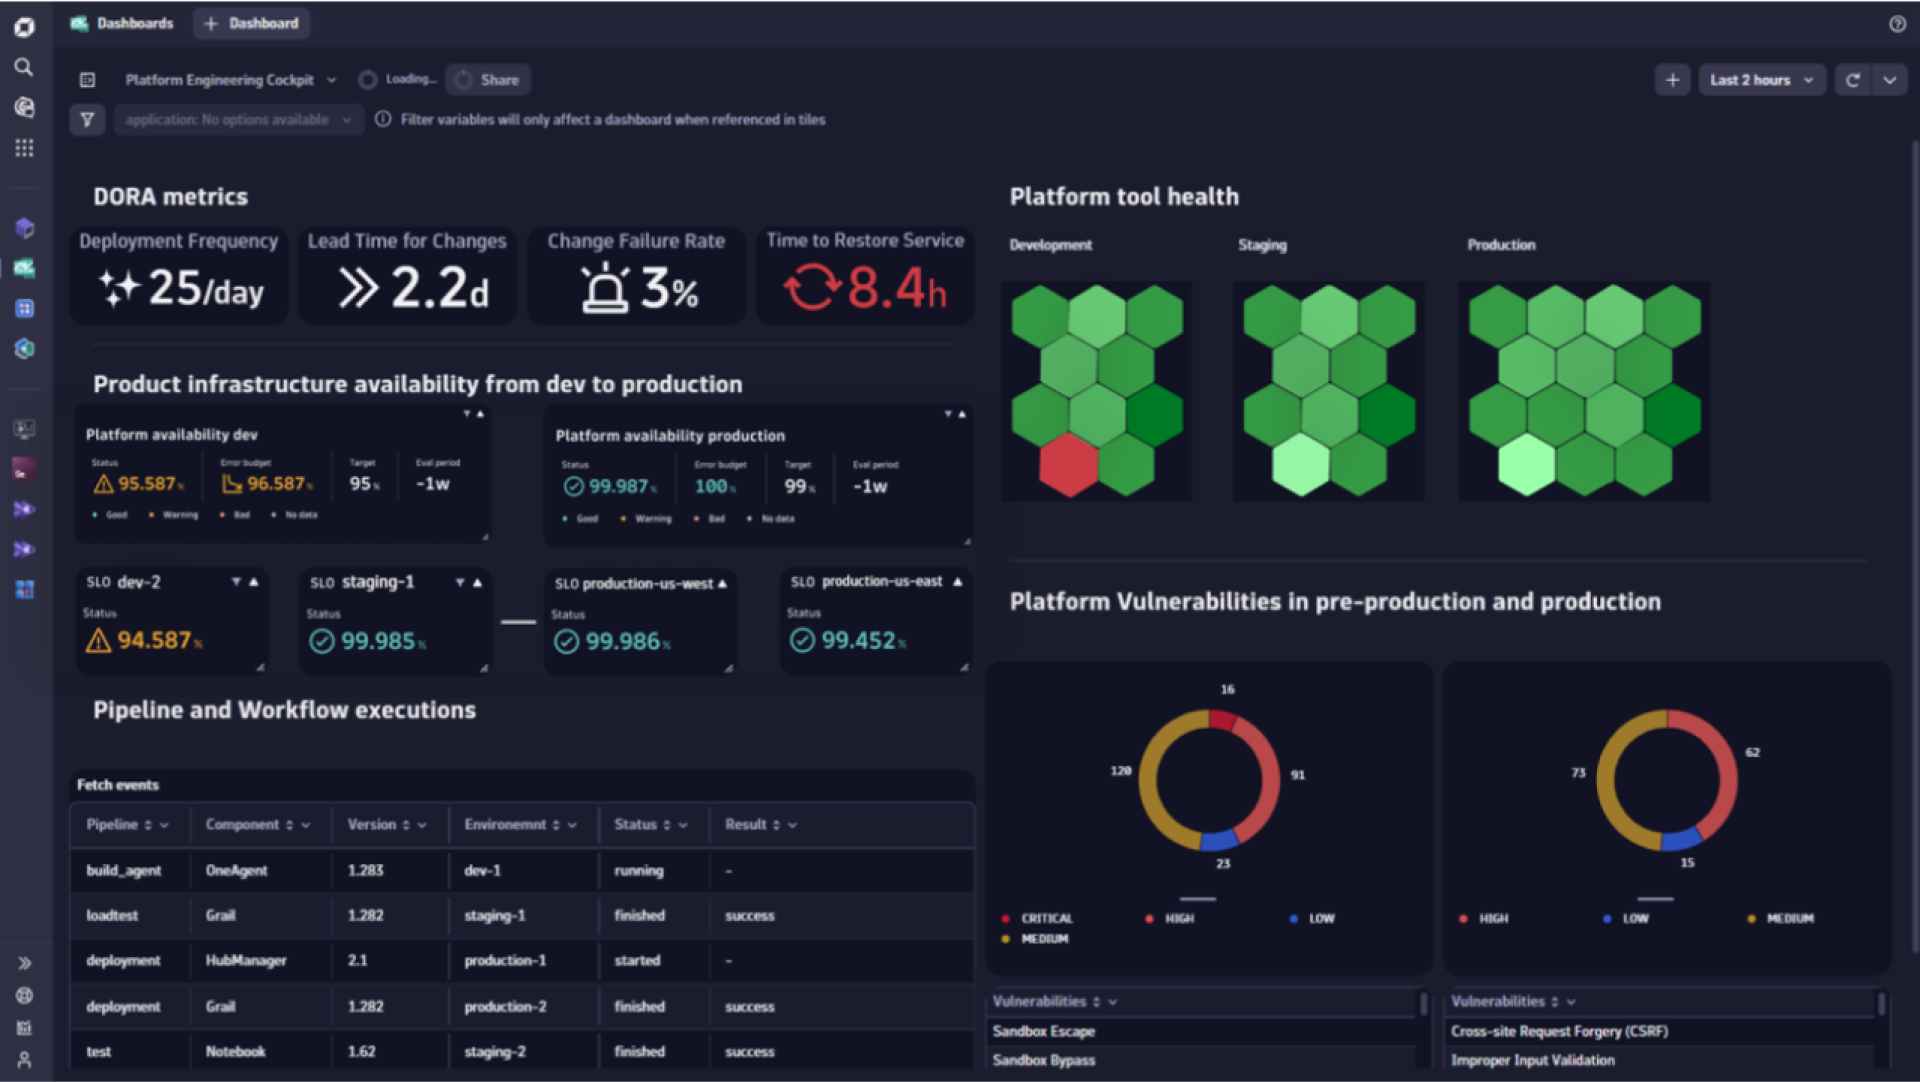
Software Delivery
Check DORA metrics, pipeline and workflow executions and platform tool health to improve your software delivery processes.
-
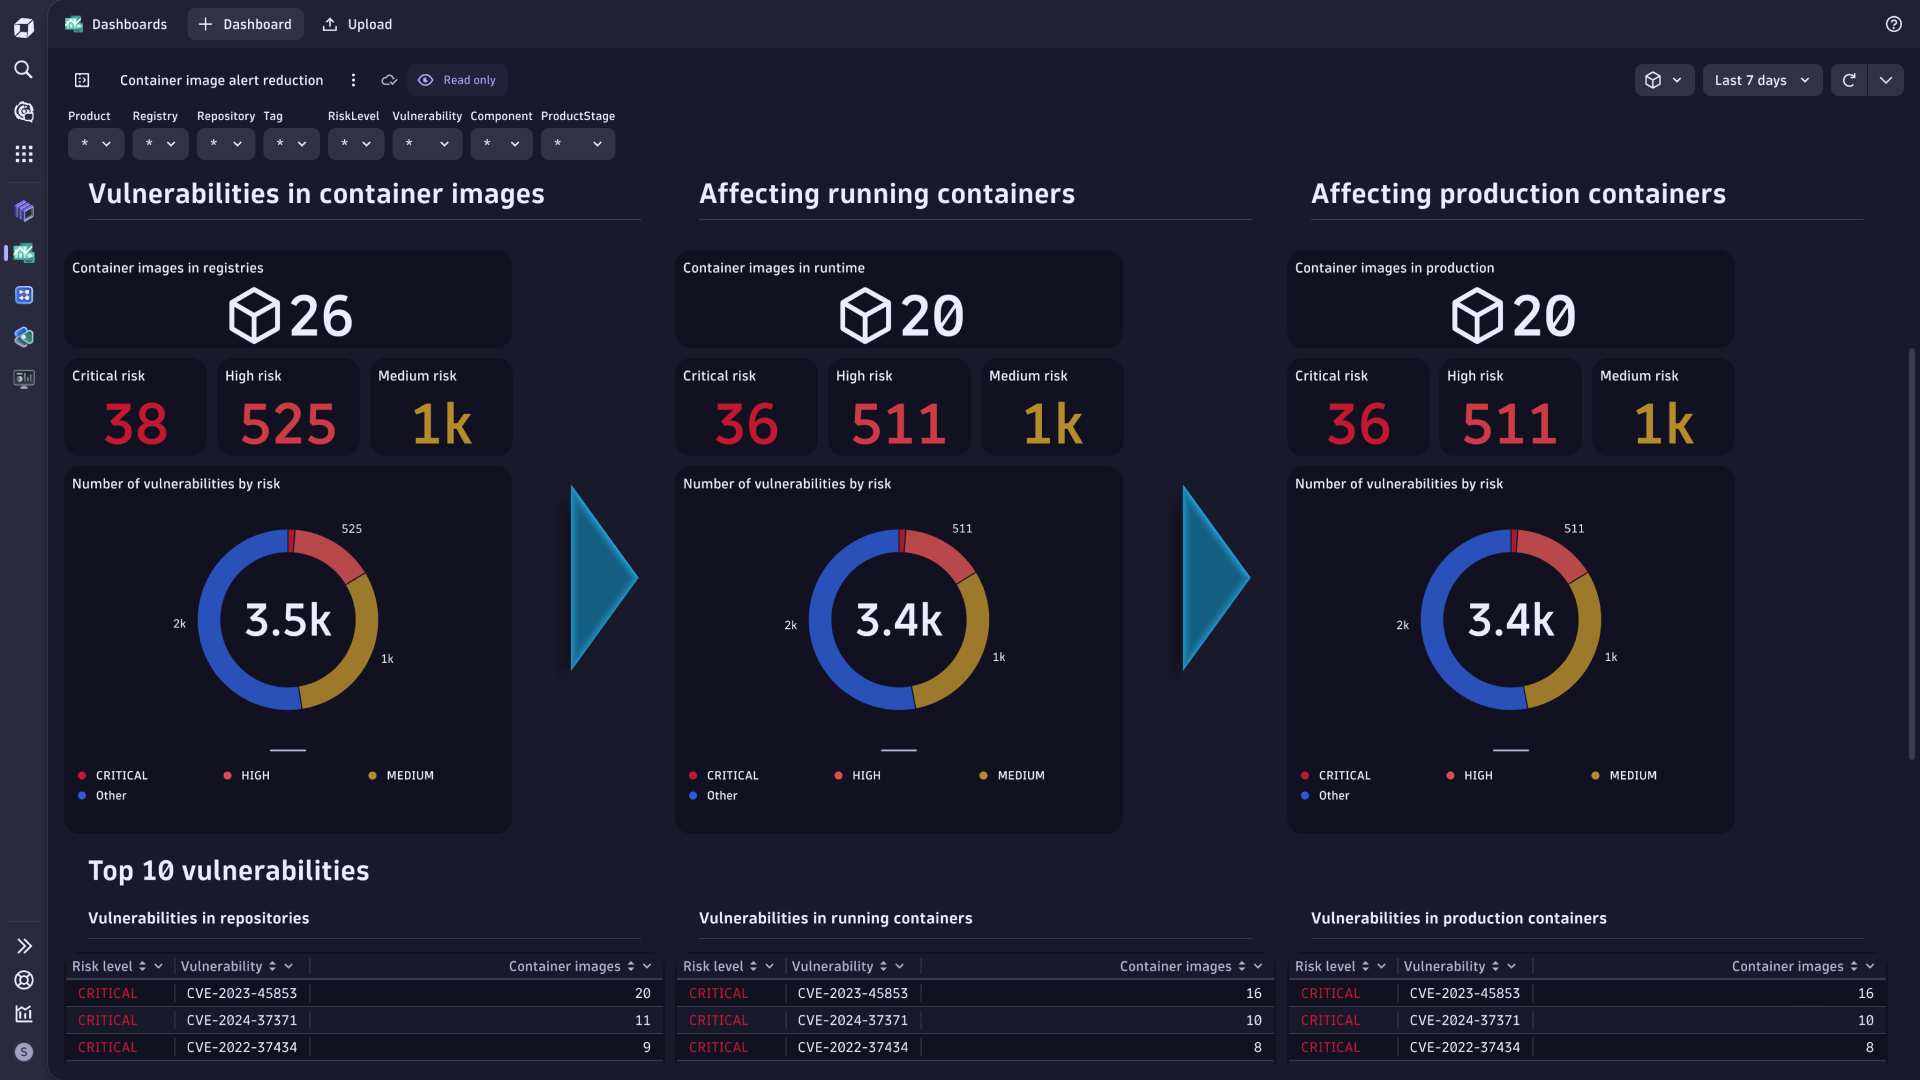
Application Security
Monitor and enhance the security posture of your applications.


Dynatrace custom dashboards helped us visualize data in real-time, monitor our infrastructure, applications, and kiosks, leading to more efficient operations and optimized performance. During critical periods like Black Friday, Dynatrace ensures stability and provides actionable insights, resulting in a flawless customer experience and significant business growth.


