
Dynatrace gives you out-of-the-box service-level insights into your Consul service mesh with all the benefits that Dynatrace is known for: the Davis AI causation engine and entity model, automatic topology detection in Smartscape, auto-baselining, automated error detection, and much more.
More and more applications are moving from being monoliths to microservice-based architectures. This is great for adopting agile practices but it adds networking complexity, especially when legacy components are involved. HashiCorp’s Consul is a popular service mesh that stands out for its ability to work with your traditional or legacy applications alongside Kubernetes workloads.
What is HashiCorp Consul
HashiCorp’s Consul is a multi-cloud service networking platform that connects and secures services across any runtime platform and public or private cloud. Consul agents can be deployed both inside and outside of Kubernetes in a way that allows you to connect your applications and Consul agents in Kubernetes to an existing external non-Kubernetes Consul cluster.
However, in order to enable Consul to solve such operational challenges effectively, you need to have visibility into its critical components.
Therefore, we’re delighted to announce that you can now quickly gain visibility into Consul and other technologies with minimal configuration and effort.
New ways to import telemetry data
Dynatrace recently simplified observability for all custom metrics—StatsD, Telegraf, and Prometheus metrics are just a few examples. HashiCorp’s Consul includes several ways to export metrics, and new additions to Dynatrace make it ready to serve as your telemetry backend out of the box. Not only is it easier than ever to get metrics into Dynatrace for conventional charting and alerting but you also get the benefit of having the Dynatrace Davis® AI analyze Consul performance.
How to get started
In the StatsD approach, we’ll be using the new capability of OneAgent to accept StatsD metrics on the localhost of your monitored hosts. Simply ensure that OneAgent is installed on a host and DynatraceStatsD is enabled. That’s all there is to do on the Dynatrace side! Now we just need to tell Consul where to send the StatsD metrics.
Configure Consul
Drop a new configuration file into the Consul agent configuration directory. Consul accepts fragments of configuration in separate files. This allows us to have a dedicated configuration file for sending telemetry to Dynatrace. This configuration snippet can either be in standard JSON format or in the HashiCorp Configuration Language (HCL). Add the following to a file in your Consul configuration directory (for example, dynatrace.json).
{
    "telemetry": {
        "disable_hostname": true,
        "statsd_address": "127.0.0.1:18125",
        "filter_default": false,
        "prefix_filter": [
          "+consul.autopilot",
          "+consul.client.rpc",
          "+consul.kvs.apply",
          "+consul.raft.apply",
          "+consul.raft.commitTime",
          "+consul.raft.state.candidate",
          "+consul.raft.state.leader",
          "+consul.rpc.request",
          "+consul.rpc.request_error",
          "+consul.txn.apply",
          "+consul.grpc.client.connections",
          "+consul.grpc.server.connections",
          "+consul.serf.member",
          "+consul.serf.msgs",
          "+consul.memberlist.msg.dead",
          "+consul.memberlist.tcp.connect",
          "+consul.memberlist.tcp.sent",
          "+consul.memberlist.tcp.accept",
          "+consul.memberlist.udp"
        ]
    }
}
The first setting tells StatsD not to prefix each metric with the hostname that generated it (Dynatrace will make this available by default). Next, we point Consul to the localhost address that Dynatrace StatsD is listening on. There are a lot of metrics available in Consul, and we don’t want to send all of them. Instead, we set filter_default to false so that the default behavior is not to send a given metric. Then we can use the array of prefix filters to enable the ones we do want to use.
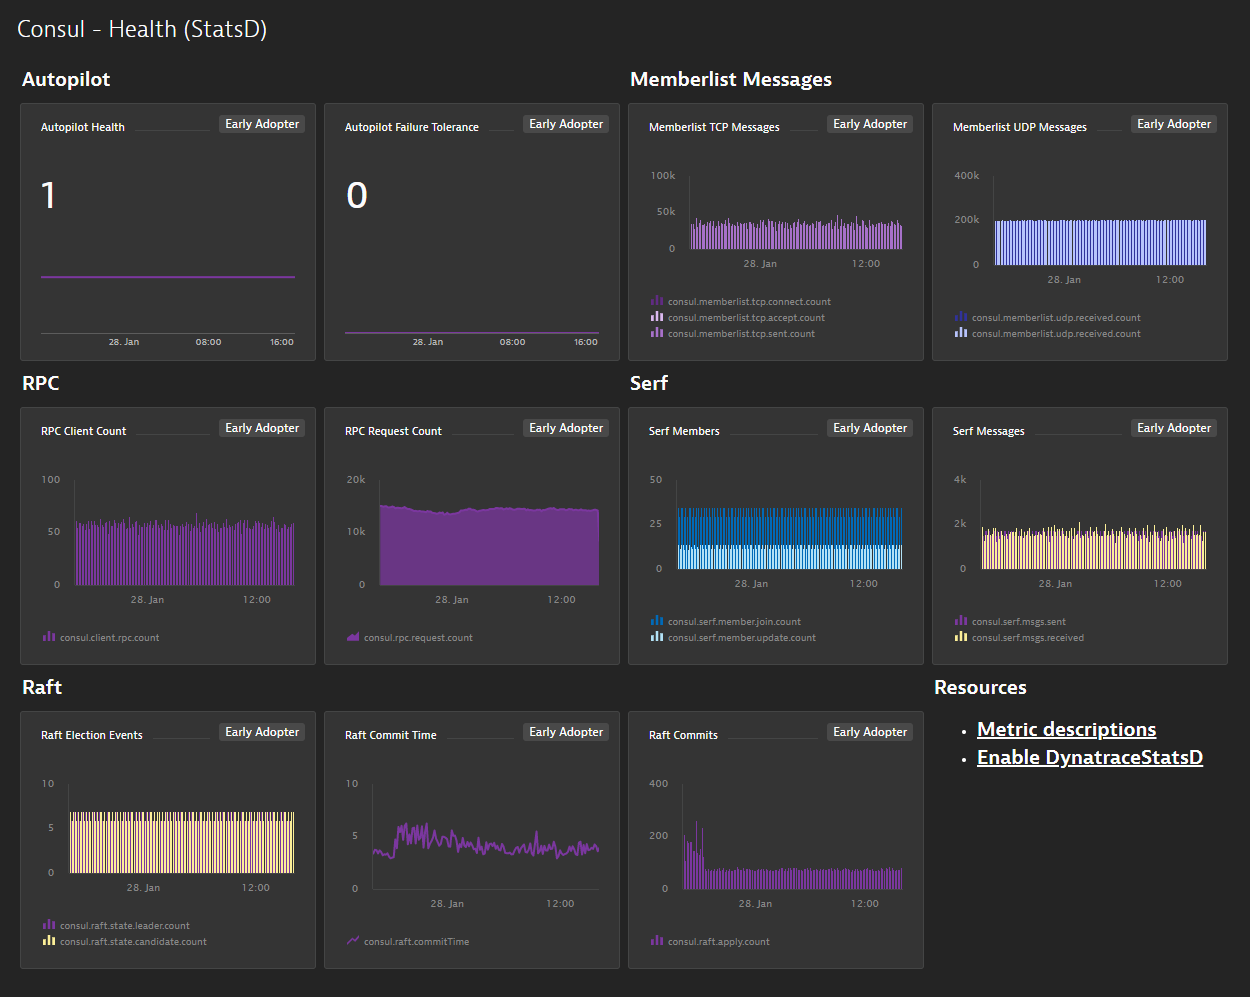
Feel free to modify this snippet as needed to add or remove metrics based on your needs. These metrics will be used to populate some dashboards and alerts that we’ll look at next. You’ll need to restart your Consul agents for this new configuration to take effect.
Visualize metrics and pin them to your dashboard
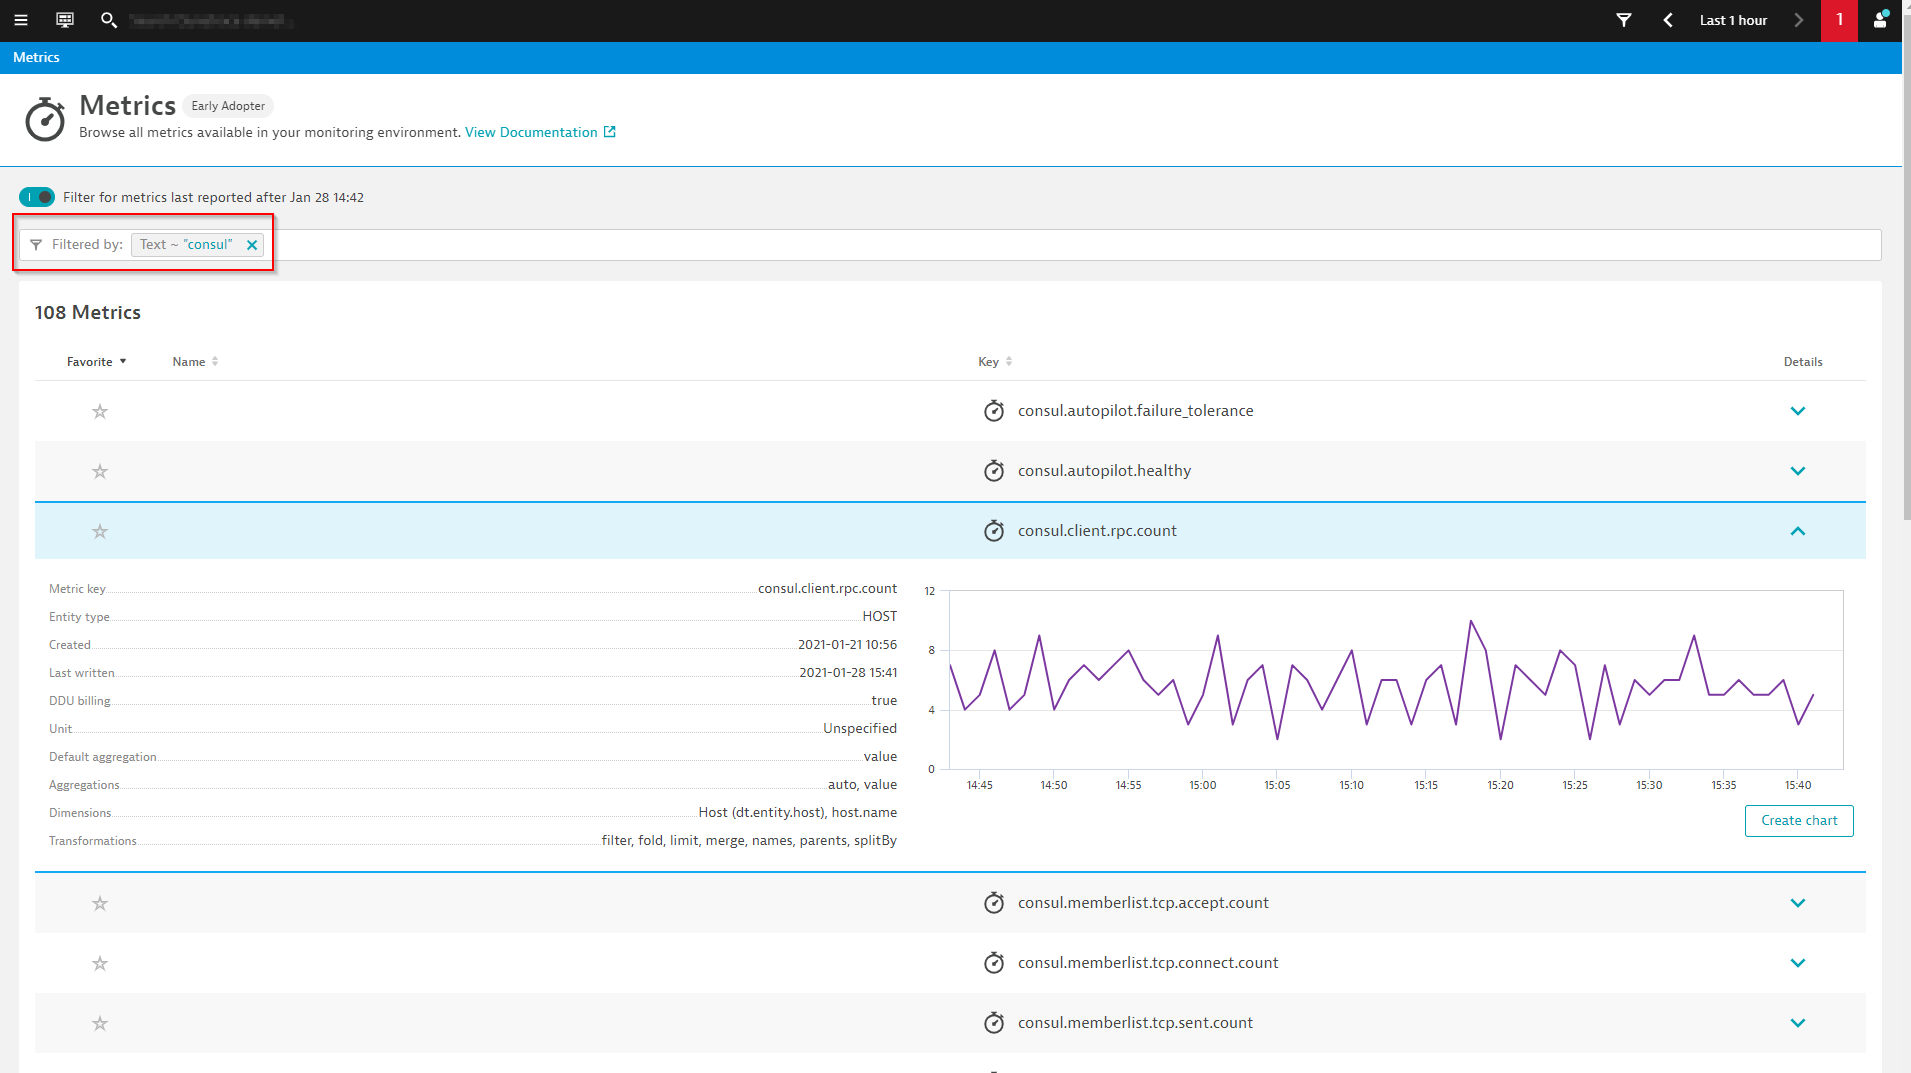
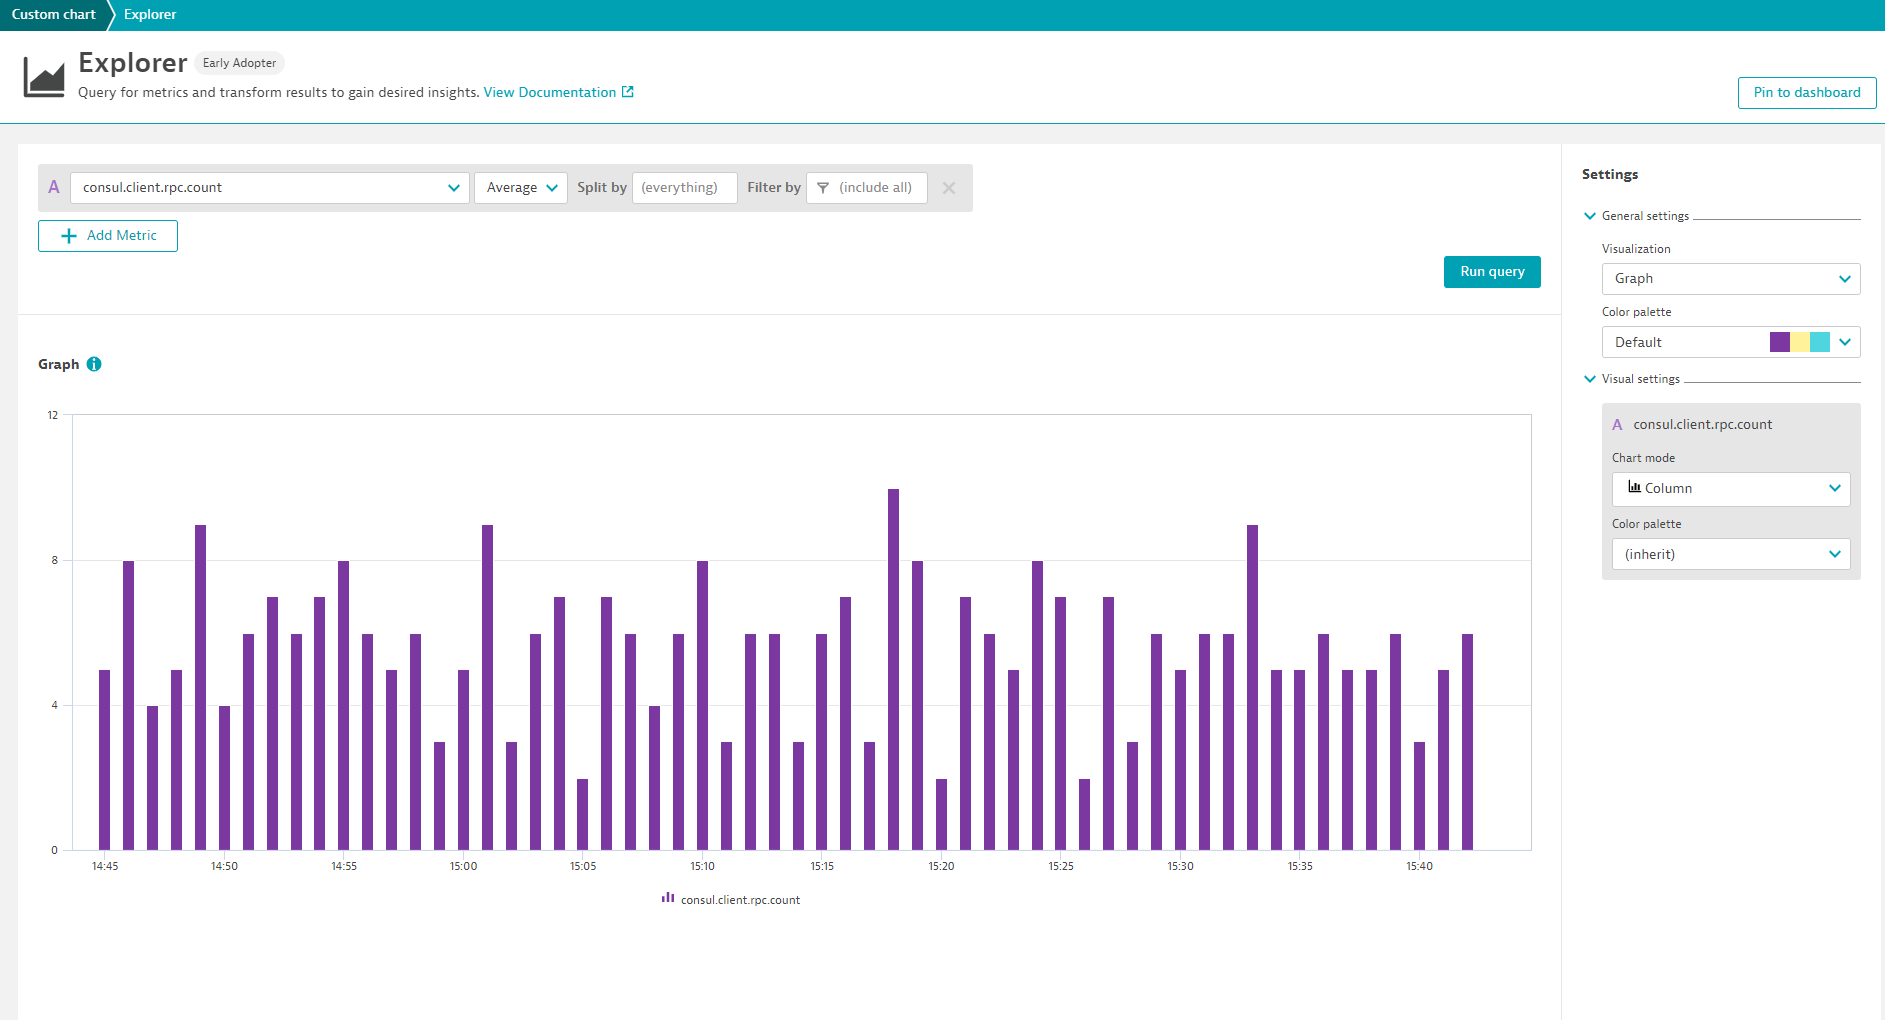
Once you’ve restarted Consul, give it a few minutes and you should start to see the metrics you enabled showing up in Dynatrace. Navigate to the Metric browser (to access, select Metrics from the navigation menu) and add a Text filter for consul to see the new metrics. You can then use the Data Explorer to create visualizations that can be pinned to dashboards.
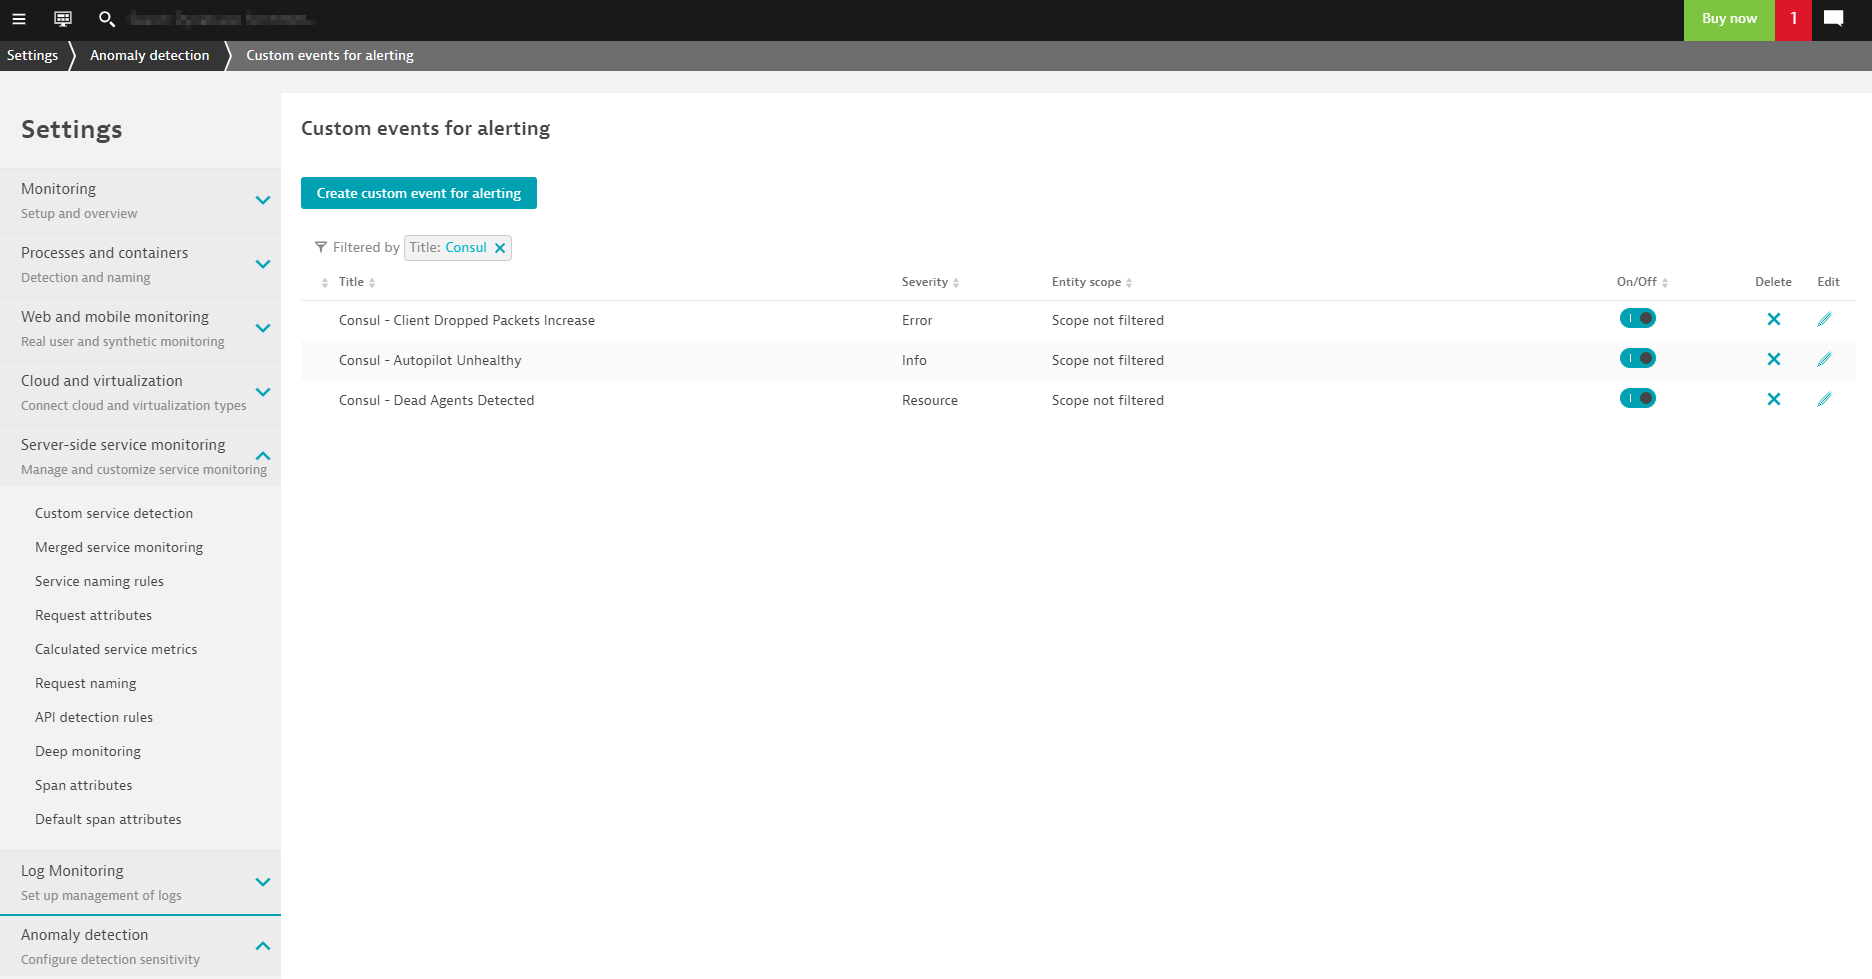
Leverage auto-baselining for Consul StatsD metrics
With these new metrics, you can define your own custom events for alerting. In some cases, you might want to set static thresholds but you can still take advantage of auto-adaptive baselining so you don’t have to spend time guessing which static thresholds make sense.
What’s next?
You have complete control over your dashboards and alerts, but for common technologies like Consul, it makes sense to have prebuilt configurations available. Soon you’ll be able to enable prebuilt dashboards and alerts with only a few clicks by activating a Consul extension from the Dynatrace Hub!
Monitoring the external (non-Kubernetes) Consul clients works best when you’re running a more traditional Consul cluster outside of Kubernetes where it’s as simple as having OneAgent deployed on the cluster nodes. It’s also possible to deploy a Consul cluster inside of Kubernetes. Keep an eye out for an update on how Dynatrace will monitor Consul in such a scenario. If you have feedback on any of the new features we’ve described here, please share your thoughts and ideas with us at Dynatrace Community.
New to Dynatrace?
Try it out by starting your free trial today.


Looking for answers?
Start a new discussion or ask for help in our Q&A forum.
Go to forum