
Java Memory Leaks
Chapter: Memory Management

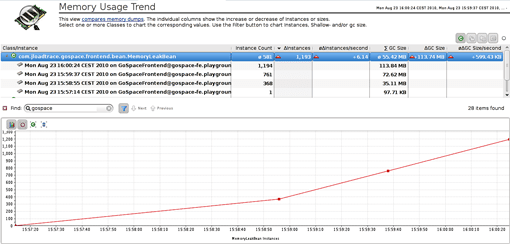
We're all familiar with the ever-growing memory leak, the sort where excess objects accumulate until all available memory is filled. This sort of problem is easy to track down with simple trending or histogram dumps. Figure 2.24 shows an example of the Dynatrace trending-dump facility, but you can achieve similar results manually by using jmap -histo multiple times and then comparing the results. If your results show ever-growing instance numbers, you've found your leak.
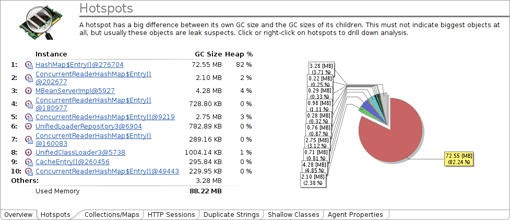
On the other hand, a non-growing or slow-growing memory leak is easily overlooked because it can seem so minor as to be unimportant. However, when such a leak is triggered by a single large object structure, the missing memory can pose a significant threat to the stability of the application. By using a modern heap-analyzer tool, we can track down this type of leak fairly quickly as is visualized in figure 2.25 (see the Analyzing Performance Impact section earlier in this chapter).
It's also possible to have many small, unrelated memory leaks in a single application. This situation is rarely seen, because it can be caused only by some seriously bad programming work. It's as if the leaking objects were rats leaving a sinking ship. But let's not worry too much about such unlikely occurrences, and instead let's concentrate on the most common causes for memory leaks.
Mutable Static Fields and Collections
Static fields are de facto GC roots (see the How Java Garbage Collection Works section earlier in this chapter), which means they are never garbage-collected! For convenience alone, static fields and collections are often used to hold caches or share state across threads. Mutable static fields need to be cleaned up explicitly. If the developer does not consider every possibility (a near certainty), the cleanup will not take place, resulting in a memory leak. This sort of careless programming means that static fields and collections have become the most common cause of memory leaks!
In short, never use mutable static fields—use only constants. If you think you need mutable static fields, think about it again, and then again! There's always a more appropriate technique.
Java Memory Leaks

Thread-Local Variables
A thread-local variable is basically a member field in the Thread class. In a multithreaded application, every thread instance has its own instance of such a variable. Therefore it can be very useful to bind a state to a thread. But this can be dangerous because thread-local variables will not be removed by the garbage collector as long as the thread itself is alive. As threads are often pooled and thus kept alive virtually forever, the object might never be removed by the garbage collector!
Since an active thread must be considered a GC root, a thread-local variable is very similar to a static variable. The developer, more specifically his code, needs to explicitly clean it up, which goes against the idea of a garbage collector. Just like a mutable static variable, it should be avoided unless there are very few good reasons to use it.
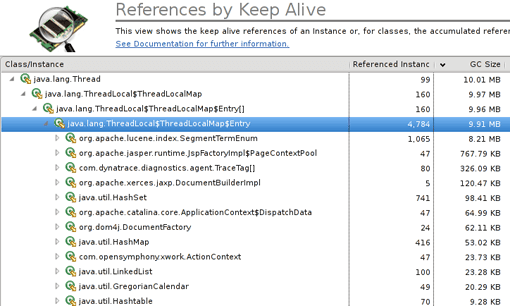
These kinds of memory leaks can be discovered with a heap dump. Just take a look at the ThreadLocalMap in the heap dump and follow the references (see Figure 2.26). Also, look at the name of the thread to figure out which part of your application is responsible for the leak.
Circular and Complex Bi-Directional References
Memory leaks due to overly complex and circular object structures are my personal favorites, because it's as if they've got their own personalities. The developer seems to be trying to trick the garbage collector so that it can't do its job correctly.
Let me explain this particular problem by example:
 org.w3c.dom.Document doc = readXmlDocument();
 org.w3c.dom.Node child = doc.getDocumentElement().getFirstChild();
 doc.removeNode(child);
 doc = null;
The first code line reads an XML document from somewhere. The subsequent code, however, does not need the whole document, but rather just a specific portion (e.g. just the first child element). I know that the document holds a reference to the child document, so I remove it (removeNode) to allow the garbage collector to do its work. At the end of the code snippet one might think the DOM document will be garbage-collected; this is not the case!
A DOM Node object always belongs to a DOM Document. Even when removed from the document the node object retains a reference to its owning document. As long as we keep that child object, neither the document nor any of the nodes it refers to will be removed.
I've seen this and similar cases quite often, and they are rather hard to track down. If you do not know the code in question by heart (which allows you to see the problem just by reading the code), you need to do a heap analysis and figure out why the document object has not been garbage-collected.
JNI Memory Leaks
Java Native Interface (JNI) memory leaks are particularly nasty and hard to find. JNI is used to call native code from Java. This native code can handle, call, and also create Java objects. Every Java object created in a native method begins its life as a local reference, which means that the object is referenced until the native method returns. We could say the native method references the Java object, so you won't have a problem unless the native method runs forever. In some cases you want to keep the created object even after the native call has ended. To achieve this, you can either ensure that it is referenced by some other Java object or you can change the local reference into a global reference. A global reference is a GC root and will never be removed until it is explicitly freed by the native code (see Figure 2.27).
The only way to discover JNI memory leaks is to use a heap-dump tool that explicitly marks native references. If possible, avoid using any global references. It's better to assign the desired object to the field of a normal Java class.
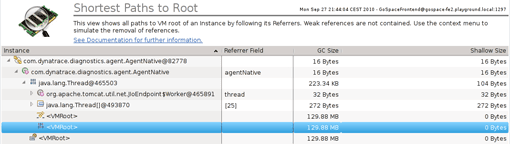
Table of Contents
Application Performance Concepts
Memory Management
How Java Garbage Collection Works
The Impact of Garbage Collection on application performance
Reducing Garbage Collection Pause time
Making Garbage Collection faster
Not all JVMS are created equal
Analyzing the Performance impact of Memory Utilization and Garbage Collection
The different kinds of Java memory leaks and how to analyze them
High Memory utilization and their root causes
Classloader-releated Memory Issues
Performance Engineering
Virtualization and Cloud Performance
Try it free
