
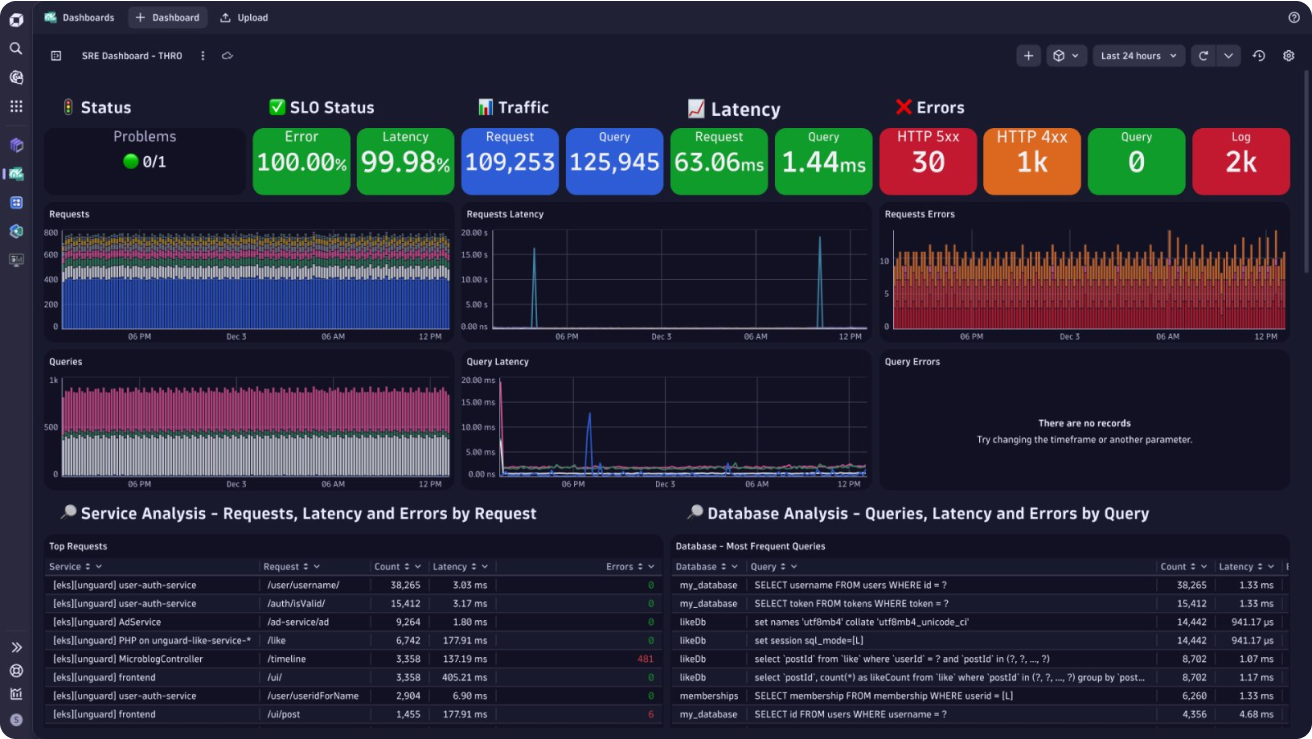
End-to-end distributed tracing at scale
Get unprecedented visibility into distributed systems by capturing and analyzing distributed tracing data, from cloud native to on-premise workloads.

Transform trace data into powerful insights
Optimize application performance with full stack visibility
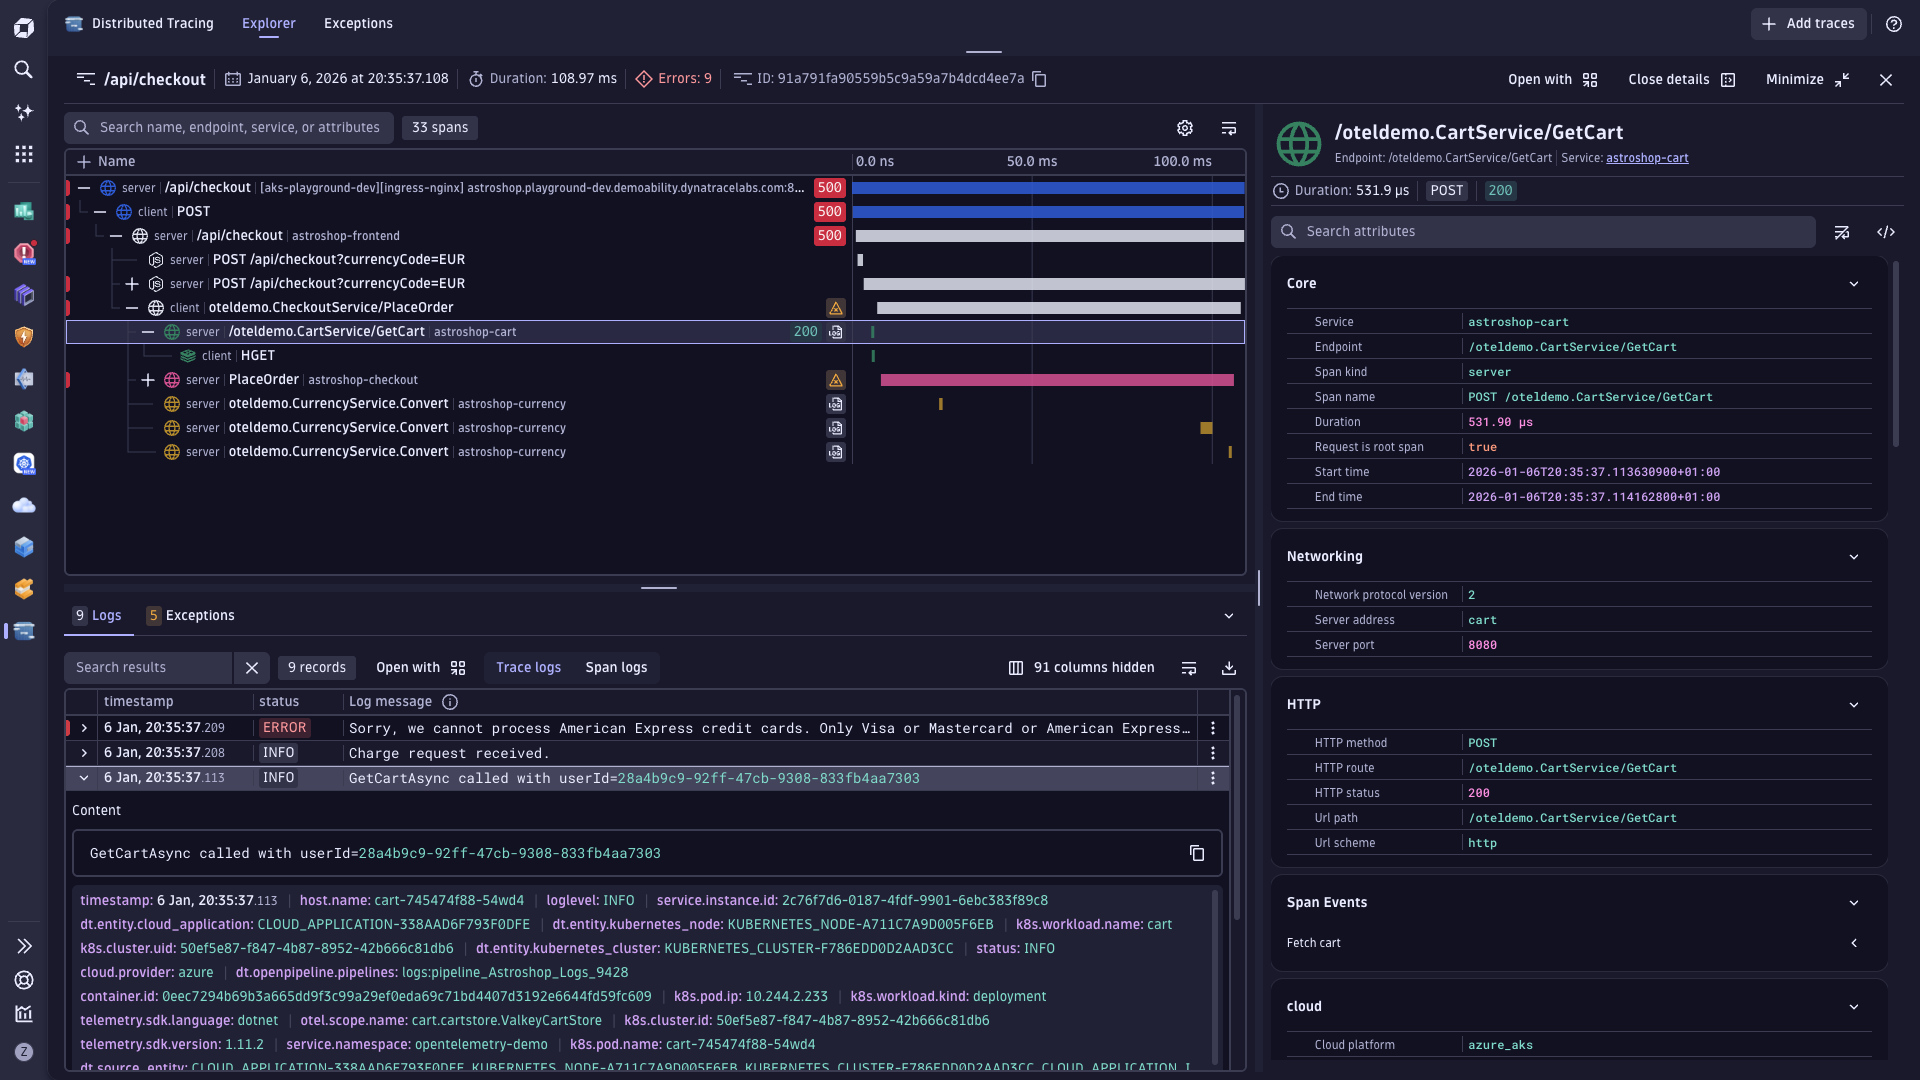
- Get the full picture by linking traces, metrics, logs, exceptions, and security details with real user experience data
- Automatically discover dynamic instances with support for serverless and containerized ecosystems
- Understand topological relationships and dependencies for all ecosystems (cloud, on-prem, hybrid)
- Cover everything with an extensible opencosystem that integrates additional data from sources like OpenTelemetry, Prometheus and many more
Troubleshoot problems with deep dive analysis
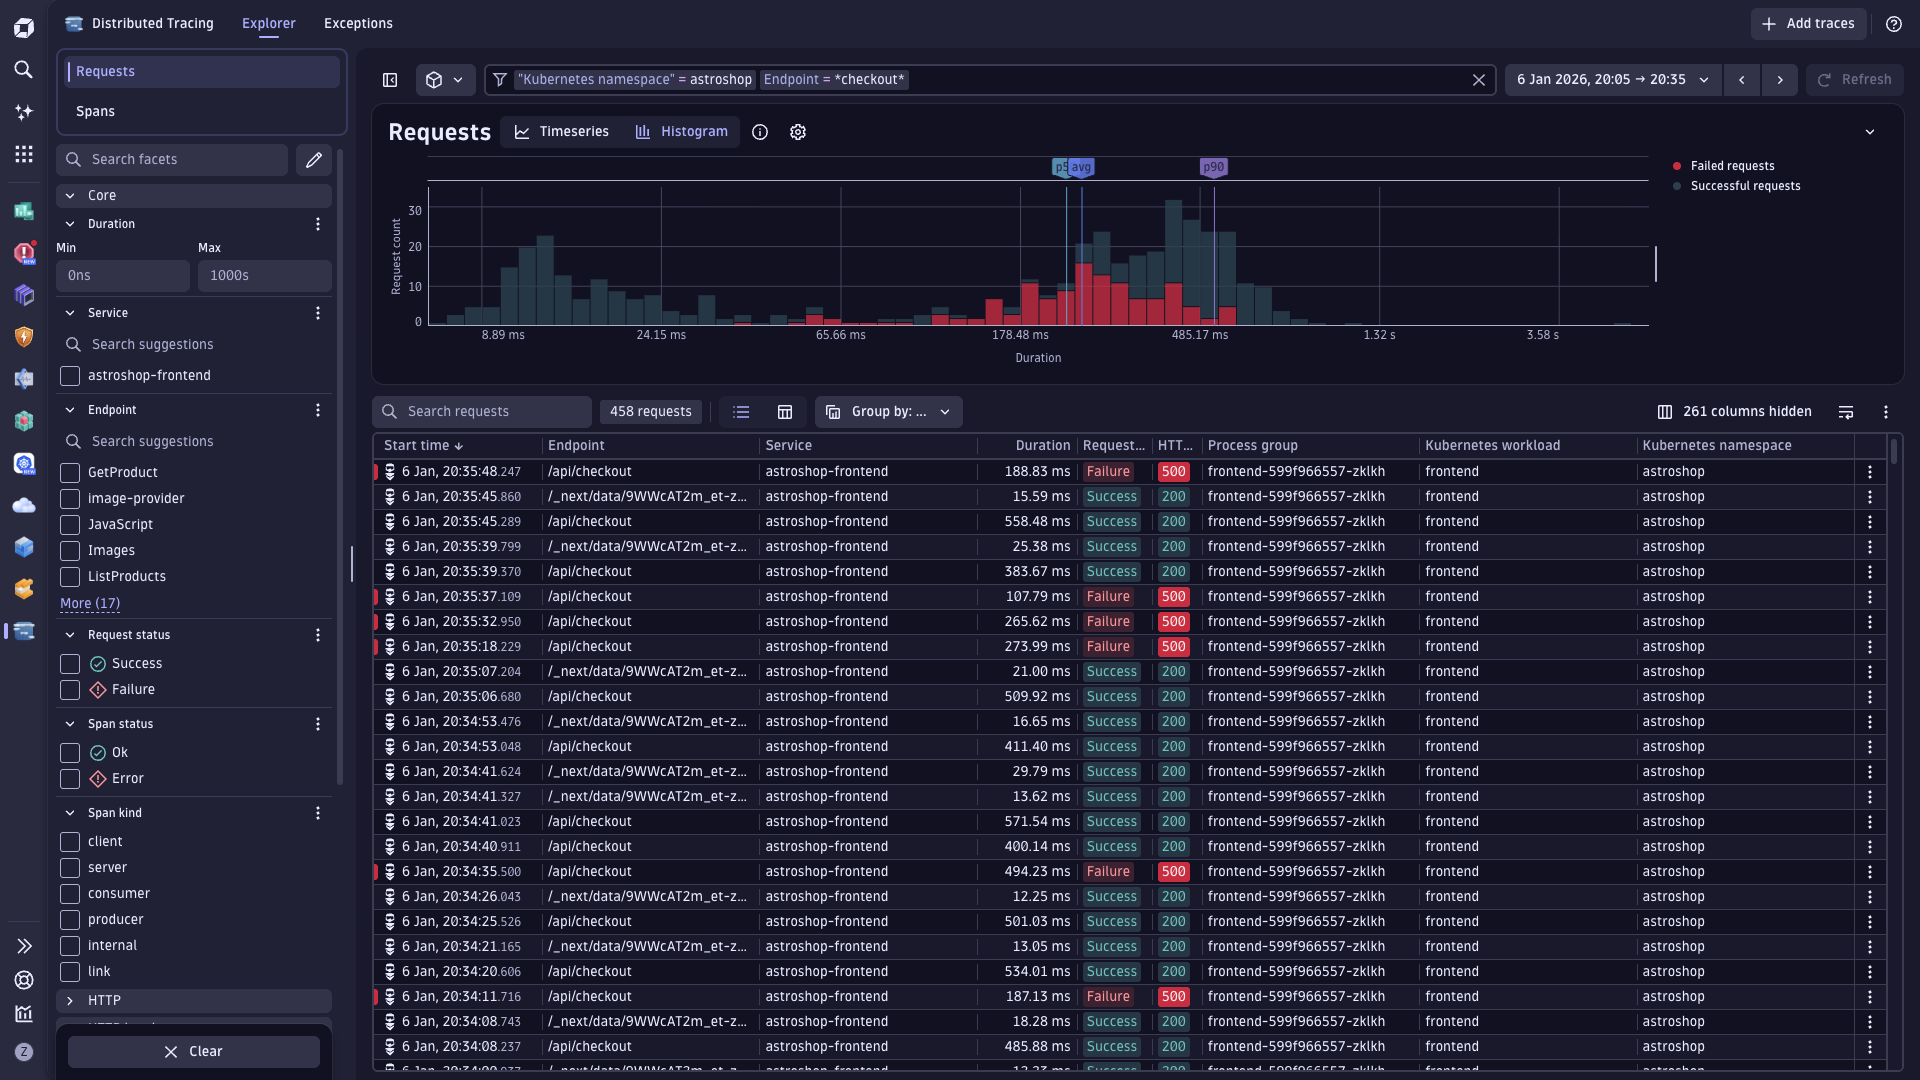
- Dynamically analyze failures and outliers by querying petabytes of trace data in real time
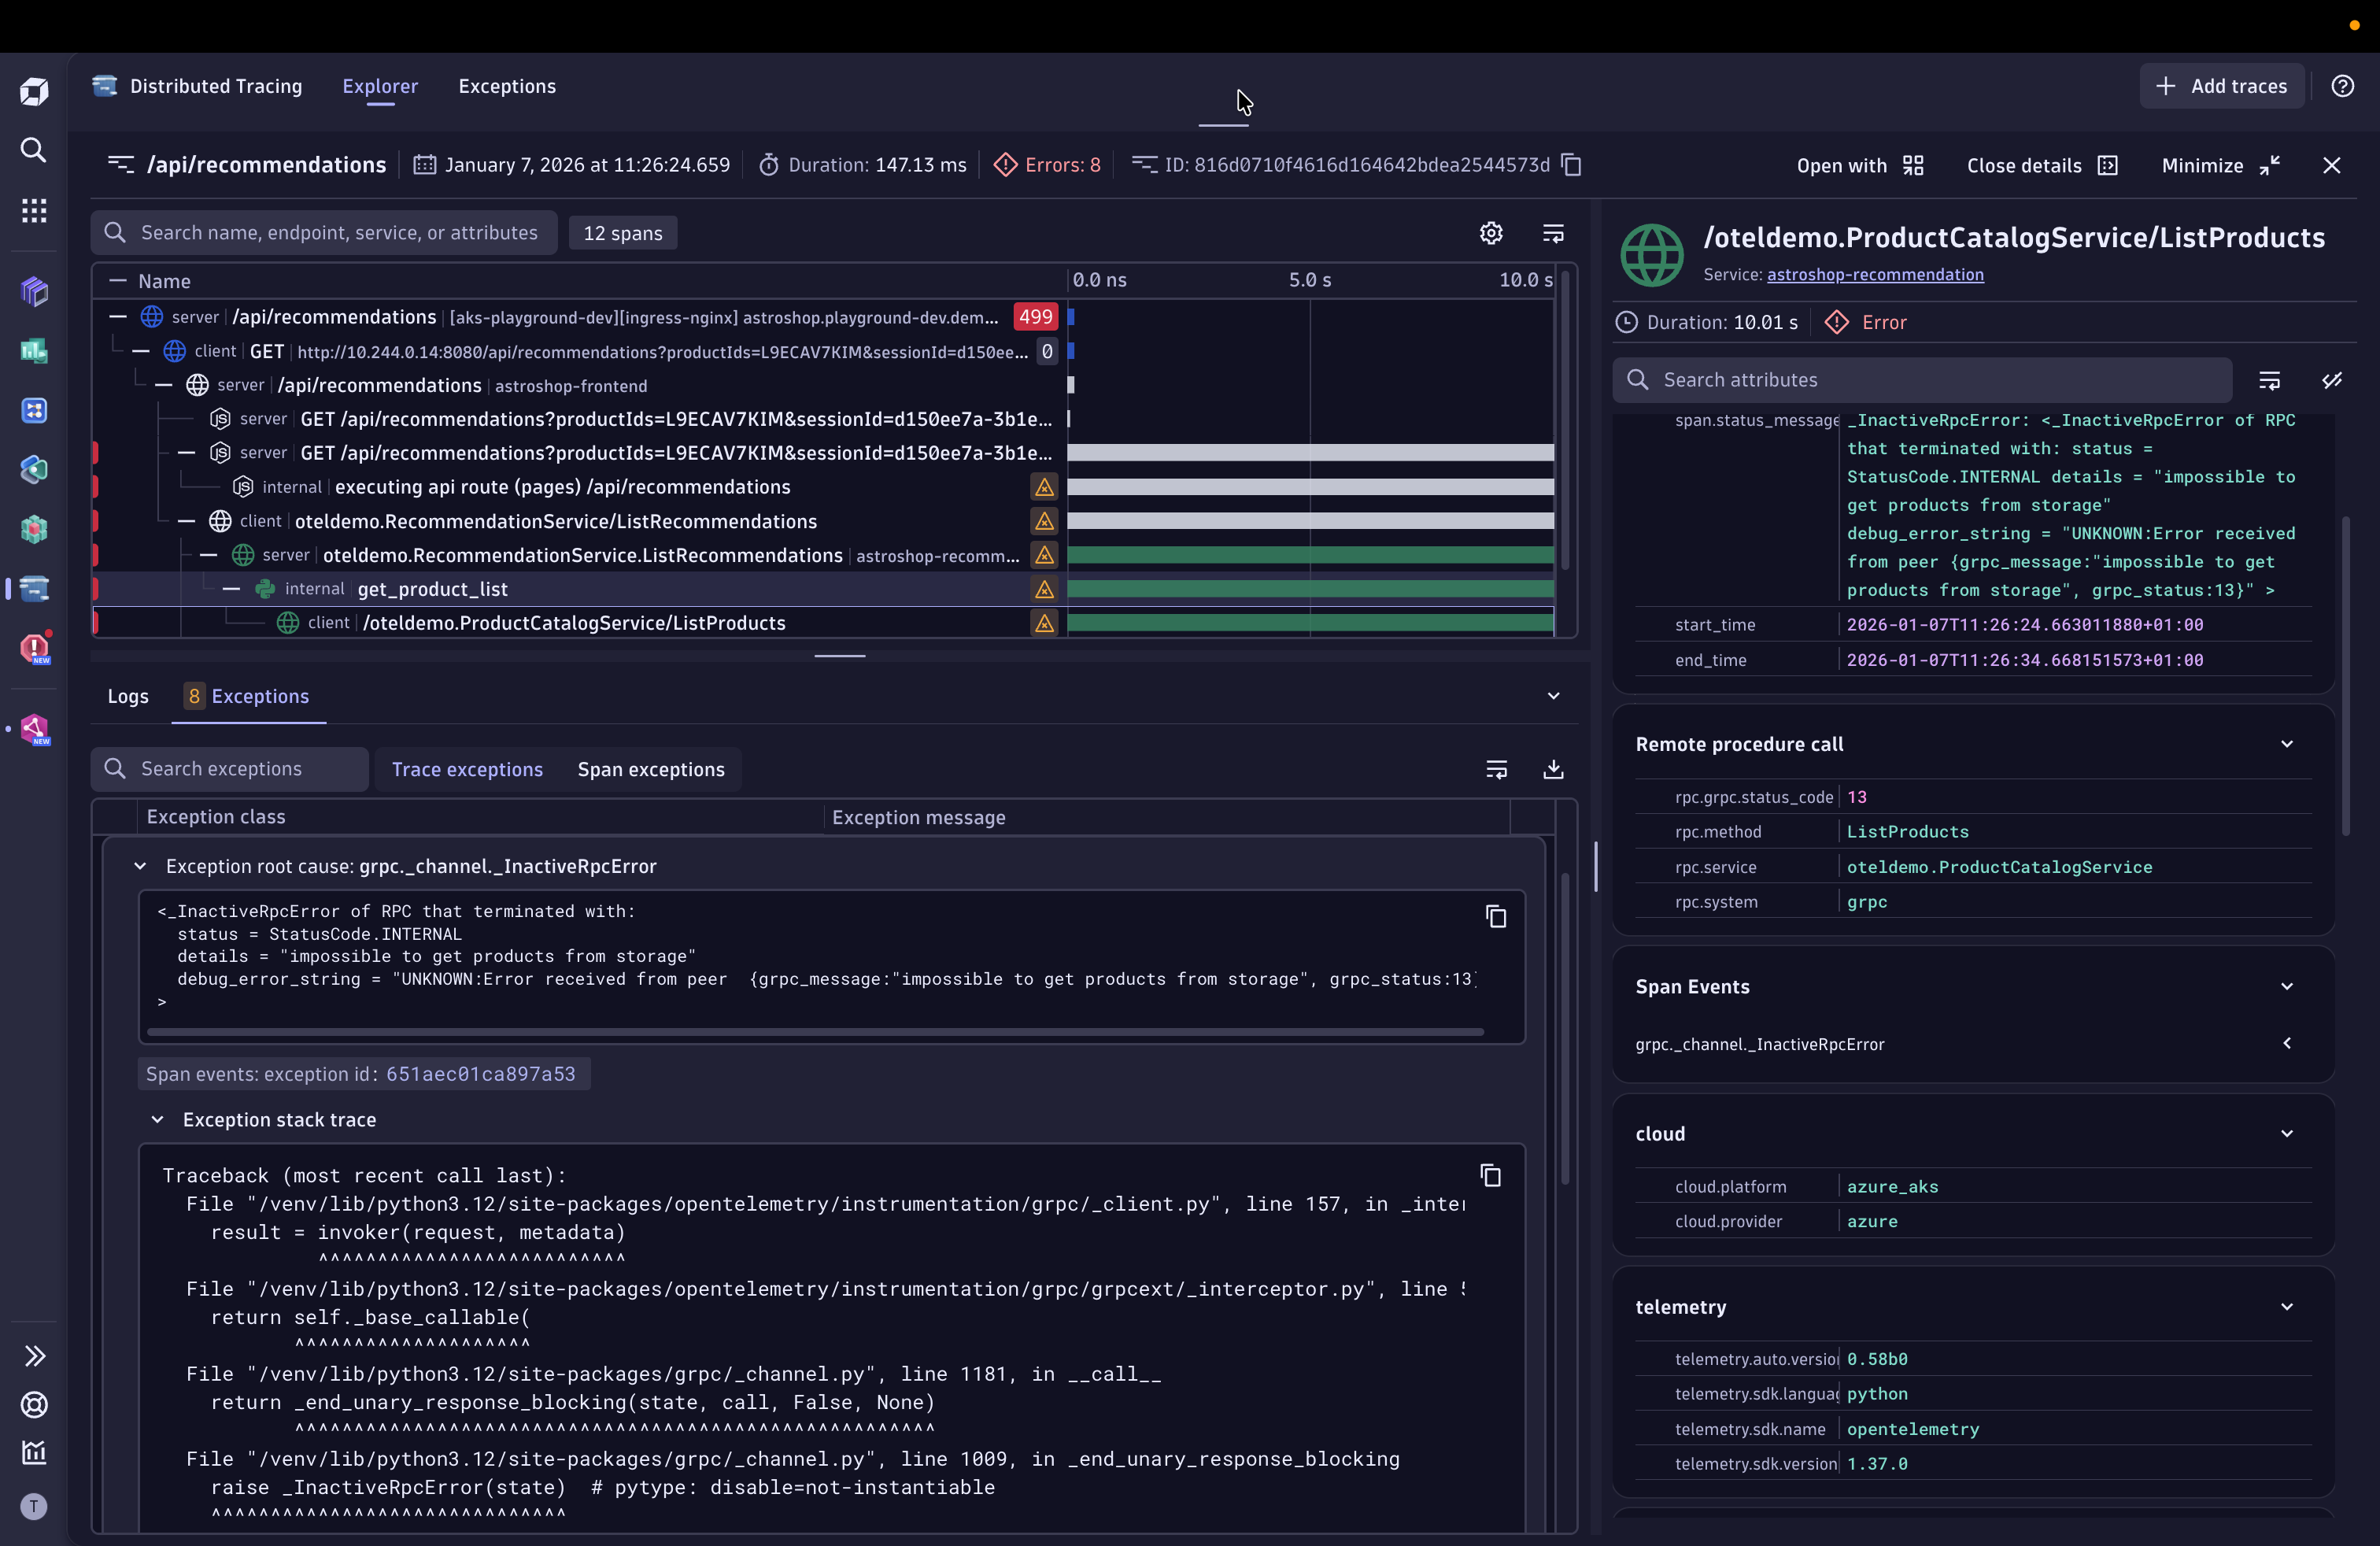
- Enrich trace data with logs, errors and meta-data including OpenTelemetry attributes, storage up to 10 years
- Surface and analyze exceptions across entire traces with full trace context to find your needle in the haystack
- Effortlessly group and filter traces without code or deployment changes, with Kubernetes attributes automatically in context
Resolve errors and performance issues faster with Dynatrace Intelligence
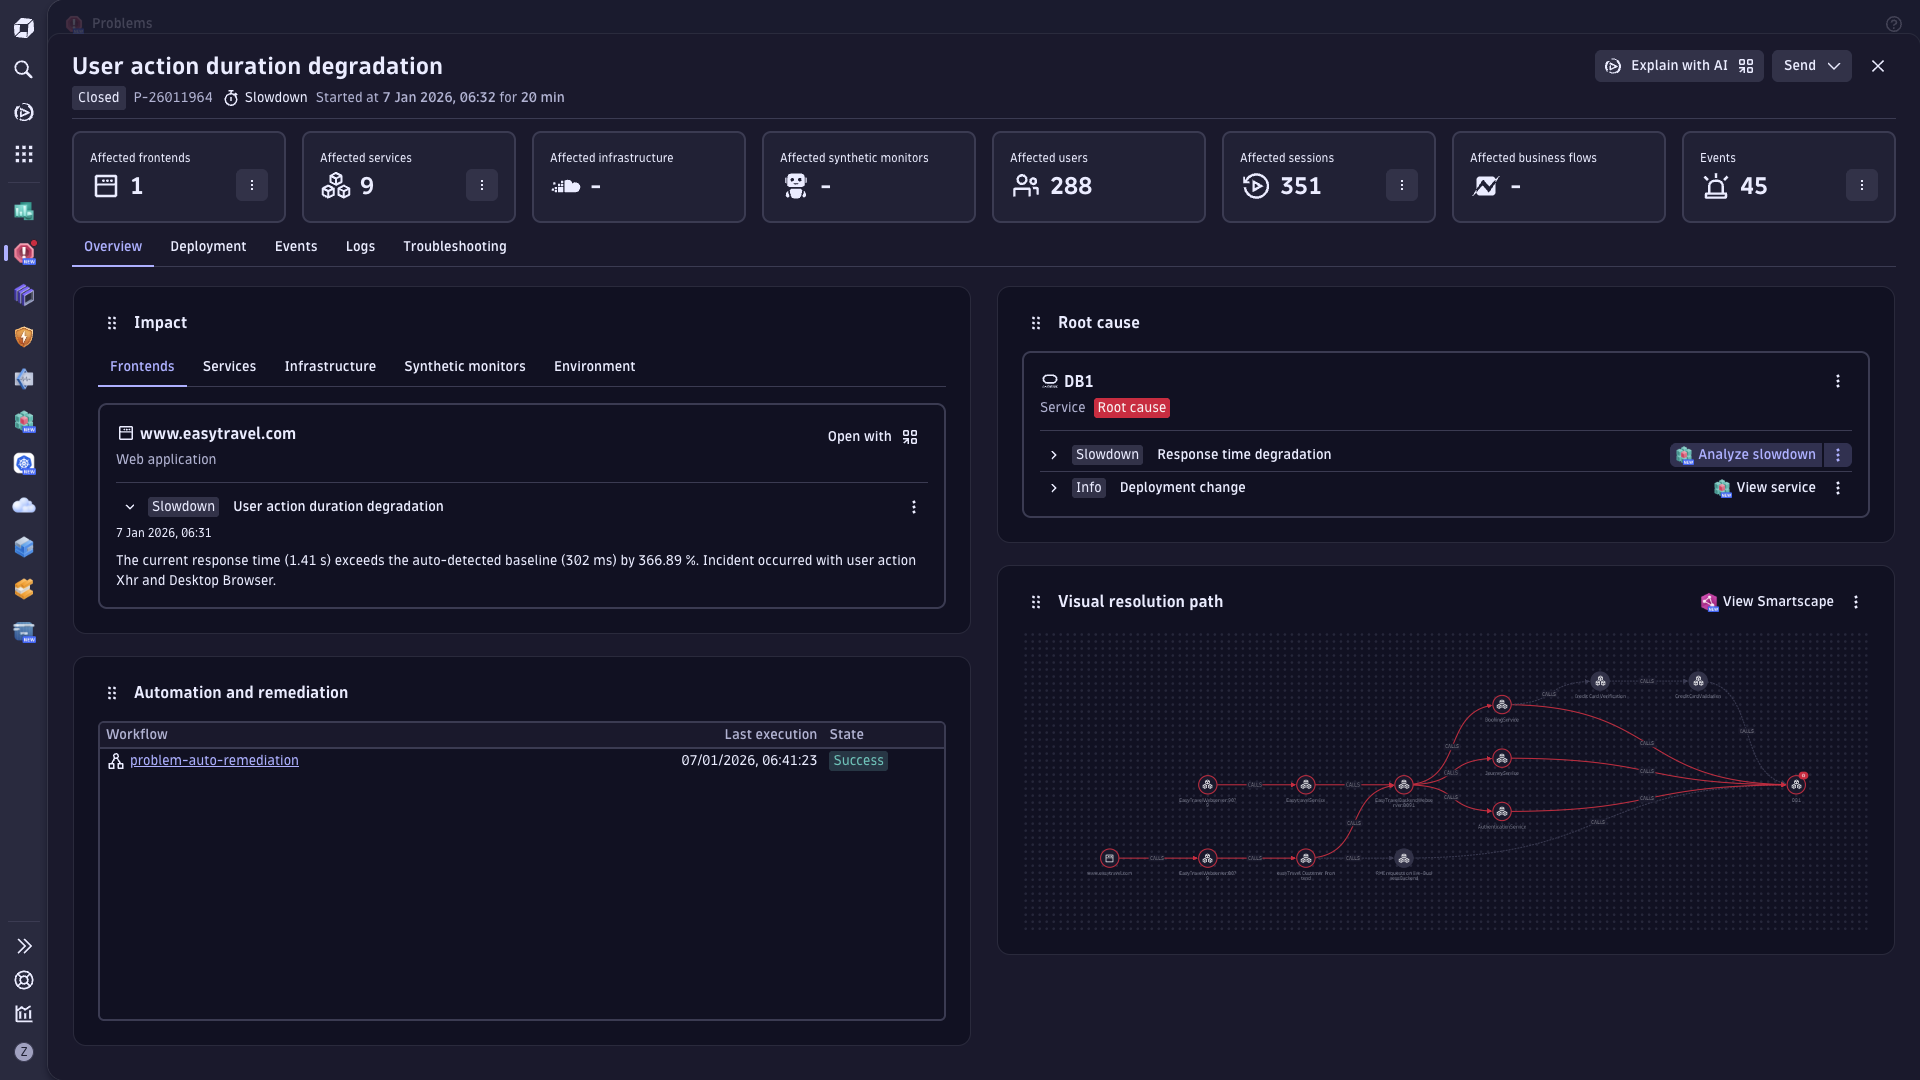
- Improve application health by understanding what failed and with automatic root cause determination
- Reduce noise with automated problem baselining for errors and slowdowns
- Take proactive measures to prevent future problems using exploratory analytics and predictive AI to analyze trace data
- Prioritize problem resolutions with business impact metrics
Discover Unknown Unknowns faster
- Combine all observability signals, including traces, logs, metrics, and topology data, to create specialized dashboards and charts
- Maximize application performance with instant identification of performance outliers
- Execute automated workflows based on trace data with Dynatrace's AutomationEngine
- Reduce the learning curve for analyzing trace data by using a standardized semantic dictionary for OpenTelemetry
This is how we do distributed tracing
-
OpenTelemetry
Ingest OpenTelemetry data, pin to a dashboard, and analyze alongside metrics, logs, and diagnostics. Use a Semantic Dictionary for easy onboarding and robust applications.
-
Grail
Dynatrace's patented Grail® technology is a causational data lakehouse that delivers precise answers with speed and at scale on a unified intelligence platform.
-
OneAgent
Get end-to-end distributed tracing, analysis, and actionable answers at scale with out-of-the-box support for OneAgent®.

Distributed Tracing resources
 BlogDistributed tracing with Dynatrace just got even better
Experience limitless tracing power with Dynatrace's. Explore and analyze trace data, logs, events, and metrics interactively—solving complex scenarios with unprecedented system visibility. App SpotlightDistributed Tracing with Dynatrace
Discover effortlessly distributed tracing with Dynatrace: intuitive filtering, visualization, and analysis for faster issue resolution. BLOG POSTOpenTelemetry observability and Dynatrace deliver actionable answers at scale
Supercharge OpenTelemetry data with Dynatrace. BlogWhat is distributed tracing, and why is it important?


