
Performance in Continuous Integration
Chapter: Performance Engineering

With agile development methods, we are able to test using stable systems either on a continuous basis or at regular intervals. This, in turn, has enabled a much larger degree of test automation and allows automating large parts of the test process, especially in the area of functional testing, where it has gained widespread adoption. We're now observing a similar trend in performance testing.
Automated performance testing is triggered from within the build process. To avoid interactions with other systems and ensure stable results, these tests should be executed on their own hardware. The results, as with functional tests, can be formatted as JUnit or HTML reports. Although test execution time is relevant, it is of secondary importance. Instead, additional log or tracing data can be used in case of execution errors. Most importantly, select those use cases that are most critical for the application's performance, such as searching in a product catalog or finalizing an order. It is necessary to identify and control trends and changes, and not useful to test the entire application under load.
Types of Tests
Use test frameworks, such as JUnit, to develop tests that are easily integrated into existing continuous-integration environments. For some test cases, it's appropriate to reuse functional tests or additional content validations. By applying the architecture validation discussed above to existing JUnit tests, it is no great effort to obtain initial performance and scaling analyzes.
In our own work, we had a case in which JUnit tests verified a product search with a results list of 50 entries. Functionally, this test always returned a positive result. Adding architecture validation by means of a tracing tool showed an incorrectly configured persistence framework, which loaded several thousand product objects from the database, and from these returned the requested first 50. Under load, this problem would have inevitably led to performance and scaling problems. Reusing this test enabled the discovery of the problem during development, with very little effort.
Besides using JUnit for unit testing, many application developers use frameworks, such as Selenium, which are used to test web-based applications by driving a real browser instead of testing individual code components. Selenium and similar test frameworks make it easy to use these tests for single-run functional tests and can be reused for performance and load tests. Listing 3.1 shows a Selenium script that can be used both for functional tests as well reused for load and performance tests.
 public class Example {
 public static void main(String[] args) throws Exception {
 // WebDriver driver = new HtmlUnitDriver();
 // WebDriver driver = new InternetExplorerDriver();
 WebDriver driver = new FirefoxDriver();
 // Open our Home Page
 ProductCatalogHomePage home = new ProductCatalogHomePage(driver);
 // Search for a product
 SearchResultPage result = home.searchForProduct("DVD Player");
 if(result.countResults() <= 0)
 throw new Exception("No Results returned");
 // Click on a Product
 ProductPage productPage = result.clickOnResult(1);
 // interact on the product page
 productPage.addReview("Should be a good product"); productPage.addToCart();
 driver.close();
 }
}
Listing 3.1: Web test frameworks, such as Selenium, can be used for functional tests, plus load and performance tests.
When conducting performance tests in a continuous-integration environment, we like to design test cases with a minimum run or execution time. Ideally, it should be several seconds. When execution time is too short, the test accuracy is susceptible to small fluctuations. For example, with a test case of 200 ms, a fluctuation of 20 ms amounts to 10% of execution time, whereas it is only about 2% for a test case of one second.
Note: There are still situations when classic load tests are preferred, especially when testing scalability or concurrency characteristics. Most load-testing tools can either be remote-controlled via corresponding interfaces or started via the command line. We prefer to use JUnit as the controlling and executing framework because the testing tools are easily integrated using available extension mechanisms.
Dynamic architecture validation lets us identify potential changes in performance and in the internal processing of application cases. This includes the analysis of response times, changes in the execution of database statements, and an examination of remoting calls and object allocations. This is not a substitute for load testing, as it is not possible to extrapolate results from the continuous-integration environment to later production-stage implementation. The point is to streamline load testing by identifying possible performance issues earlier in development, thereby making the overall testing process more agile.
Adding Performance Tests to the Build Process
Adding performance tests into your continuous-integration process is one important step to continuous performance engineering. Most simply, these performance tests can use (or reuse) existing unit and functional tests, and can then be executed within familiar test frameworks, such as JUnit. Figure 3.7 diagrams a typical continuous-integration process. It begins at the point when a developer checks in code, and continues through the build and test processes. It finishes with test and performance results before ending up back with the developer.
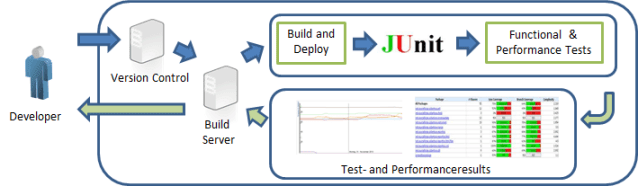
In addition to the functional results, performance-test results are analyzed and recorded for each build, and it is this integration of continuous testing with the agile ideal of continuous improvement that makes this method so useful. Developers are able to collect feedback on changed components in a sort of continuous feedback loop, which enables them to react early to any detected performance or scalability problems.
Conducting Measurements
Just as the hardware environment affects application performance, it affects test measurements. To facilitate comparisons between your performance tests, we recommend using the same configuration for all of your tests. And unless you're testing such external factors explicitly, it's important to eliminate timing variables, such as those caused by hard-disk accesses or network latency times in distributed tests. To achieve this goal, one must remove any volatile measurements and focus solely on measures not impacted by environmental factors.
The choice of tracing and diagnostic tools used to measure performance and determine architectural metrics can substantially affect the difficulty of this task. For example, to subtract the impact of garbage-collection runs, some tools can measure the total code-execution time. In the special case of eliminating the runtime impact of garbage collection from the JVM or Common Language Runtime, some tools automatically calculate a clean measure.
An alternative best-practice approach is to focus on measures that are not impacted by the runtime environment. So instead of looking at network latency or I/O, it is sometimes better to look at the number of hard-disk accesses, number of remoting calls, or data-transfer volume. These metrics will be stable regardless of the underlying environment.
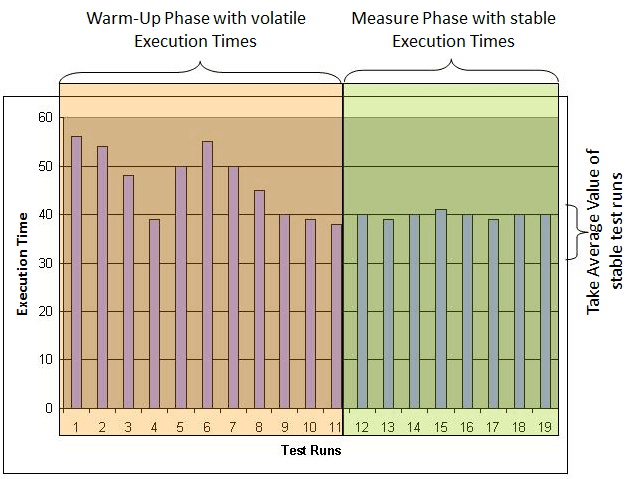
Whether you focus on measures that can be impacted by the executing environment or not, it is important to verify your test environment to assure sufficiently stable results. We recommend writing a reference test case and then monitoring its runtime. This test case performs a simple calculation—for example, a high Fibonacci 3 number. Measuring the execution time and CPU usage for this test case should produce consistent results across multiple test executions. Fluctuating response times at the start are not unusual. Once the system has "warmed up," the execution times will gradually stabilize. Now the actual test can begin. Figure 3.8 shows how one can use reference-test execution times to determine the point at which the system is stable.
Analyzing Measurements
Some key metrics for analysis include CPU usage, memory allocation, network utilization, the number and frequency of database queries and remoting calls, and test execution time. By repeating the tests and comparing results, we're able to identify unexpected deviations fairly quickly. (Obviously, if the test system isn't stable, our data will be worthless.)
In Figure 3.9, you can see timing results across multiple test runs. A regression analysis of the data shows on obvious performance degradation and we are then able to follow up with a detailed analysis of each component covered by the test. Also, we can identify potential scaling problems by analyzing the performance of individual components under increasing load.
Using this more-agile approach of testing during development, we're able to run regression analyzes for each new build while the code changes are still fresh in the developer's mind. The cost of fixing such errors days, weeks, or months later can be considerably higher, almost incalculably so if the project ship date is affected.
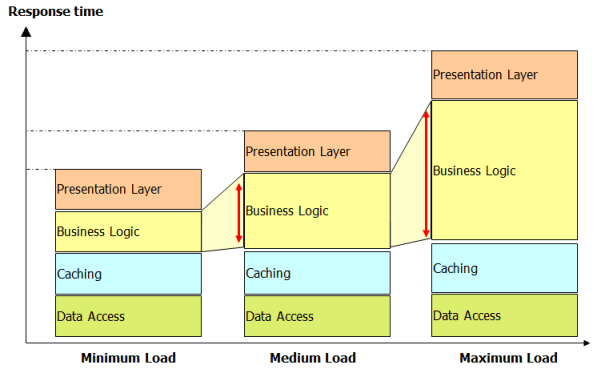
Figure 3.10 graphs the performance behavior of individual components under increased load. The results clearly show that while three of the four components scale well, the business-logic component scales poorly, indicating a potentially serious problem under production.
Performing these tests for each individual build is often not possible. Providing a separate load-test environment can be time-consuming or even impossible, so it's not usually possible to perform these tests for each build. However, if you're able to conduct more-extensive load and performance tests—for example, over the weekend—it can make a big difference in the long run. You can provide better insights into the performance of the overall system, as well as for individual components, and it needn't have a negative impact on your developers, who might be waiting for the next build.
Regression Analysis
Every software change is a potential performance problem, which is exactly why you want to use regression analysis. By comparing metrics before and after a change is implemented, the impact on application performance becomes immediately apparent.
However, not all regression analyzes are created equal, and there is a number of variations to take into account. For instance, performance characteristics can be measured by general response time, black-box tests, or by individual application components, white-box tests. Changes in overall system behavior are often apparent in either case, but there are also times when improved performance in one area might mask deterioration in another area.
In Figure 3.11, you can see how the introduction of a software cache layer relieves pressure on the database layer. Storing frequently called objects in memory is more efficient than retrieving the object every time through a database request. This looks like a good architectural change, as we have more resources available on the database to handle other data requests. In the next step it's decided to increase the cache size. A larger cache requires additional memory but allows for caching even more objects and further decreases the number of database accesses. However, this change has a negative impact on the cache layer's performance, as having more objects in the cache means more memory usage, which introduces higher garbage-collection times.
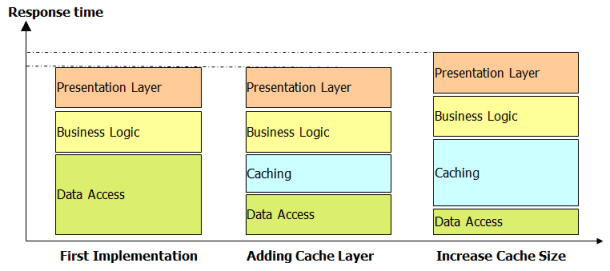
This example shows that you shouldn't optimize your components before making sure that there are no side effects. Increasing the cache size seems like a good practice to increase performance, but you must test it to know for certain.
When and how often should you do regression analysis? Here are three rules of thumb:
- Perform regression analysis every time you are about to make substantial architectural changes to your application, such as the one in the example above. To identify a regression of substantial architectural changes, it is often necessary to have the application deployed in an environment where you can simulate larger load. This type of regression analysis cannot be done continuously, as it would be too much effort.
- Automate regression analysis on your unit and functional tests as explained in the previous sections. This will give you great confidence about the quality of the small code changes your developers apply.
- Perform regression analysis in the load- and performance-testing phases of your project, and analyze regressions of performance data you capture in your production environment. Here the best practice is to compare the performance metrics to a baseline result. The baseline is typically a result of a load test on your previously released software.
Comparing results of load and performance tests or results captured in a production environment will not be as easy as comparing the results of two unit or functional tests, as there are many measures that get captured. Therefore the first steps to analyze the captured data are as follows:
- Focus on high-level metrics, such as response times of transactions or service requests.
- Drill deeper into the measures of transactions that show a regression.
Figure 3.12 shows the comparison of a load test against the baseline results. You can see that certain web service calls are much slower than in the baseline. As a next step, we would dig deeper into this particular problem to identify what exactly changed in these web service calls.
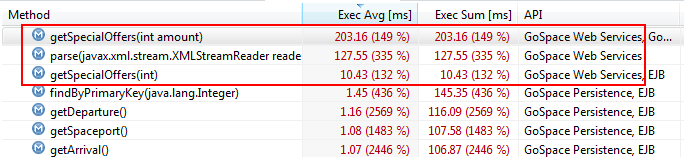
The difference between any two test runs can be determined except when comparing method-call results. Anything that can be measured over time is fair game for regression analysis. So in addition to performance, we can measure the effects of increased load over time and use this data to test application scalability. This is especially useful for testing optimization scenarios, where you might want to test general optimization effectiveness versus the effectiveness for a specific scenario.
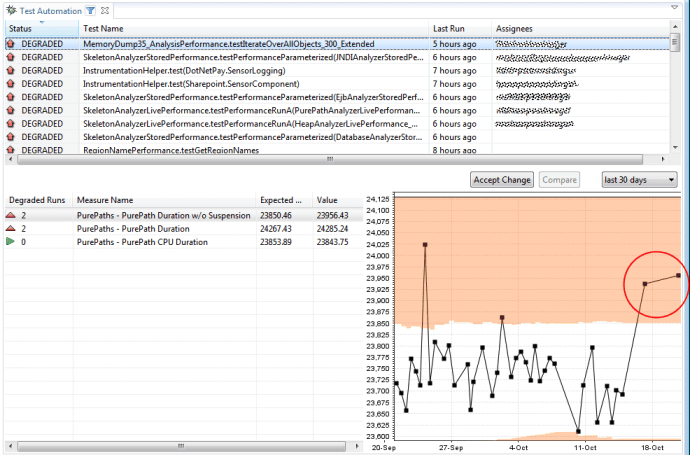
We had a situation in our own product development where the goal was to improve performance in analyzing a memory dump. We achieved significant improvements for heaps up to 2 GB, but as the heap grew beyond that size, the new algorithm led to greater deterioration. This problem was discovered using an automated test with different heap sizes to find out whether the new implementation actually scaled.
Figure 3.13 shows the performance-regression dashboard used to track this problem. You can see that the initial regression was identified on May 19th. After fixing the problem, the initial problem for that heap size went away, but a regression was immediately identified for another heap size. These bug fixes had a positive but also a negative impact on the overall application performance.
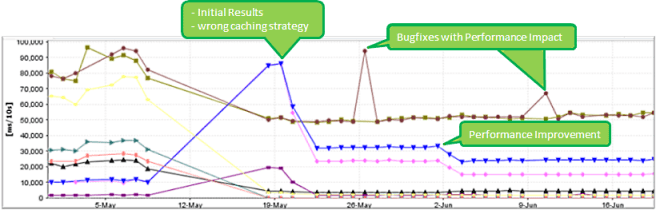
This example emphasizes how important it is to test specific scenarios where we might expect problems. By testing the same code with different input values, it's possible to determine the potential side effects of a code fix.
Automating this type of regression analysis allows you to identify problems as they get introduced in the code. It allows your developers to immediately fix problems and eliminate side effects, but only as long as the memory of what they have been working on is fresh. All these efforts result in higher-quality code, a smoother development cycle, and shorter testing cycles.
Table of Contents
Application Performance Concepts
Memory Management
How Java Garbage Collection Works
The Impact of Garbage Collection on application performance
Reducing Garbage Collection Pause time
Making Garbage Collection faster
Not all JVMS are created equal
Analyzing the Performance impact of Memory Utilization and Garbage Collection
The different kinds of Java memory leaks and how to analyze them
High Memory utilization and their root causes
Classloader-releated Memory Issues
Performance Engineering
Virtualization and Cloud Performance
Try it free
