
Performance Analysis of Cloud Applications
Chapter: Virtualization and Cloud Performance

Detailed performance analysis is a complex process, but the goal is very simple: to identify the root cause of a problem. Toward this end, we proceed in an orderly, step-by-step manner to home in on the fault domain containing the root cause. Since this chapter is specifically about virtualization and cloud computing, we'll discuss how those two domains affect this process. But first let's examine the high-level flow of a root-cause analysis.
We begin with a typical problem, slow application response time, then in step-by-step fashion, we'll narrow down the possibilities:
- Decide whether the problem affects the entire application, or just a particular transaction or transaction type. If the latter, then our first step is to isolate the transaction type that slows down. This will define the context for further investigation.
- Identify the problematic tier or tiers. The problem might lie between two tiers (i.e., due to network latency).
- To isolate the problem further, check whether the environment itself has a negative impact, such as CPU exhaustion, memory constraints. This would include anything that is external to the application itself; for instance garbage-collection suspensions.
- Finally, isolate the problem to a specific component, method, or service call within the application. From this point, we can determine if the root cause is algorithmic, CPU-centric, a result of excessive VM suspensions, or caused by external bottlenecks, such as I/O, network, or locks (synchronization). This last step is the first step towards a potential solution.
While this flow might be slightly different in your environment, it can be applied to any system, cloud-based included, though with an important caveat: virtual systems suffer the time-keeping problem triggered by VM suspensions, which can cause us to identify the wrong tier as problematic. Thus, whenever we look at response or communication times, we must measure real time (as opposed to apparent time). We can achieve this either via virtualization-aware timers in the VM or by measuring response time outside the VM in a system that is not itself affected (e.g., an appliance).
If inter-tier time is rising, it can be due to an increased number of transactions or an over-utilization of the underlying network infrastructure. (Better pay a friendly visit to the administrator if the latter is the case.)
If instead we've identified a single problematic tier, our first step is to check for excessive VM suspensions. We can do this by looking at the reported steal time and correlating it with our transactions on a time basis. If the granularity of our measure is sufficiently fine, we can know that a specific transaction, or even method, was suspended. With insufficient granularity we know only that a transaction might have been suspended. For example, if transactions complete in one second but our granularity is measuring 20-second intervals (the default interval of VMware's vCenter), we can't be certain of our results. Finer granularity leads to greater certainty.
Note that in a given virtual system we will always see some steal time, but it should not be high. It should be similar in amount to a garbage collection: a few milliseconds per 20-second cycle.
Next we analyze the tier itself for method-level hot spots. Here we face some familiar problems:
- Virtualization-aware timers are more costly than the usual OS timers and impose overhead on detailed measurements that can be counterproductive.
- VM suspensions can create the illusion of slowness even for what should be a fast method, potentially leading our analysis down the wrong path. Therefore, we must differentiate between real time (which includes suspensions) and actual execution time (which does not).
- VM suspensions are nearly never reported at the level of granularity necessary to deal with the two previous points!
This seeming conundrum has two possible solutions:
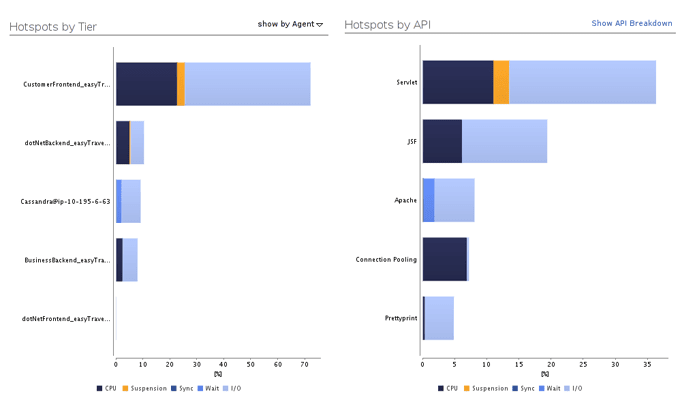
- We can rely on guest timers alone, which you might think would skew our data since this makes it impossible to use single-transaction diagnostics. However, if we do not experience major VM suspensions (which we can check by looking at the steal-time charts, shown Figure 7.8), the law of big numbers prevents skewing when we look at aggregated data from thousands of transactions.
- We can correlate VM suspensions to a detailed transaction breakdown, much as we do with GC suspensions. By excluding more heavily impacted transactions (more than a couple of milliseconds), our analysis avoids the timing problem.
We're finally at the point where we've isolated a particular code area, service call, or method as the likely root cause. Now we figure out why it is slow. The most common cause is too much CPU consumption. Since we're talking about virtual environments, we must ask again if the reported CPU time can be trusted. Surprisingly, the answer is yes, mostly.
Most hypervisors handle steal time in a way that minimizes CPU impact in any of the user processes. This means that average CPU consumption for a transaction measured in CPU time will be fairly accurate. (Remember that this is not true for CPU utilization.) If we see a consistent increase in this measure, we can trust it to mean that the application code is really consuming more CPU time.
The reverse is also true. If the time of our transaction increases in a specific part of the application (as opposed to all over the place) and cannot be attributed to CPU, sync, steal, wait, or garbage-collection time, then it must be attribute to increased latency in the virtualization layer. But we needn't just guess.
We know which methods in our application access the network or the disk. By using virtualization-aware timers for these access I/O points, we know that when these measured times increase, there is either a genuine latency issue or a suspension. Either way, the next step is to look at the virtualization layer for answers and speak with the administrator about solutions.
That's nearly all there is to it. As already mentioned, there is a major difference in goals when doing performance management in private vs. public clouds. There are also technical differences in the performance analysis. That brings us to the next topic.
Analyzing Performance for Cloud-based Applications
In addition to the performance issues we face with any virtualized environment, clouds present a couple of unique problems.
First, a VM might move or be retired at any point. To analyze performance issues after the fact, which is usually the case, we need to reconstruct the flow of a transaction across its VMs, including information on the original physical hosts. We need the physical host not because we need to analyze its utilization per se, but because we need to know about other VMs running on the same host. How many and which other VMs are running on the same host as ours can change at any time, and thus the applications that can impact ours can change any time. Without this knowledge, we might know that we're not getting enough resources, but not why! Root-cause analysis is all about understanding the why.
Here we have the fundamental difference between public and private clouds. In a private cloud I can have the visibility required to analyze the real underlying root cause; in a public cloud I do not!
Public Clouds = Less Visibility
In a public cloud we do not have visibility into the host layer; therefore we cannot make the correlation between host and guest problems. Although other applications (including other companies') can have an impact on ours, we cannot identify these as the root cause. This is also where performance analysis, or rather fixing performance problems, is different from a normal virtual environment or private cloud.
When the application is not the root of a performance issue, and we've confirmed increased latency at the virtualization layer, then we know that a direct fix won't work. Chances are the problem stems from over-utilization or hardware degradation, but we can't know for sure. We have two options:
- Add a new instance and scale up, under the assumption that the problem is temporary.
- Recycle the instances by starting a new instance and terminating the old ones afterwards. This more aggressive approach makes the assumption that the new instance will be started on different hardware that is not yet over-utilized or does not degrade. If the assumption is true, then the new instance will execute without problems.
Both actions can be set to run automatically in a cloud environment. Deciding which of the two approaches to take depends on what works best for your application.
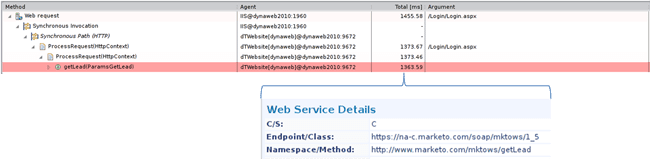
With a public cloud, we have not only less visibility into the environment, but also less control. Third-party services, such as load balancers and databases, are part of the package. So it's important to have proper fault-domain identification on a business-transaction level. We can measure calls to cloud and third-party services from within the application. By monitoring our application at this level, we maintain the control we might otherwise have lost to the cloud. Calls to cloud and third party services need to be measured with virtualization-aware timers to allow accurate fault domain isolation (Figure 7.9).
Our course of action depends on the service and our contract, and this dependence on the third-party provider is often the major tradeoff when using a public cloud.
Even more important than the technical differences in performance analysis for public and private clouds is the question of why we analyze performance and then what to optimize for!
Optimization Goals and Paradigm Shifts
In a private cloud (or physical datacenter) we optimize first to achieve our application goals (service-level agreements, or SLAs), and next to save resources so that we can delay buying new hardware as long as possible.
In a public cloud this is less of an issue, as we pay for hardware only when we use it. We can even give back what we're not using during off-peak hours to avoid additional charges. Consequently, we needn't optimize resource usage directly, but rather in relation to cost efficiency. Cost in a public cloud depends not only on the number of instances, but also on the number of I/O requests, amount of traffic, number of service calls, and other services. Reducing the number of I/O requests might considerably lower the cost per transaction while not necessarily lowering the number of instances we have in use.
This has important implications for application performance monitoring. Once the application goals (response time, throughput, SLA) are met, we bypass resource efficiency and go directly after cost efficiency!
Table of Contents
Application Performance Concepts
Memory Management
How Java Garbage Collection Works
The Impact of Garbage Collection on application performance
Reducing Garbage Collection Pause time
Making Garbage Collection faster
Not all JVMS are created equal
Analyzing the Performance impact of Memory Utilization and Garbage Collection
The different kinds of Java memory leaks and how to analyze them
High Memory utilization and their root causes
Classloader-releated Memory Issues
Performance Engineering
Virtualization and Cloud Performance
Try it free
