
Monitoring Applications in Virtualized Environments
Chapter: Virtualization and Cloud Performance

Virtualization vendors provide built-in tools for monitoring virtual machines and their underlying hosts. One can generally obtain metrics for utilization and throughput, and sometimes for latency of the virtual infrastructure. This allows us to maximize utilization while keeping latency measures low, but we lack the context to guarantee that our application runs smoothly. Without understanding the impact of virtualization itself, we can't understand how hardware latency or utilization actually affect an application's performance.
In a virtual environment, the concept of real time is difficult. We'd like to continue using transactional performance as our measure of optimization, but how do we go about measuring the response time of a single transaction in a virtual world ( Figure 7.4 )? The guest system has no awareness of real time, so we must either use some form of virtualization-aware timer, like a tickless timer, or use something like a network appliance to measure outside of the virtual machine.
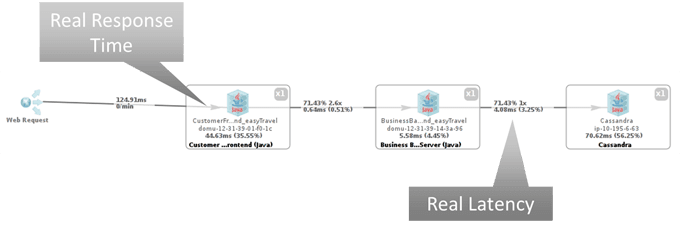
To identify latency issues in a distributed system (as depicted in figure 7.4), we need real response time metrics for every tier from both the client and server side of a call (see red boxes Figure 7.5). To understand the cause, we need to measure the transaction load on the application and how inter-tier latency is affected by that.

If inter-tier response time is rising with otherwise-stable tier response times, then we most likely face an overloaded virtual network. We can either reduce the load in terms of application communication or transactions, or talk to the network and VM administrators.
If the response time of a tier is rising while transaction load and CPU consumption remain stable, we likely have de-scheduling issues. We can check this by correlating the CPU ready/steal time to our tier response times. If we see an equivalent rise in steal time, we know that the VM doesn't get enough CPU time allocated, which again results in a walk to our VM guy's office.
Defining Key Virtualization Metrics
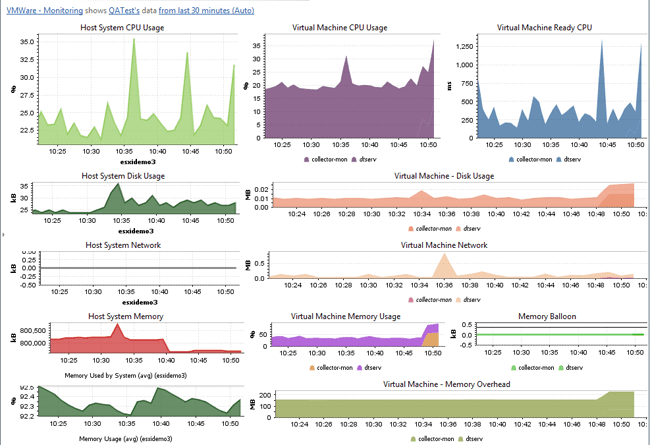
The list of virtualization metrics is long and can be very daunting at the start (see Figure 7.6). For this reason I have identified a list of key metrics that focus on measuring how virtualization and resource shortage impact the application.
A measure of overhead caused by the hypervisor. More specifically, time during which the VM was suspended and therefore unable to execute CPU instructions. There is always a small, measurable overhead, but it should never grow beyond the 5% range. If it does, the underlying hardware is overloaded. Much as garbage-collector suspension time correlates to application performance, there is a direct correlation between steal time and response time. one can even express steal time as a percentage of response-time-delay. with this, one can actively monitor the impact of virtualization on application performance.
- CPU Swap Wait - Time the VM must wait while the hypervisor swaps parts of the VM memory back in from disk. This is caused when the hypervisor itself needs to swap, either because the guest has no balloon driver installed or because there is a critical memory shortage. This measure can also be directly related to application response times. As a solution, install the balloon driver and/or reduce the number of VMs hosted on the physical machines.
- CPU System /Wait vKernel - As a measure of CPU resource overhead, most virtualization systems report CPU or wait time for the virtualization kernel itself, consumed per VM. Although this cannot be correlated directly with response time, if it grows significantly it will likely impact ready time and swap time. The system is either misconfigured or overloaded, and you need to reduce the number of VMs on the machine.
- Memory Balloon - When under memory pressure, the host system will steal memory from its VMs via ballooning. Memory ballooning represents a shortage of memory with serious performance implications at the guest level, including swapping, smaller file-system buffers, and smaller system caches.
- Memory Swap Rate - The amount of swapping for each VM performed by the virtualization infrastructure. High swap rates increase the CPU swap time and always have a negative impact on application performance. Therefore, the swap rate is the better metric than swap usage because it represents real impact. Note that swapped-out memory has no impact if unused, and if it is swapped in, then the swap rate will reflect the impact.
- Memory Usage: Host, VM and granted - Memory usage can be measured at the host level, the VM level, and as granted memory. Memory is allocated to the VM only when a guest uses it. Once allocated, the used memory segment is considered granted. Most systems cannot (or will not) reclaim memory, and there's little point in trying, because most guests use any extra for buffers and caches and never relinquish what has been granted. Therefore, we can know a VM's physical-memory usage by looking at granted memory. The difference between used and granted memory represents the rate of overcommitment, and this can be indirectly reassigned via ballooning.
- Disk/Network Latency - Some virtualization vendors provide built-in latency measures for disks and network interfaces used by a VM. Since there's a direct correlation between latency and response times, any increased latency at the hypervisor level will result in latency on the application, as well. Too much latency points to a system overload, indicating a need to reconfigure.
These metrics enable us to monitor and detect any negative impact that a misconfigured or overloaded virtualized system might have on our application. As a next step we need to understand how the cloud is different and why it represents an even greater challenge.
Table of Contents
Application Performance Concepts
Memory Management
How Java Garbage Collection Works
The Impact of Garbage Collection on application performance
Reducing Garbage Collection Pause time
Making Garbage Collection faster
Not all JVMS are created equal
Analyzing the Performance impact of Memory Utilization and Garbage Collection
The different kinds of Java memory leaks and how to analyze them
High Memory utilization and their root causes
Classloader-releated Memory Issues
Performance Engineering
Virtualization and Cloud Performance
Try it free
