
Controlling Measurement Overhead
Chapter: Application Performance Concepts

Performance measurement comes at a cost, and this will vary depending on the approach employed. For instance, it's impossible to measure the execution time of a method, and then process and store the data without creating overhead. We may perceive this extra load in the form of longer response times, increased CPU utilization, increased memory usage, or as additional network load.
In addition to the performance impact, overhead can result in so-called Heisenbugs, named after the Heisenberg uncertainty principle, in which problems appear or disappear as a result of the measurement. There's an inevitable risk, however small, that the overhead of measuring performance will degrade performance. Let's examine the different types of overhead that can occur and see how performance measurements can affect an application's runtime behavior.
Controlling Response-Time Overhead
Increasing response times have the most direct effect on users, so response time overhead is the most critical. Generally, the more we measure, the larger the overhead. This is specifically true for all event-based measurements taken during the execution of application code. When we use an instrumentation-based measurement approach, we should not instrument methods with a very high call frequency and an individually short execution time. Overhead will be biggest in this case.
For example, if the instrumented diagnostics code requires one millisecond, then the overhead for a method execution time of 100 ms is one percent. If the method takes only 10 ms, then we are already at 10 percent overhead. Response time overhead is often described in percentages, for example 3% — 5% for a production system and slightly more for a test environment. You can describe overhead as a percentage of the actual response, but this value can be hard to put into context. Still, in many cases, referring to actual numbers is easiest. For instance, it's more descriptive to say that monitoring makes the application 20 ms slower, than it is to say that an application has a two percent overhead.
Controlling CPU and Memory Overhead
Performance measurement not only impacts response times, but also affects CPU and memory usage. The more measurement logic is executed, the more CPU and memory are taken away from the application.
Monitoring tools use two basic strategies to reduce overhead. One is simply to sample a percentage of transactions. This has the obvious drawback that we lose full application visibility. The more sophisticated approach is to offload CPU- and memory-intensive processing to dedicated servers, leaving only timestamp capturing in the application.
As it turns out, it's most important to avoid CPU overhead, keeping it at less than one per cent. For memory consumption, we must ensure that none of the memory re-sources required by the application are for monitoring. Also, if the monitoring logic does not manage memory efficiently, this could cause additional garbage collection, which is yet more overhead.
Controlling Network Overhead
Most performance tools send monitoring results over the network to a centralized server. The greater the amount of data measured, the greater the volume of data transferred over the network. Measurement interval and the number of measurements also affect amount of data transferred.
Let's look at the effects of sending event-based measurements of method calls over the network. We have 1000 users working with the application, resulting in 100,000 method executions measured per second. If, in a naive approach, the method name (average of 15 characters) and the execution duration are sent in an 8-byte data type for each method, this results in 100,000*(15 + 8) = 2,3 MB/sec. Such a high usage of the network can, and often will, have serious side effects on the application behavior.
This might not be a problem in a small load or even local desktop environment. However, when monitoring large production environments, we need highly optimized methods in which only a few bytes are transmitted.
To reduce network traffic, some measurement methods aggregate data within the application before sending it to a centralized server. Unfortunately, this approach has the drawback of consuming additional resources that might be needed by the application.
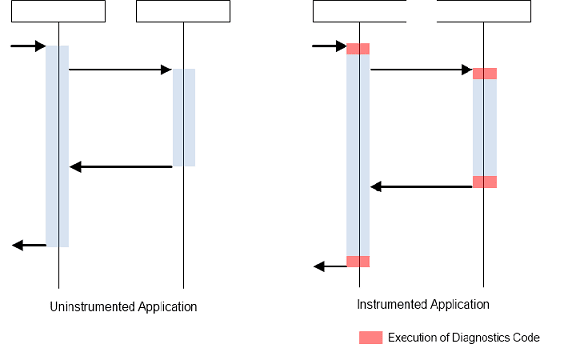
Measuring Overhead
The most straightforward way to measure overhead is to run the same load test twice; once against the non-instrumented applications, and once against the instrumented application. During the test run, measure response times, CPU, memory, and network utilization. Comparing the measurements of these two tests provides a measure of overhead.
Table of Contents
Application Performance Concepts
Memory Management
How Java Garbage Collection Works
The Impact of Garbage Collection on application performance
Reducing Garbage Collection Pause time
Making Garbage Collection faster
Not all JVMS are created equal
Analyzing the Performance impact of Memory Utilization and Garbage Collection
The different kinds of Java memory leaks and how to analyze them
High Memory utilization and their root causes
Classloader-releated Memory Issues
Performance Engineering
Virtualization and Cloud Performance
Try it free
