
Infrastructure observability grounded in context
Automatic, intelligent infrastructure monitoring across hybrid and cloud environments, with AI-powered answers you can act on.
When infrastructure fails, the business stops
Every minute of downtime costs revenue, trust, and the sanity of the engineers hunting for a cause. Dynatrace gives your team AI-powered answers across your entire infrastructure, so service is back in minutes, not hours.
Get answers, not false positives
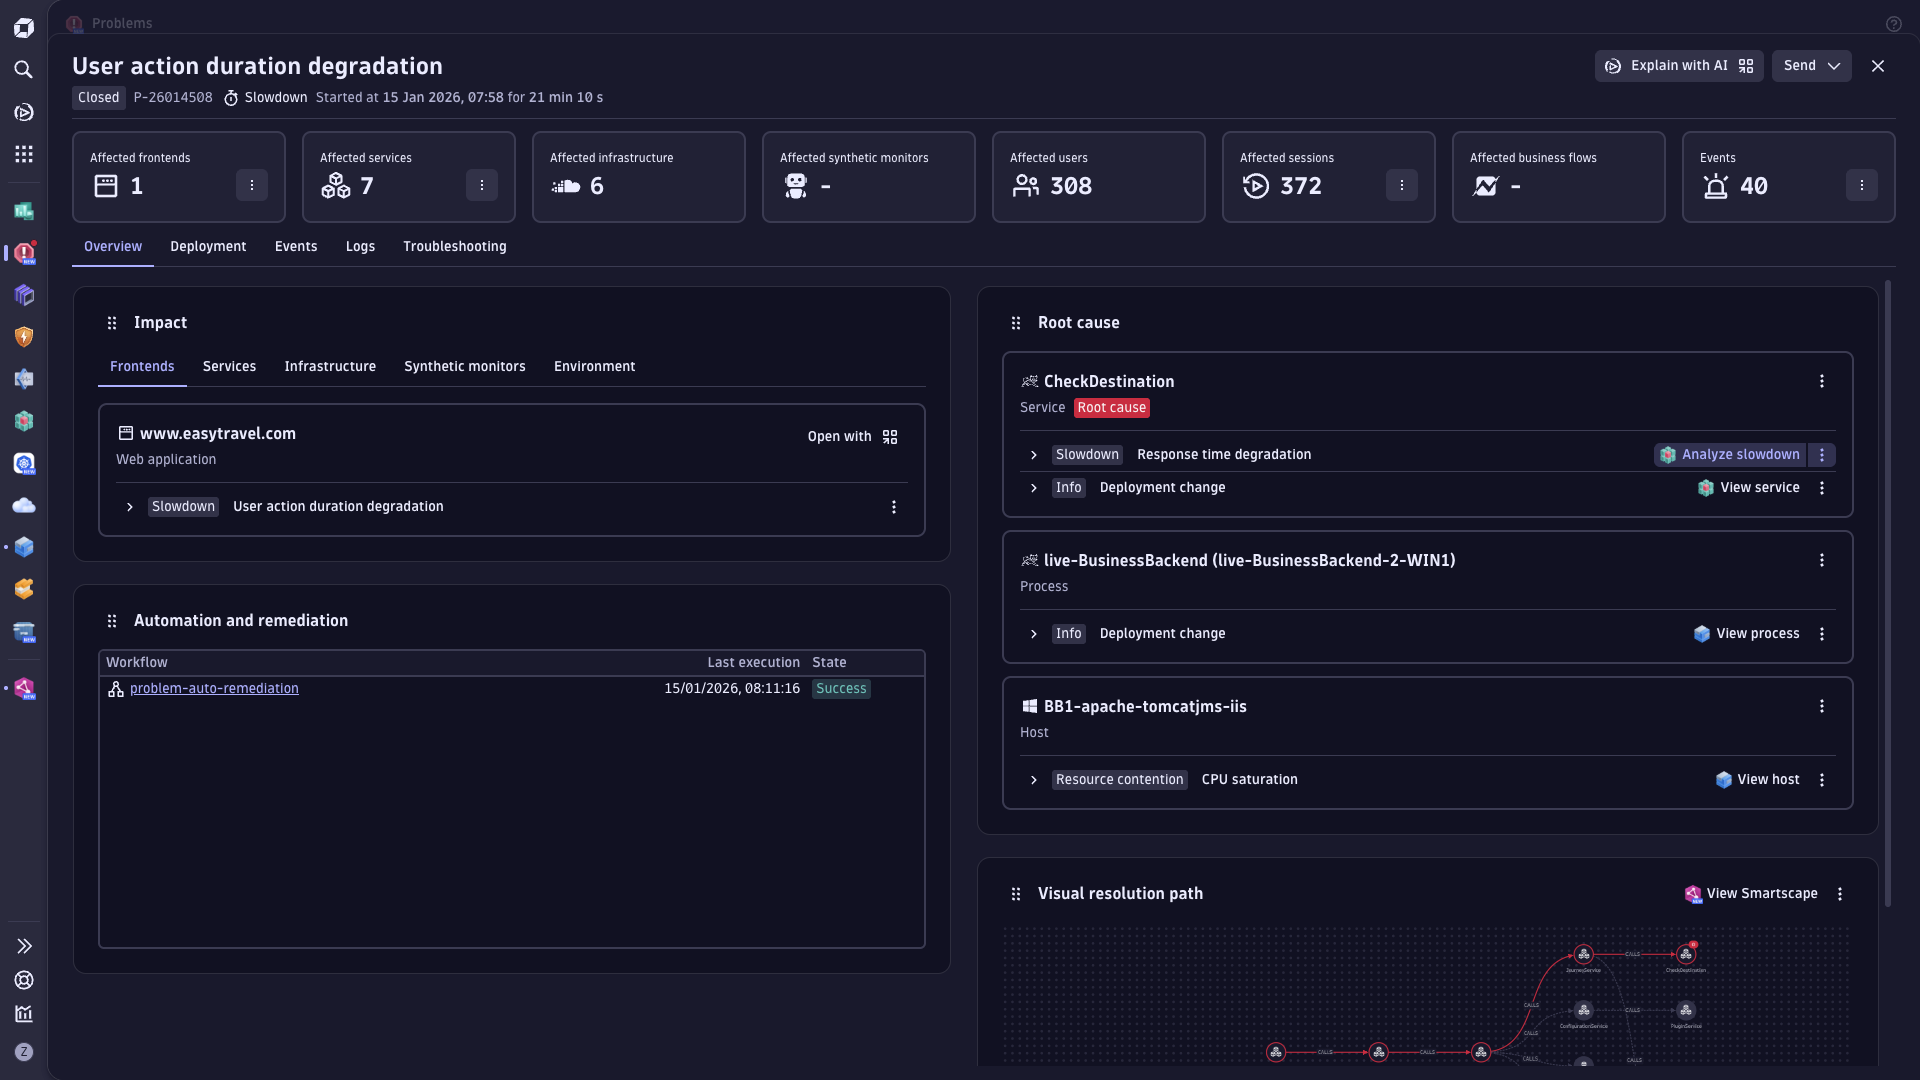
Dynatrace Intelligence continuously monitors your infrastructure and cloud environments, cutting major outages and degradations by up to 60% and MTTR by 90%. Your team spends less time triaging noise and more time on work that moves the needle.
Close the loop from detection to fix, automatically
Dynatrace AutomationEngine connects directly to your incident management and automation tools to trigger remediation, open tickets, and update your CMDB without anyone being paged at 2 AM for something the platform can resolve itself.

Context is built in. No manual correlation needed.
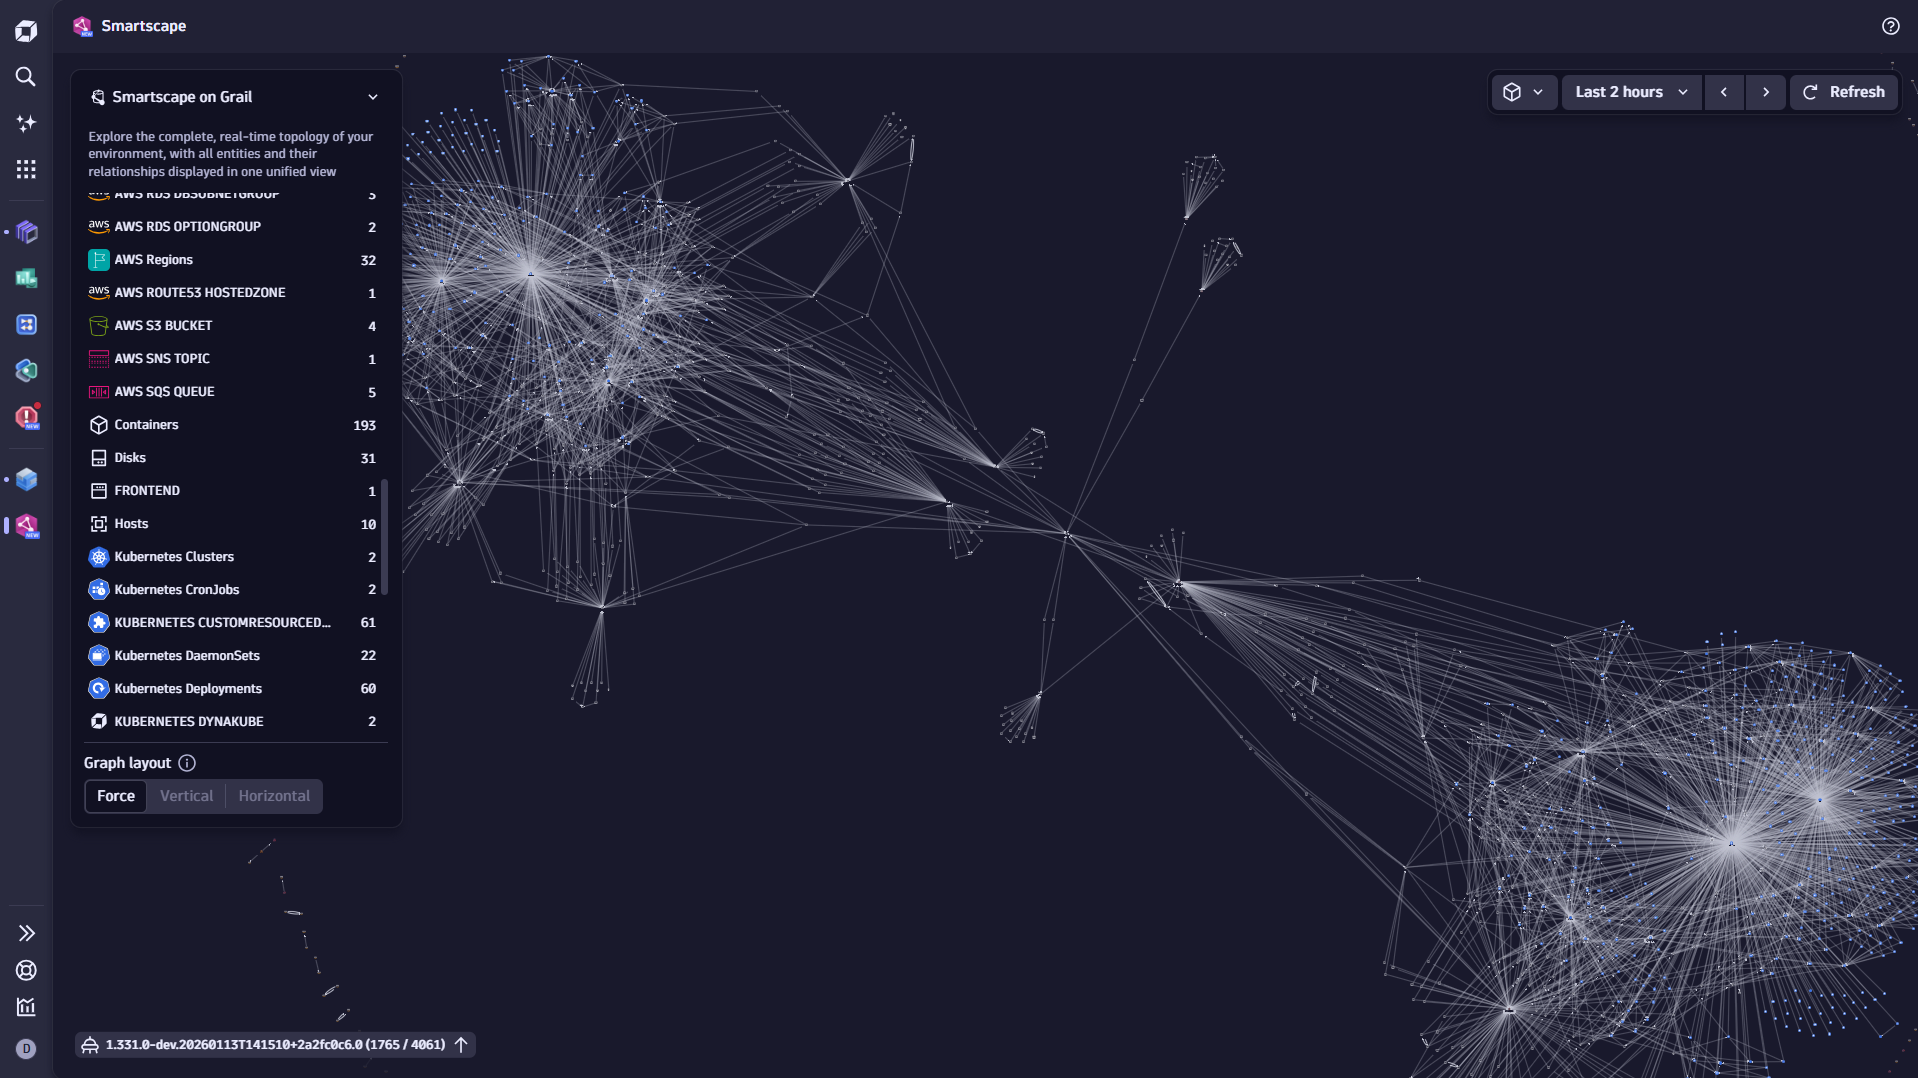
Dynatrace Grail automatically retains the relationships between your ingested data, so logs, traces, and events are connected without tagging schemes or manual stitching. Root cause analysis is explainable and instant, not a guessing game.





Infrastructure Observability FAQs
Dynatrace Infrastructure Observability provides continuous discovery and monitoring across hosts, virtual machines, containers, networks, servers, cloud platforms, and events and logs. The platform automatically visualizes dynamic environments — including on-premises infrastructure, virtualized systems, and cloud-native workloads — so IT operations teams maintain a unified, real-time view without manual inventory management. Coverage spans the full infrastructure stack, from bare-metal servers through to containerized microservices running on Kubernetes.
Dynatrace Infrastructure Observability is built for hybrid and multi-cloud architectures. The platform delivers unified end-to-end observability across on-premises infrastructure and all major cloud environments in a single pane of glass, eliminating the data silos that emerge when teams rely on separate, cloud-specific monitoring tools. This unified approach supports efficient modernization without requiring organizations to replace cloud-native instrumentation they already use.
Dynatrace Infrastructure Observability delivers automatic discovery and visibility into Kubernetes clusters, nodes, and containerized workloads without any manual configuration required. KeyBank, for example, relies on Dynatrace specifically for Kubernetes visibility across its environments. Dynatrace was recognized as a Leader in the GigaOm Radar for Kubernetes Observability 2026, reflecting the platform's depth of coverage in dynamic container environments.
Dynatrace Infrastructure Observability uses Dynatrace Intelligence to continuously monitor infrastructure and surface explainable root cause analysis powered by AI, rather than surfacing raw alerts that require manual triage. Customers have reported AI-powered insights boosting team productivity by up to 40%, reducing major outages and degradations by up to 60%, and cutting mean time to resolution (MTTR) by up to 90%. These results reflect the platform's focus on answering the "why" behind incidents, not just detecting that something is wrong.
Dynatrace Infrastructure Observability includes AutomationEngine, which integrates with existing automation platforms and incident remediation tools to enable auto-remediation workflows. When an issue is detected, the platform can automatically create tickets, trigger remediation runbooks, and update the CMDB in real time, reducing the manual handoff steps that slow incident resolution. This allows IT operations teams to move from reactive incident response toward proactive, automated operations.
Grail is the Dynatrace data lakehouse that powers log ingestion and analytics within Dynatrace Infrastructure Observability. Unlike traditional log management tools that require predefined schemas or tiered storage hierarchies, Grail ingests logs without schemas, retains full data context automatically, and correlates logs to traces without manual tagging. This architecture delivers maximum data fidelity and analytics speed at the lowest cost, replacing hours of correlating and tagging with automatic contextual linkage.
Dynatrace Infrastructure Observability ingests, stores, and analyzes logs natively through Grail-powered log management, with no schemas to define and no storage tiers to configure. Grail automatically retains the context of ingested log data and contextualizes logs to traces, giving infrastructure teams high-fidelity analytics without the overhead of manual correlation. This replaces the need for separate log management tooling and eliminates the data silos that form when logs, metrics, and traces live in disconnected systems.
Dynatrace Infrastructure Observability is designed to deliver maximum data context and fidelity at the lowest cost, replacing fragmented tools and disparate data pipelines with a unified platform. Grail-powered logs remove the cost drivers associated with schema management, reindexing, and storage tiering that inflate bills in legacy observability stacks. The consolidation of monitoring across hosts, containers, cloud, and networks into a single platform also removes redundant tooling spend that accumulates when organizations rely on multiple point solutions.
Dynatrace Infrastructure Observability is deployed through the Dynatrace platform, which supports automated instrumentation across hybrid and cloud environments. The platform can be extended through its open API framework and the Dynatrace Hub, which offers hundreds of turnkey extensions for integrating third-party infrastructure, cloud services, and automation tools. Organizations can also build custom applications on top of the platform, making it adaptable to specific infrastructure stacks and operational workflows.
Dynatrace was named a Leader in the GigaOm Radar for Kubernetes Observability 2026, an independent analyst assessment that evaluates platforms on depth of Kubernetes coverage, automation capabilities, and enterprise readiness. Customers including Virgin Money and INAIL rely on Dynatrace Infrastructure Observability to monitor their production environments, providing real-world validation alongside analyst recognition.