
Getting precise answers from log monitoring platforms gets challenging as cloud environments expand and grow more complex. Here are three log ingestion strategies to achieve scale in the Dynatrace platform—without OneAgent.
While many organizations have embraced cloud observability to better manage their cloud environments, they may still struggle with the volume of entities that observability platforms monitor. The key to getting answers from log monitoring at scale begins with relevant log ingestion at scale.
Engaging the automatic instrumentation of the Dynatrace OneAgent makes log ingestion automatic and scalable. However, our customers often have set up multiple other log ingestion methods. This flexibility enables logs from diverse environments and established configurations to complete the observability picture for automated troubleshooting and monitoring in Dynatrace.
In this blog, we share three log ingestion strategies from the field that demonstrate how building up efficient log collection can be environment-agnostic by using our generic log ingestion application programming interface (API).
As with all other log ingestion configurations, these examples work seamlessly with the new Log Management and Analytics powered by Grail that provides answers with any analysis at any time.
Log ingestion strategy no. 1: Welcome syslog, with the help of Fluentd
Syslog is a popular standard for transporting and ingesting log messages. Typically, these are streamed to a central syslog server. One option is to install OneAgent on that syslog server, which automatically discovers, instruments and sends the log data to the Dynatrace platform.
But there are cases where you might be limited in setting up a dedicated syslog server with OneAgent because of environment architecture or resources. Yet observability into syslog data on Dynatrace would help you monitor and troubleshoot infrastructure.
This is where it is prudent to configure syslog producers to send data to a log shipper like Fluentd.
What is Fluentd?
![]()
Fluentd is an open source data collector that decouples data sources from observability tools and platforms by providing a unified logging layer. Fluentd is known for its flexibility and is also highly scalable, which makes it a good choice for high-volume environments.
How does Fluentd work with Dynatrace?
Setting up the flow from syslog over Fluentd to Dynatrace takes three steps. First, point the syslog daemon to the Fluentd port by adding the following line to the syslog daemon configuration file:
*.* @@<fluentd host IP>:5140
*.* instructs the daemon to forward all messages to the specified Fluentd instance listening on port 5140 and <fluentd host IP> needs to point to the IP address of Fluentd.
As a second step, enable Fluentd to accept incoming syslog messages with the in_syslog plugin. Set up the configuration on the same port as specified for source data, in this example 5140.
Lastly, use the open source Dynatrace Fluentd plugin, which uses generic log ingestion. Just find the API token for log ingest API on your SaaS environment or your own Active Gate setup.
Now you should see log messages coming into the Dynatrace log viewer.
Log ingestion strategy No. 2: Point an existing log shipper to the generic Dynatrace ingest
Another common scenario is an environment where you have already invested a do-it-yourself or other log shipper solution. After spending time and budget on the tooling and configuration, it may be unwise to undo this custom work, despite the automatic instrumentation of the Dynatrace OneAgent. Although you preserve your custom work this way, it is a siloed approach for logs, which means you’ll miss out on the integrated observability and automated alerting of Dynatrace.
If that existing solution supports sending log data to an external HTTP endpoint, you can address log silos by integrating with Dynatrace generic ingest with minimal hassle.
To illustrate the solution, let’s look at how to configure log ingestion with the log shipper Cribl.
What is Cribl?

Cribl is a data operations platform that enables users to collect, route, transform, analyze, and act on data in real time. It provides a unified platform for handling every aspect of data operations, from collecting data to routing and transforming it. Cribl also allows users to orchestrate custom pipelines for their data to gain insights and take action on that information. As a data output, or what it calls a Cribl Stream destination, you can configure an HTTP endpoint.
How does Cribl work with Dynatrace?
The main part of the setup involves creating the configuration for the specific log shipper at hand—in this case, Cribl Stream.
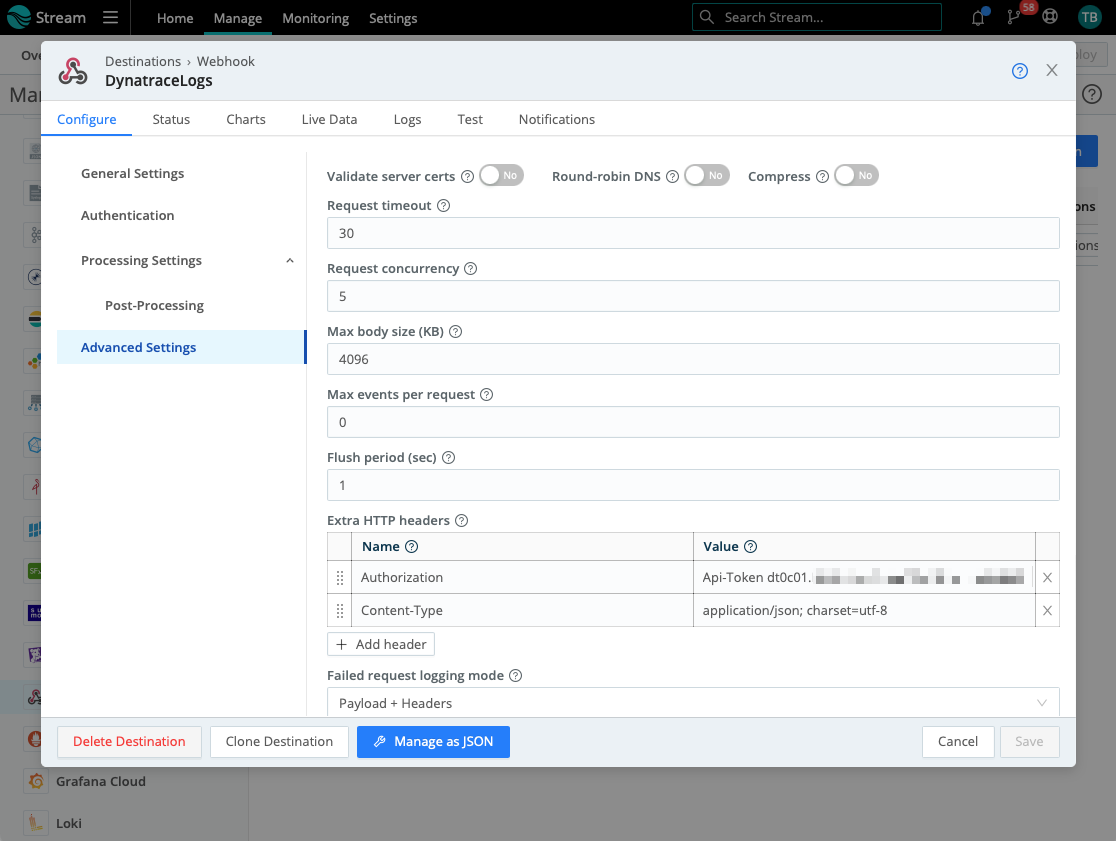
In Cribl’s configuration, open “Data/Destinations” and find “Webhook.” Create a new webhook destination with a name of your choosing (for example, your Dynatrace environment ID, and provide the URL for the webhook). For a Dynatrace SaaS environment, this is the following:
https://{your-environment-id}.live.dynatrace.com/api/v2/logs/ingest
This points the data stream to your Dynatrace environment’s generic ingest.
But in Cribl’s case, you should provide two more settings under “Configure/Advanced Settings/Extra HTTP Headers.” Add two new headers with the following names and values:
- To authorize the request, add the header “Authorization” and provide the value
Api-Token dt0c01.{your-token-here}where{your-token-here}is an API token with ingest logs scope. - Then add a header “Content-Type” and provide the value “
application/json; charset=utf-8“
After committing and deploying the Cribl changes, you can select the newly created Dynatrace destination as the default destination for your logs. And just like that, all log data already collected by the existing shipper is being sent to Dynatrace for monitoring, analysis, alerting, and all other tasks.
Log ingestion strategy No. 3: Ingest AWS Fargate logs with Fluent Bit
Ingesting and working with Kubernetes logs in Dynatrace helps to provide a comprehensive view of application performance from the infrastructure layer to the application layer. The common approach for Kubernetes logging is to deploy OneAgent in the environment, where it auto-discovers log messages written to the containerized application’s stdout/stderr streams.
But not all environments, configurations, or privileges are created equal. One recurrent challenge is collecting Kubernetes logs if you’re limited in installing OneAgent because of technical or architectural restrictions.
In the case of AWS serverless container compute engine Fargate, for example, where OneAgent log collection is not supported, we recommend using Fluent Bit log forwarder.
Let’s take this example of AWS Fargate. AWS includes a log router called FireLens for Amazon ECS and AWS Fargate services, which gives you built-in access to FluentD and Fluent Bit. We covered FluentD support previously. Now let’s take a look at how to set up Fluent Bit.
What is Fluent Bit?
![]()
Fluent Bit is an open source and multiplatform log processor and forwarder that allows you to collect data/logs from different sources, unify and send them to multiple destinations and is fully compatible with Docker and Kubernetes environments.
When choosing between Fluentd or Fluent Bit shippers, the Fluent Bit is the preferred solution when resource consumption is critical because it is a lightweight component.
While Fluent Bit has configurable HTTP output, in this example, we look at the AWS Fargate context, where FireLens makes it easy to set up Fluent Bit more quickly.
Ingest AWS Fargate logs with Fluent Bit
When creating a new task definition using the AWS Management Console, the FireLens integration section makes it easy to add a log router container. Just pick the built-in Fluent Bit image.
Next, edit the container in which your app-generating logs are running. In the “Storage and Logging” section, select “awsfirelens” as the log driver.
The settings for the log driver should point to the log ingest API of your SaaS tenant. Note that you normally need to provide two headers for Fluent Bit: content type and authorization token. As FireLens supports only one header, you can pass the token as part of the URL. Your configuration for AWS FireLens should have the following:
- Name:
http - TLS:
on - Format:
json - Header:
Content-Type application/json; charset=utf-8 - Host:
{your-environment-id}.live.dynatrace.com - Port:
443 - URI:
/api/v2/logs/ingest?api-token={your-API-token-here} - tls.verify:
Off - Allow_Duplicated_Headers:
false - match:
* - json_date_format:
iso8601 - json_date_key:
timestamp
To avoid publishing the token in plaintext, use AWS Secrets Manager to manage the token.
As your application starts publishing logs, you can view them in Dynatrace.
Read more about streaming logs to Dynatrace with Fluent Bit from our documentation.
More methods for log ingestion
These are just some of the ways you can ingest logs into the Dynatrace platform without using OneAgent. You’ll soon have even more methods for log ingestion into Dynatrace, for example:
- Automated OpenTelemetry logs acquisition and processing
- Syslog endpoint in your environment as a component on a private ActiveGate
- Dynatrace Fluent Bit output plugin for out-of-the-box integration
Want to share your experiences with log ingestion? Head to the Dynatrace Community Feedback channel to share your thoughts with other users.
State of Log Management 2026
Download the report to explore benchmark data on how AI workloads are exploding log volume and costs, and why unified observability is now essential for reliable, trustworthy AI.


Looking for answers?
Start a new discussion or ask for help in our Q&A forum.
Go to forum