
Syslog is a standard protocol for system and network device monitoring. Integrating syslog into enterprise observability solutions is tricky due to its strict support and security patching requirements. The new Dynatrace OTel Collector distribution unlocks the power of syslog and open source community contributions with the power of Dynatrace support and the value of Dynatrace Grail™ to analyze log data from devices at scale.
Getting insights into the health and disruptions of your networking or infrastructure is fundamental to enterprise observability. Syslog is the go-to protocol that delivers infrastructure administrators, network engineers, and security team logs that tell them all they need to know about their systems’ delivery, performance, availability, and security.
Without syslog, you’re blind to what happens on your infrastructure
While syslog is a common way to gain insights into enterprise infrastructure operations, integrating it with other signals into an observability overview is often a painful experience.
Syslog is a protocol with clear specifications that require a dedicated syslog server. This is needed to collect messages across your systems because many different types of devices and applications can produce logs in the syslog format.
However, enterprise adoption at scale typically has much higher requirements for components than for supported features—components must have proper vendor support. Without vendor support, you’re betting your business on goodwill. Even for a supported component, delivering logs from applications and infrastructure to DevSecBizOps workflows requires significant manual configuration.
For example, a supported syslog component must support the masking of sensitive data at capture to avoid transmitting personally identifiable information or other confidential data over the network. Log batching, enrichment, transformation, log source distinction, and application offloading are also regular requirements.
As enterprise environments scale enormously, filtering and dropping data “at the edge” before transmission to a central collection point must be a supported option.
Compliance, retention, archiving, or data governance regulations often require multicasting logs from the original source to multiple destinations, like an observability platform with long-term log storage.
In the end, site reliability engineering (SRE) and security teams need to have data delivered via syslog to their observability platform, in the context of other data types.
Syslog will remain a proven log solution because without understanding why connections are dropped, server starts or stops, or which requests your firewall blocked, your organization runs like a ship where the captain on the bridge has no understanding of what’s going on at the lower levels of the ship. However the challenges in maintaining syslog in a cloud-native era create a maze of requirements that SRE teams and infrastructure administrators must navigate, often finding themselves maintaining multiple tools and components.
This increases the risk of multiple points of failure, adds overhead, and ultimately fractures observability overview with prolonged time needed to recover from potential outages.
Start monitoring syslog using OpenTelemetry under the Dynatrace umbrella of support
OpenTelemetry has been a rising star in the observability landscape and is often a preferred way to achieve end-to-end visibility with a vendor-agnostic footprint. Dynatrace has been a part of the OpenTelemetry journey for years and has contributed to its rise.
With the new Dynatrace OTel Collector distribution, we provide a streamlined and supported way to collect logs using the syslog protocol. This fills all the requirements enterprises have and makes it hassle-free to stream syslog to Grail data lakehouse integrating logs with other observability data.
The Dynatrace OTel Collector for syslog has numerous benefits. Our approach is to understand what components our customers need and value. We then integrate them with our observability platform and offer support, so you don’t have to worry about unsupported bugs or lack of ownership.
We also provide security updates and patches to critical vulnerabilities that may arise in the components. This alleviates the risk of open source components with unpatched vulnerabilities remaining open to exploitation long after they have been revealed.
Ultimately this combination of Dynatrace support and the OpenTelemetry standard gives you the best of both worlds—enterprise-grade software support with open source community contributions.
Dynatrace OTel Collector fits with your existing setup
The new Dynatrace OTel Collector fits nicely into your existing Dynatrace setup to bring in syslog data. Our existing log ingest API already supports your logs using the OpenTelemetry protocol, so you just need to deploy the collector and point your syslog producers to it.
To start using the Dynatrace OTel Collector, take the following steps:
- Generate an API token for the OTLP endpoint in your environment.
- Find our newly released Dynatrace OTel Collector, deploy it, and configure the exporter with your API key and environment ID.
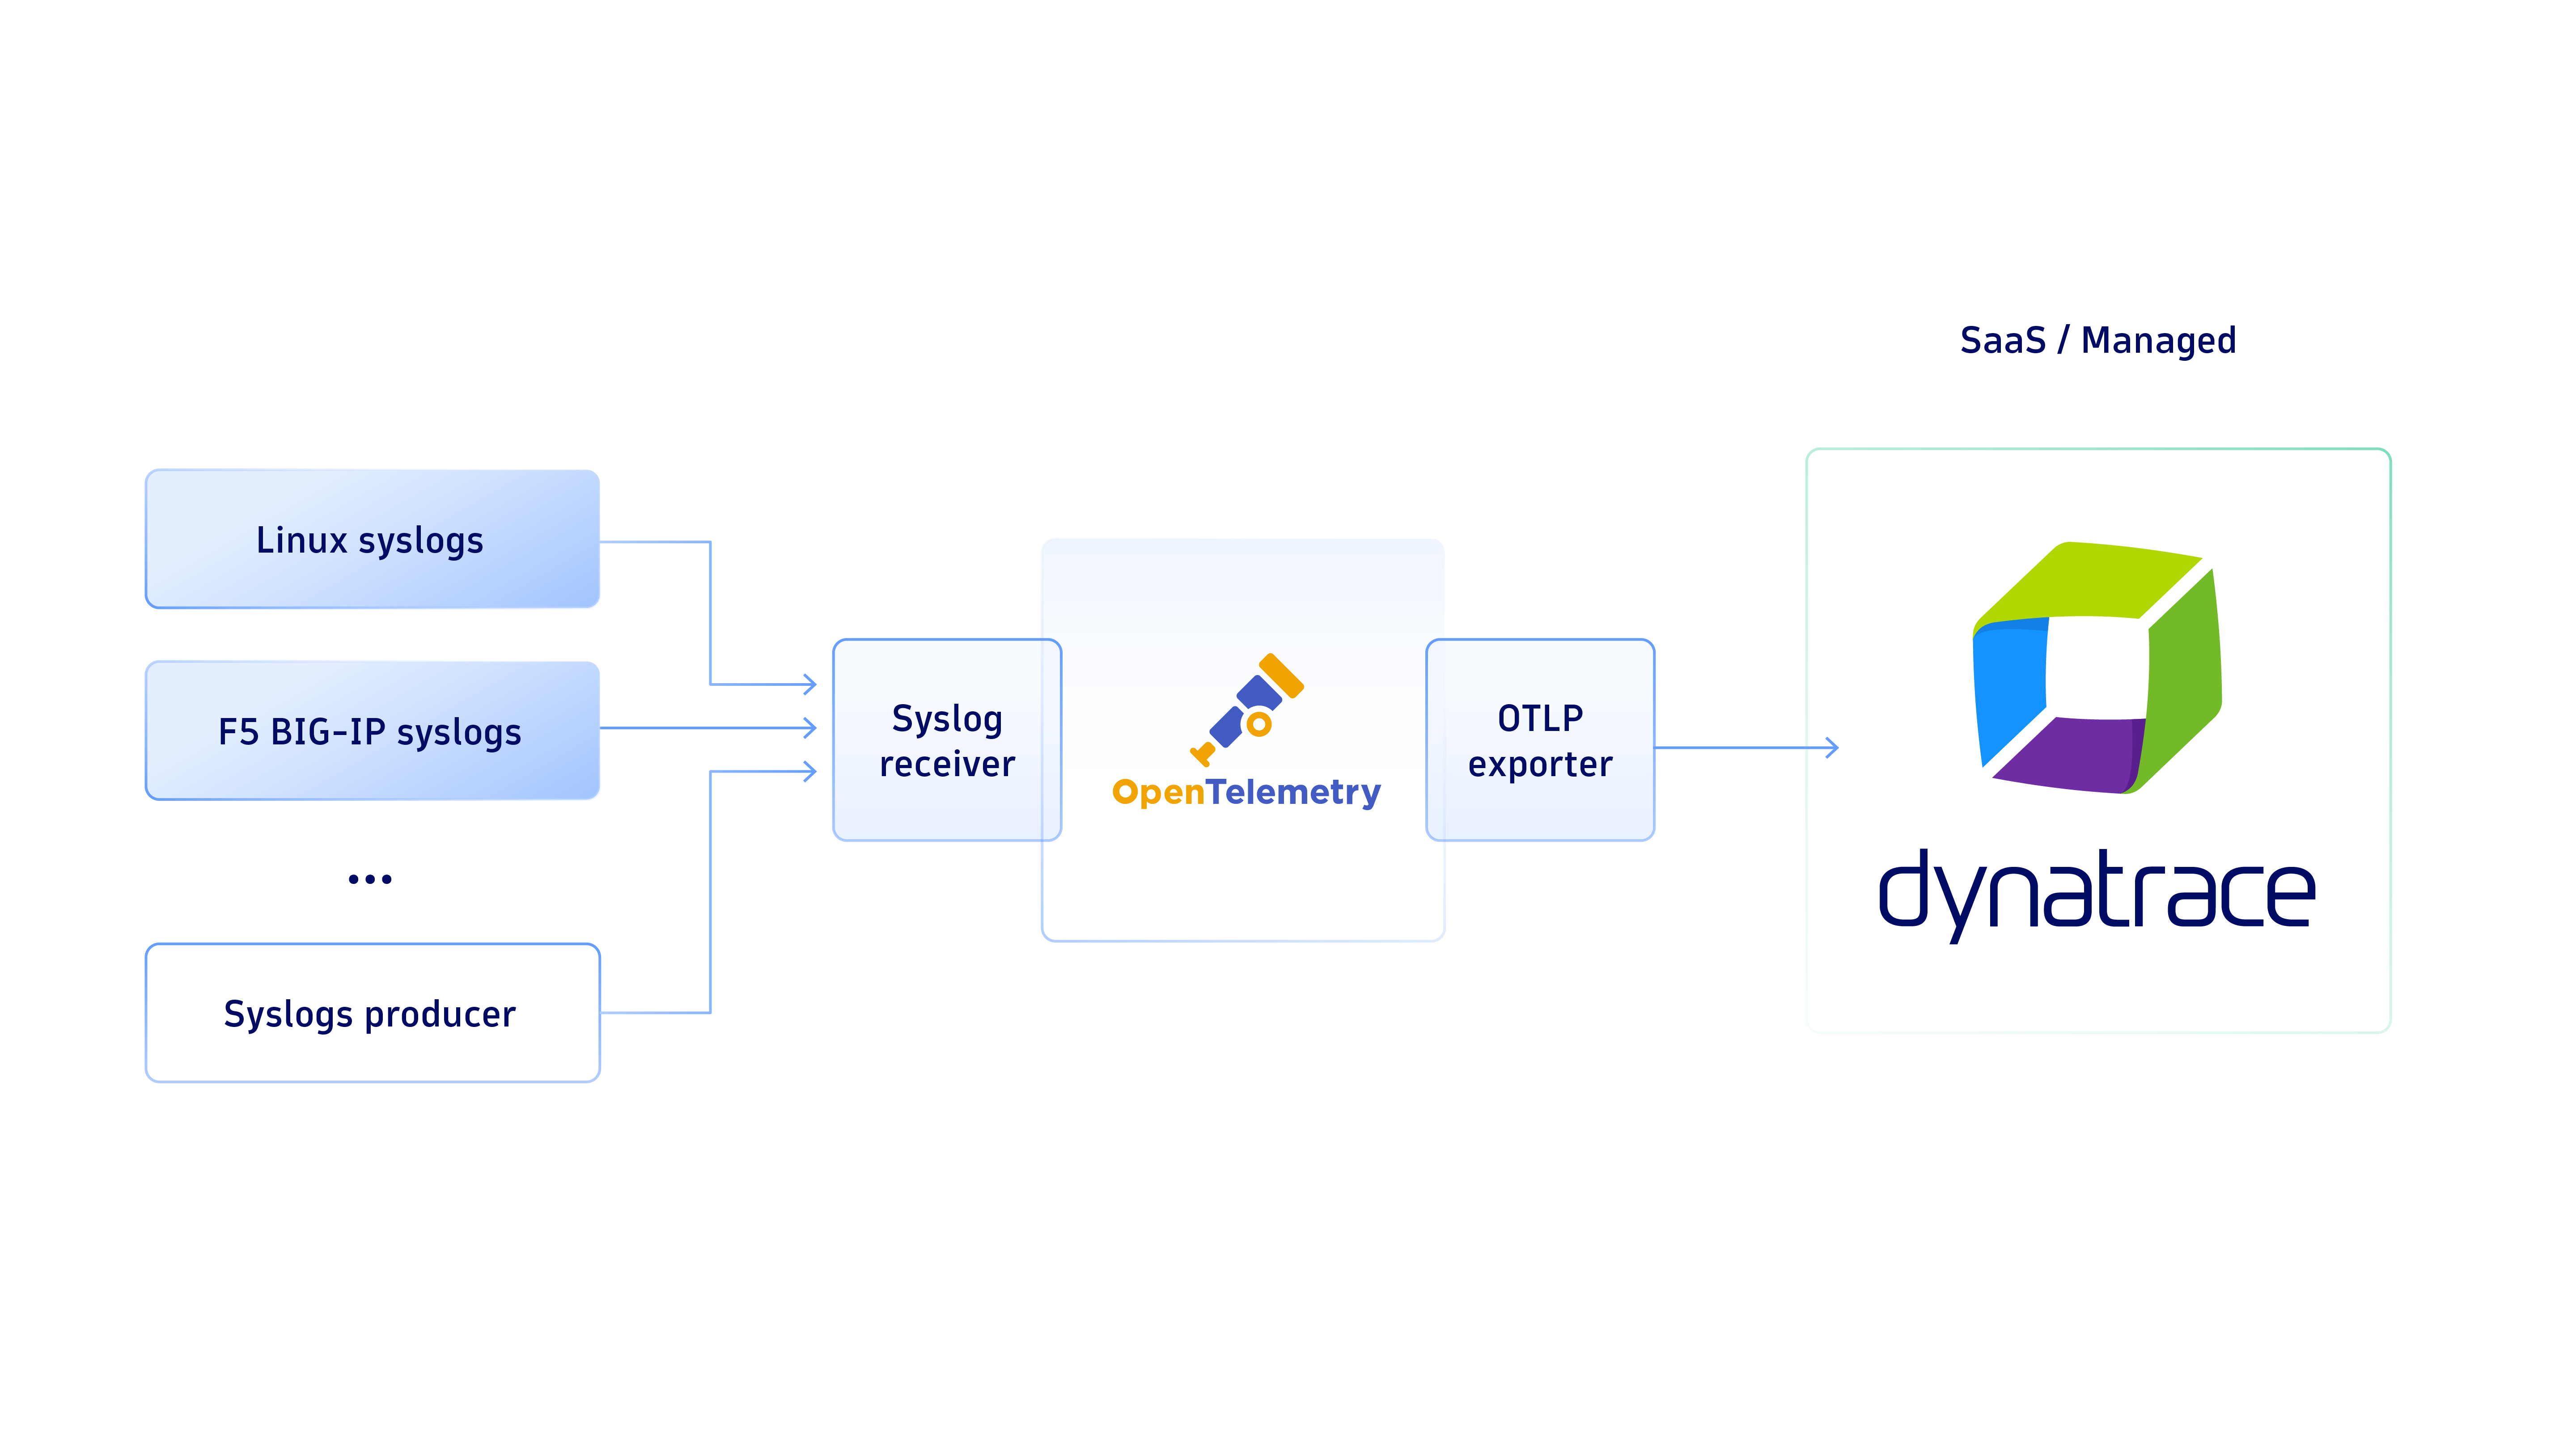
- Configure receivers to enable different log sources for your syslog producers.
- Point your syslog sources to the collector and you’re done!
This diagram explains how the components communicate with each other.
Take a look at this example for configuration. After generating an API token and deploying the collector, configure your instance. You need to configure each component (receiver, optional processor, and exporter) individually in a YAML file and enable them via pipelines. Follow the examples below or refer to Collector configuration documentation.
To point the exporter to your environment’s OTLP endpoint, add the following configuration:
exporters:
  logging:
    verbosity: detailed

  otlphttp/tenant_1:
    endpoint: "https://{your-tenant}.live.dynatrace.com/api/v2/otlp"
    headers:
      Authorization: "Api-Token {your-api-token}"
Next, you can add receivers to your collectors, for example, F5 BIG-IP systems to log to a remote syslog server (version 11.x-17.x). Refer to F5 BIG-IP documentation for detailed and up-to-date instructions regarding remote Syslog configuration. Take a look at Syslog (Dynatrace OTel Collector) in Dynatrace Hub for an example configuration file for the receiver, so you can enable two separate syslog endpoints for F5 and host syslogs. This allows you to differentiate log sources (attribute.device.type) for analysis in Dynatrace.
You can also make the Dynatrace OTel Collector multicast incoming syslog messages to multiple destinations. For example, you can set up exporters for your Dynatrace production environment and sandbox environment:
service:
  pipelines:
    logs:
      receivers: [syslog/f5, syslog/host]
      processors: [batch]
      exporters: [logging, otlphttp/tenant_1, otlphttp/tenant_2]
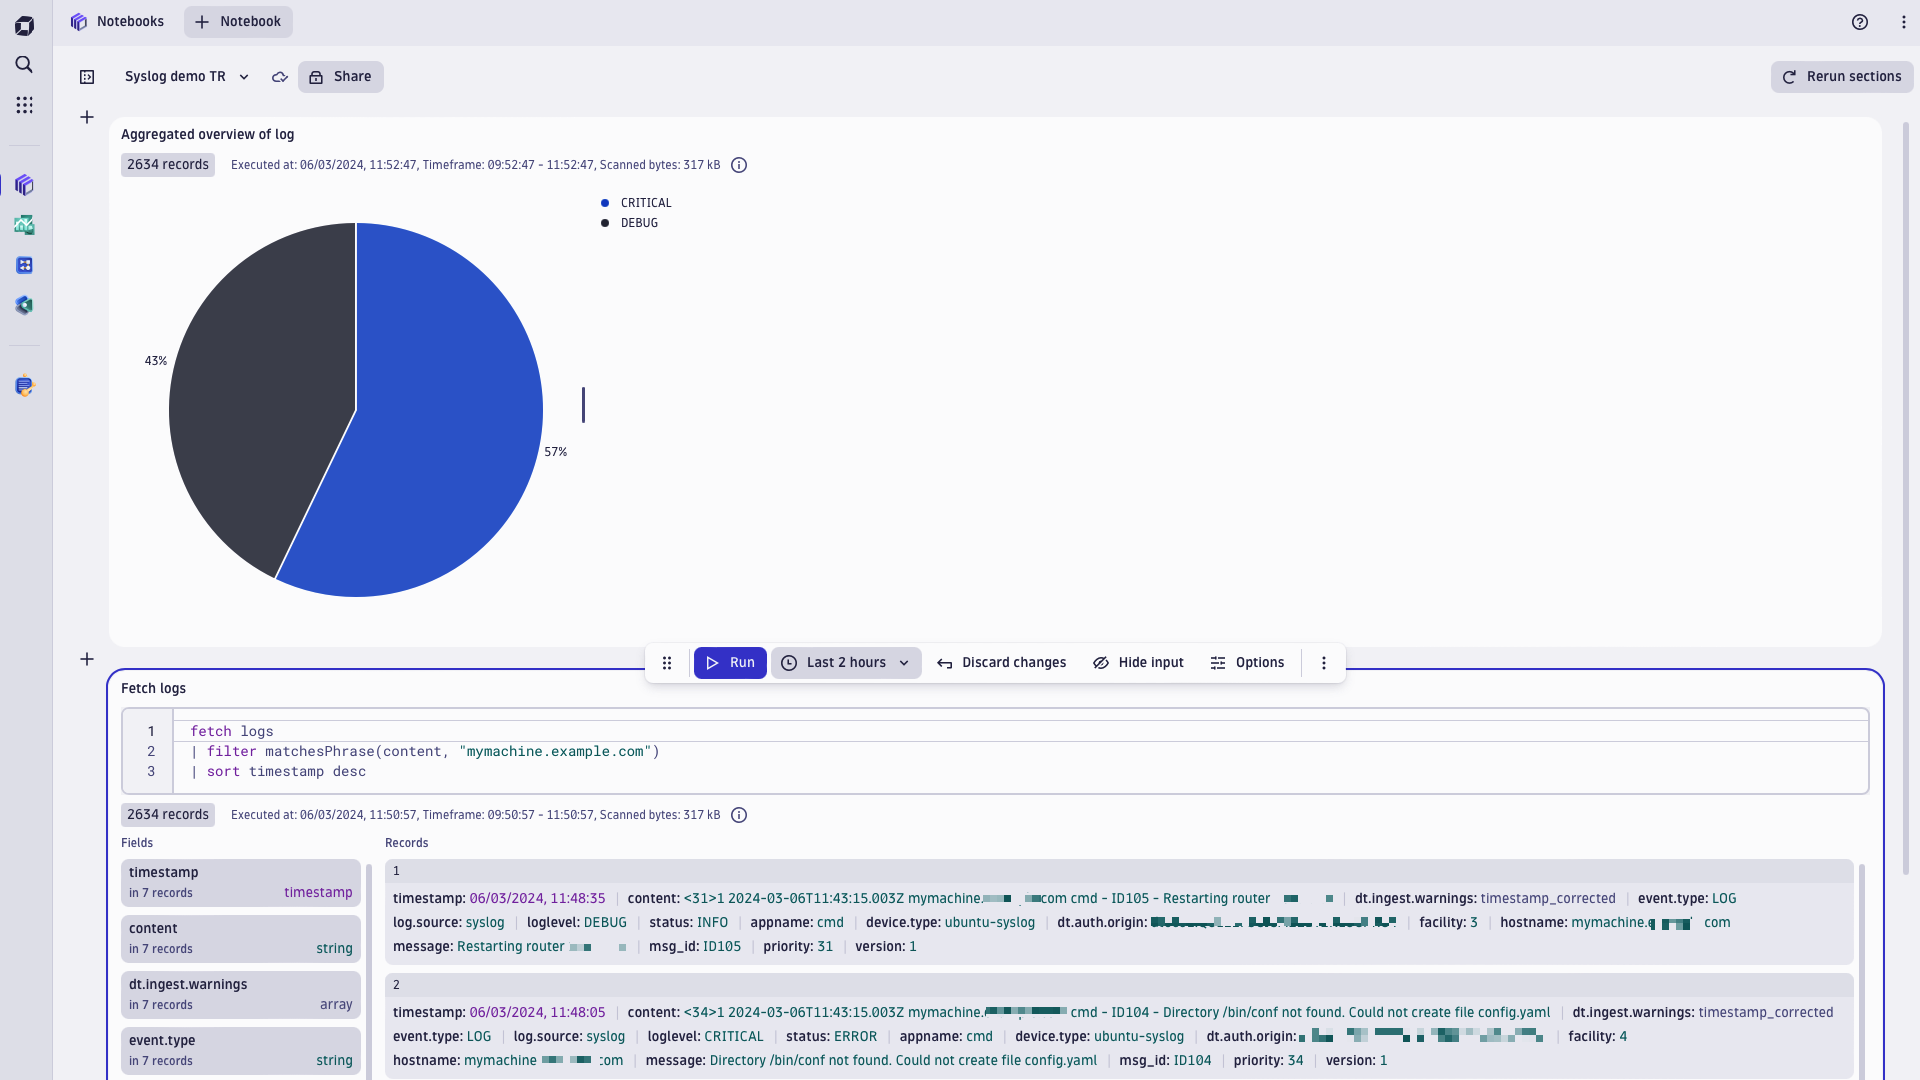
As a result, you should see logs in Dynatrace with corresponding log.source and device.type attributes:
Deploy Dynatrace OTel Collector for syslog now
- Go to Syslog (Dynatrace OTel Collector) in Dynatrace Hub to see examples and continue to the installation.
- Learn how to ingest syslog data into Dynatrace with this self-service Observability Lab.
- Dynatrace OTel Collector was released in Preview in January and is available generally from March 2024.
- Get more guidance for syslog configuration in documentation.
What’s next
- Stay tuned for direct syslog ingestion into Dynatrace, which brings syslog endpoints to an Environment ActiveGate, fully configurable from the cluster. This will enable you to use Dynatrace ActiveGate to ingest syslog data.
Go to Syslog (Dynatrace OTel Collector) in Dynatrace Hub to see examples and continue to the installation.


Looking for answers?
Start a new discussion or ask for help in our Q&A forum.
Go to forum