
With our newest extension, you can start monitoring your SNMP protocols and get automatic, intelligent observability for your network infrastructure.
While today’s IT world continues the shift toward treating everything as a service, many organizations need to keep their environments under strict control while managing their infrastructure themselves on-premises.
The monitoring challenges of on-premises environments
Such on-premises environments are usually large, typically consisting of thousands of hosts that are organized in physical data centers. All those hosts are then backed up by thousands of devices, such as routers, switches, load balancers, firewalls, etc. To keep infrastructure and bare metal servers running smoothly, a long list of additional devices are used, such as UPS devices, rack cases that provide their own cooling, power sources, and other measures that are designed to prevent failures.
As a Network Engineer, you need to ensure the operational functionality, availability, efficiency, backup/recovery, and security of your company’s network. But manual configuration of observability for systems like this is nearly impossible. Even if the initial setup could be completed successfully, keeping up with the constant changes would be next to impossible without automation.
SNMP collects and organizes information about your managed devices
Thankfully, most of the devices running in environments like these share their details through a standard protocol called SNMP. While not the newest protocol, SNMP is still actively used and popular. Each SNMP-enabled device provides access to its state and performance metrics in a simple and robust way that allows Dynatrace to fetch the metrics and run them through Davis®, our AI causation engine.
Dynatrace has long provided the option to create a custom extension that serves this use case. Our new extension framework now makes it a no-brainer to start monitoring your SNMP protocols.
Automatic observability for your SNMP-enabled devices
As you might know, we recently simplified observability for all custom metrics by making it possible to ingest hundreds of custom data sources into Dynatrace.
With the new extension framework, thanks to our API-first approach, there are no operations to be performed in the web UI. All functionality that we add to the Dynatrace platform starts with an API endpoint, so it becomes natural to automate that functionality in large-scale environments.
Moreover, with the new metric browser, you can easily list and filter available metrics, chart metrics, and view automated multidimensional analysis.
Now let’s explore what this means for you in detail:
OOTB dashboarding
SNMP extensions have their own dedicated dashboards that serve as an entry point and allow you to monitor the performance of your monitored environment. It’s easy to modify and adjust these dashboards as required, select the most important metrics, or just change the splitting of charts when too much data is presented.
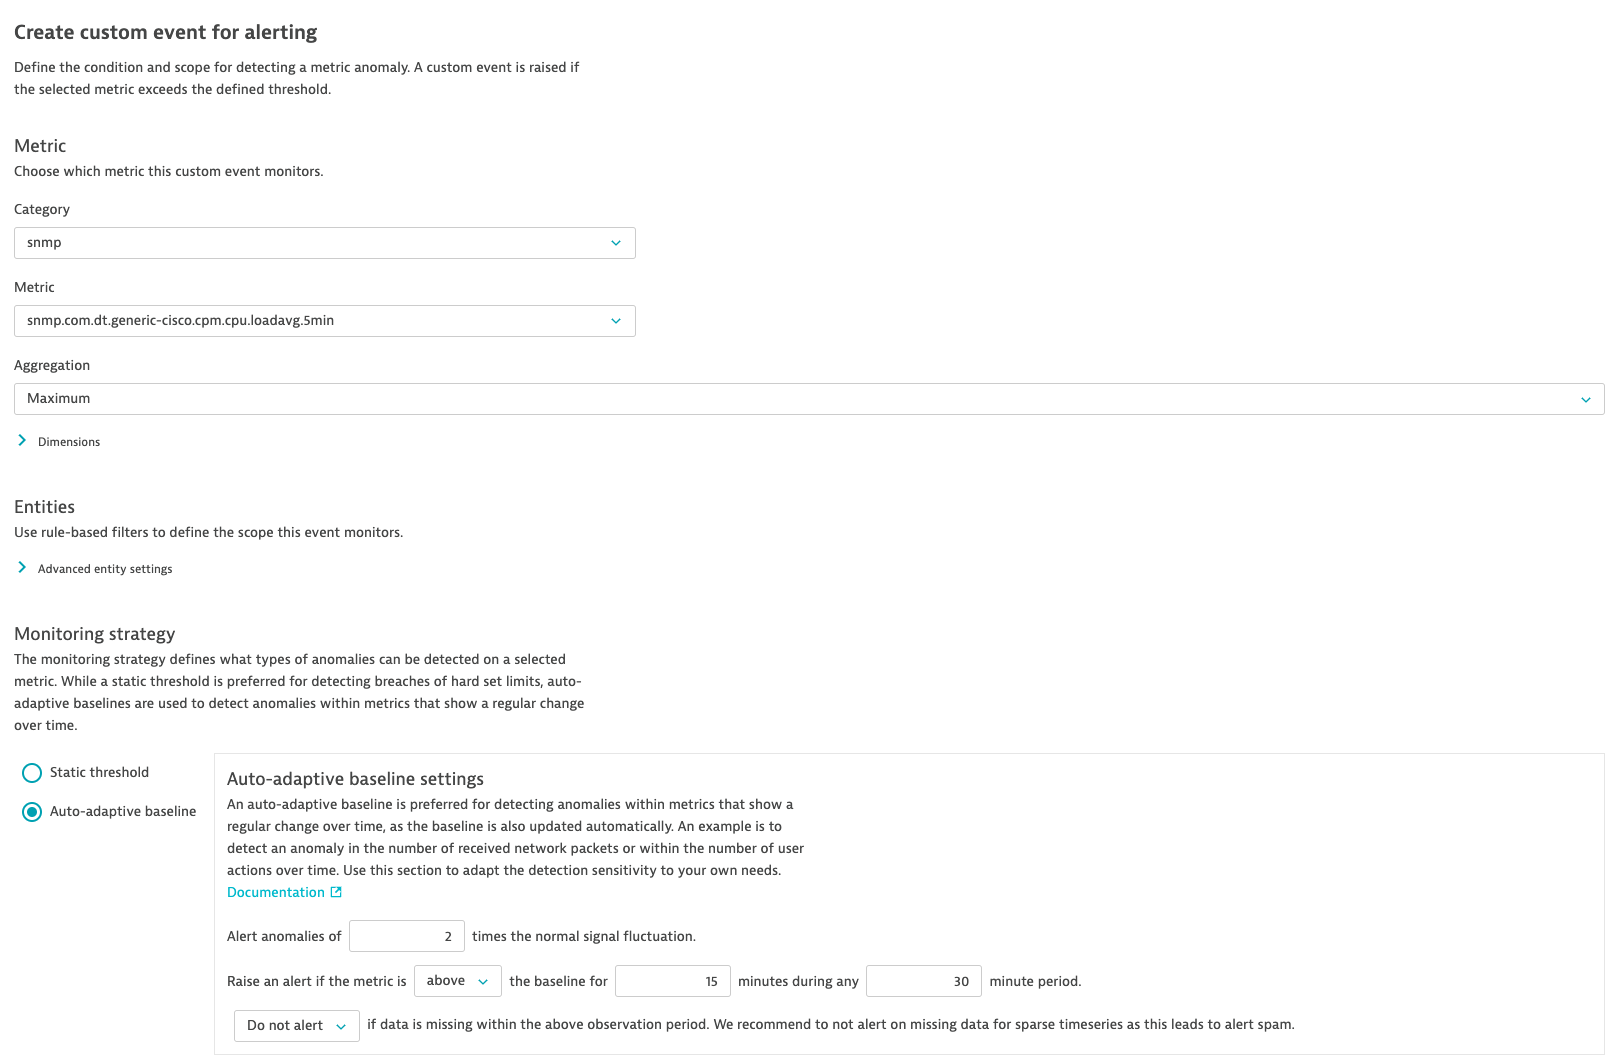
Events and alerts
For some devices to operate at peak performance, specific conditions must be fulfilled continuously. Exceeded throughput levels can be a sign that some changes to the network configuration might be required. In other cases, a specific temperature or humidity level must be maintained to avoid damage. Ideally, these variables are continuously monitored, which requires automation.
For such cases, SNMP extensions come with predefined alerting configurations. This means it’s no longer necessary to dig through technical specifications—the Dynatrace extension provider handles all this for you automatically.
Some SNMP-enabled devices are designed to report events on their own with so-called SNMP traps. This allows for almost instant notification as soon as an important event is reported. SNMP traps are often mandatory for keeping the reaction time as low as possible.
It’s essential to focus on those events that provide useful information or report potential device problems. Having those events reported to Dynatrace allows you to diagnose them easily, in context with all collected metrics, so you always have full visibility into device state.
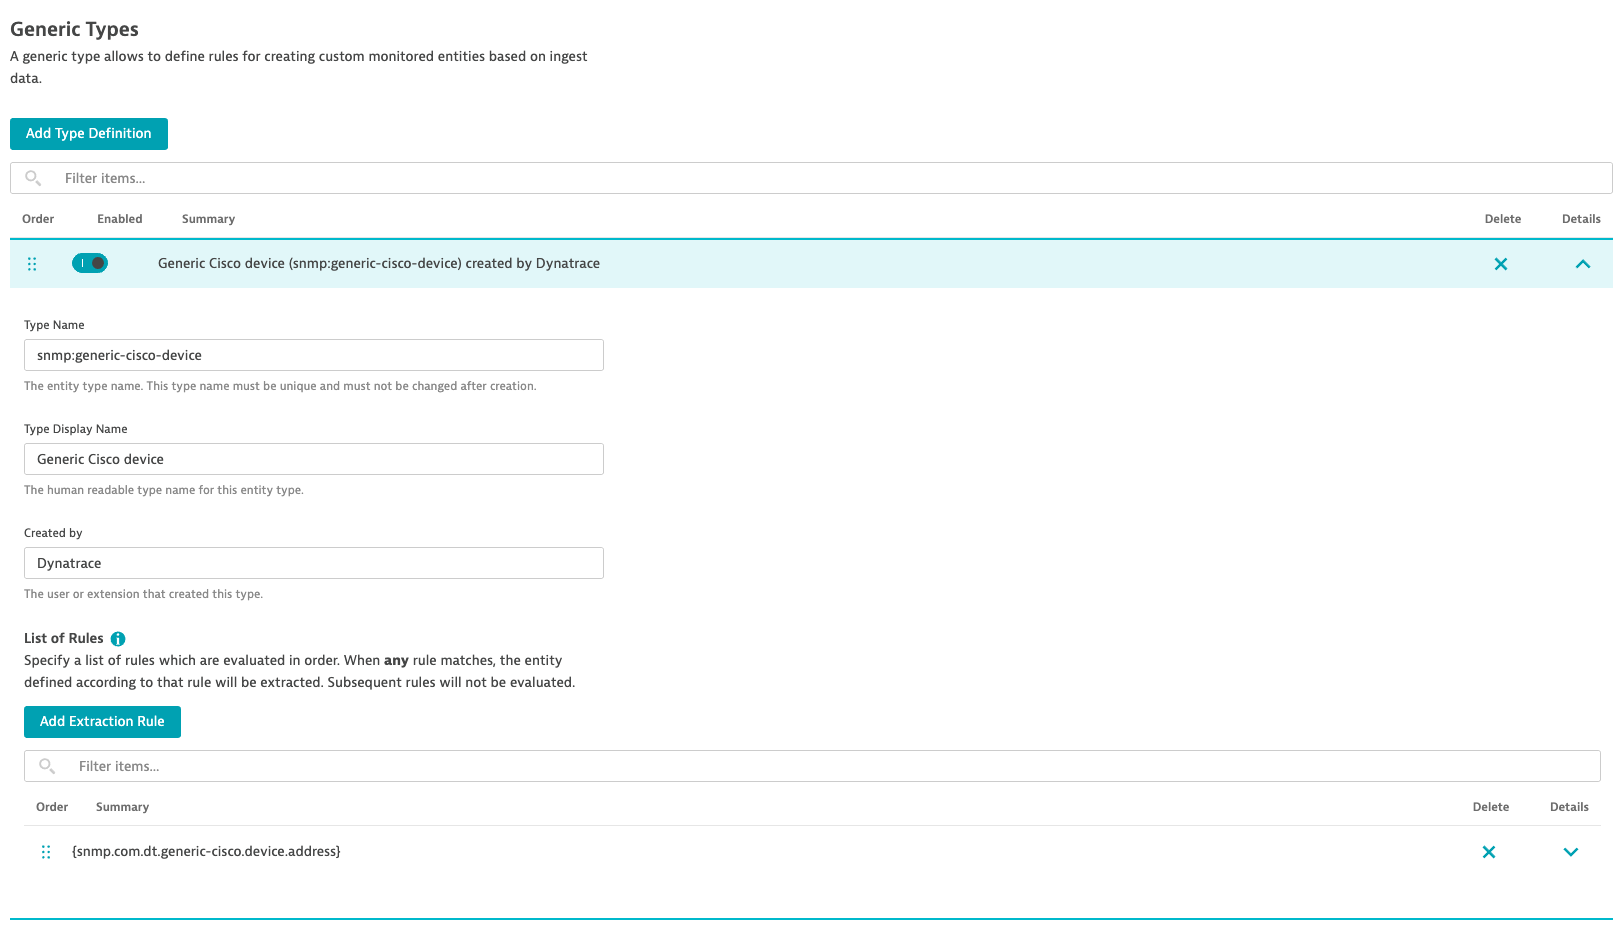
Model topological relations and dependencies
One of the main mantras we follow at Dynatrace is to “provide answers, not just data.” It’s always a challenge to work with immense amounts of data and condense it while still providing sufficient data to trigger quick reactions when necessary. This wouldn’t be possible without topology awareness. Analyzing relations and dependencies between all the elements responsible for a service (applications and services, processes, hosts, devices, etc.) is the key to providing accurate root cause analysis.
Based on monitored traffic, Dynatrace OneAgent is capable of automatic recognition of topological relations. This presents a problem for the monitoring of SNMP-enabled devices that don’t provide enough traffic for adequate analysis. A simple router usually consists of several interfaces and, so, doesn’t provide usable data that OneAgent can use to model the topology. Load balancers (such as F5), which are organized into virtual servers, pools, and pool members, can make it even more challenging to collect topology-relevant data.
To leverage Davis root cause analysis in such environments, extensions offer an embedded configuration that can be used to model a particular device topology. So once a problem is reported, Davis knows exactly what elements of your infrastructure might be impacted based on the embedded configuration.
SNMP observability
But that’s not the only scenario where you might find SNMP extensions to be useful. While we designed the framework to be capable of handling large-scale deployments, you might also find it useful for monitoring and managing additional generic devices with Dynatrace. For example, if you need your printer to raise an alert when the toner level is low, just create your own extension, deploy it in your Dynatrace environment, and monitor it.
A sneak peak
Our network-device monitoring solution will ultimately provide more than just SNMP extensions. We want Dynatrace to be the tool where you can find all the details you need, in a single place, and presented in a convenient and intuitive interface. This is why we’re already planning to extend the observability of network infrastructure by adding:
- Log monitoring configuration
- Management console integration
- Synthetic network monitoring
Give it a try!
Do you have a similar setup in your environment? Are you interested in a large-scale scenario, or do you just want to monitor a single device with Dynatrace?
With the initial release of SNMP extensions, targeted for May-June, the functionality will be somewhat limited. Your feedback will help us make Dynatrace SNMP extensions a top-notch solution as we continue developing it. We’re dreaming big, so we’ll need your involvement to make our dreams come true.


Looking for answers?
Start a new discussion or ask for help in our Q&A forum.
Go to forum