
With Dynatrace Extensions 2.0, you can easily extend the AI and automation core of Dynatrace and get zero configuration, automatic AI-driven alerting, and root cause analysis at scale for all your custom data.
These days, everything is about software. Complex IT systems make it possible to buy your favorite pair of jeans online, pay your bills, or help you navigate. These systems produce an unimaginably huge amount of data. If you run a digital business, you know that this data is priceless, as it describes how your users experience your digital service. By having a solution that automatically and precisely analyzes this data, you can guarantee that your customers have an amazing experience 24/7.
The Dynatrace Software Intelligence Platform analyzes data in an automated and scalable manner. A single OneAgent instance can handle the monitoring of many types of entities, including servers, applications, services, databases, and more. OneAgent gives you all the operational and business performance metrics you need, from the front end to the back end and everything in between—cloud instances, hosts, network health, processes, and services.
But what if a particular metric that’s crucial to your monitoring needs isn’t covered out of the box? For example, what if:
- Your IBM MQ queue manager is losing messages, and you don’t know why?
- Your SAP instance is slow, and you don’t know which transactions or users are affected?
- You want to optimize your Citrix landscape with insights into user load and screen latency per server?
Dynatrace Extensions 2.0 allow you to easily push metrics, events, or timeline series with metric data from any source to Dynatrace and seamlessly and automatically combine such data with all other existing data within Smartscape, our common topology data model.
What are Dynatrace Extensions
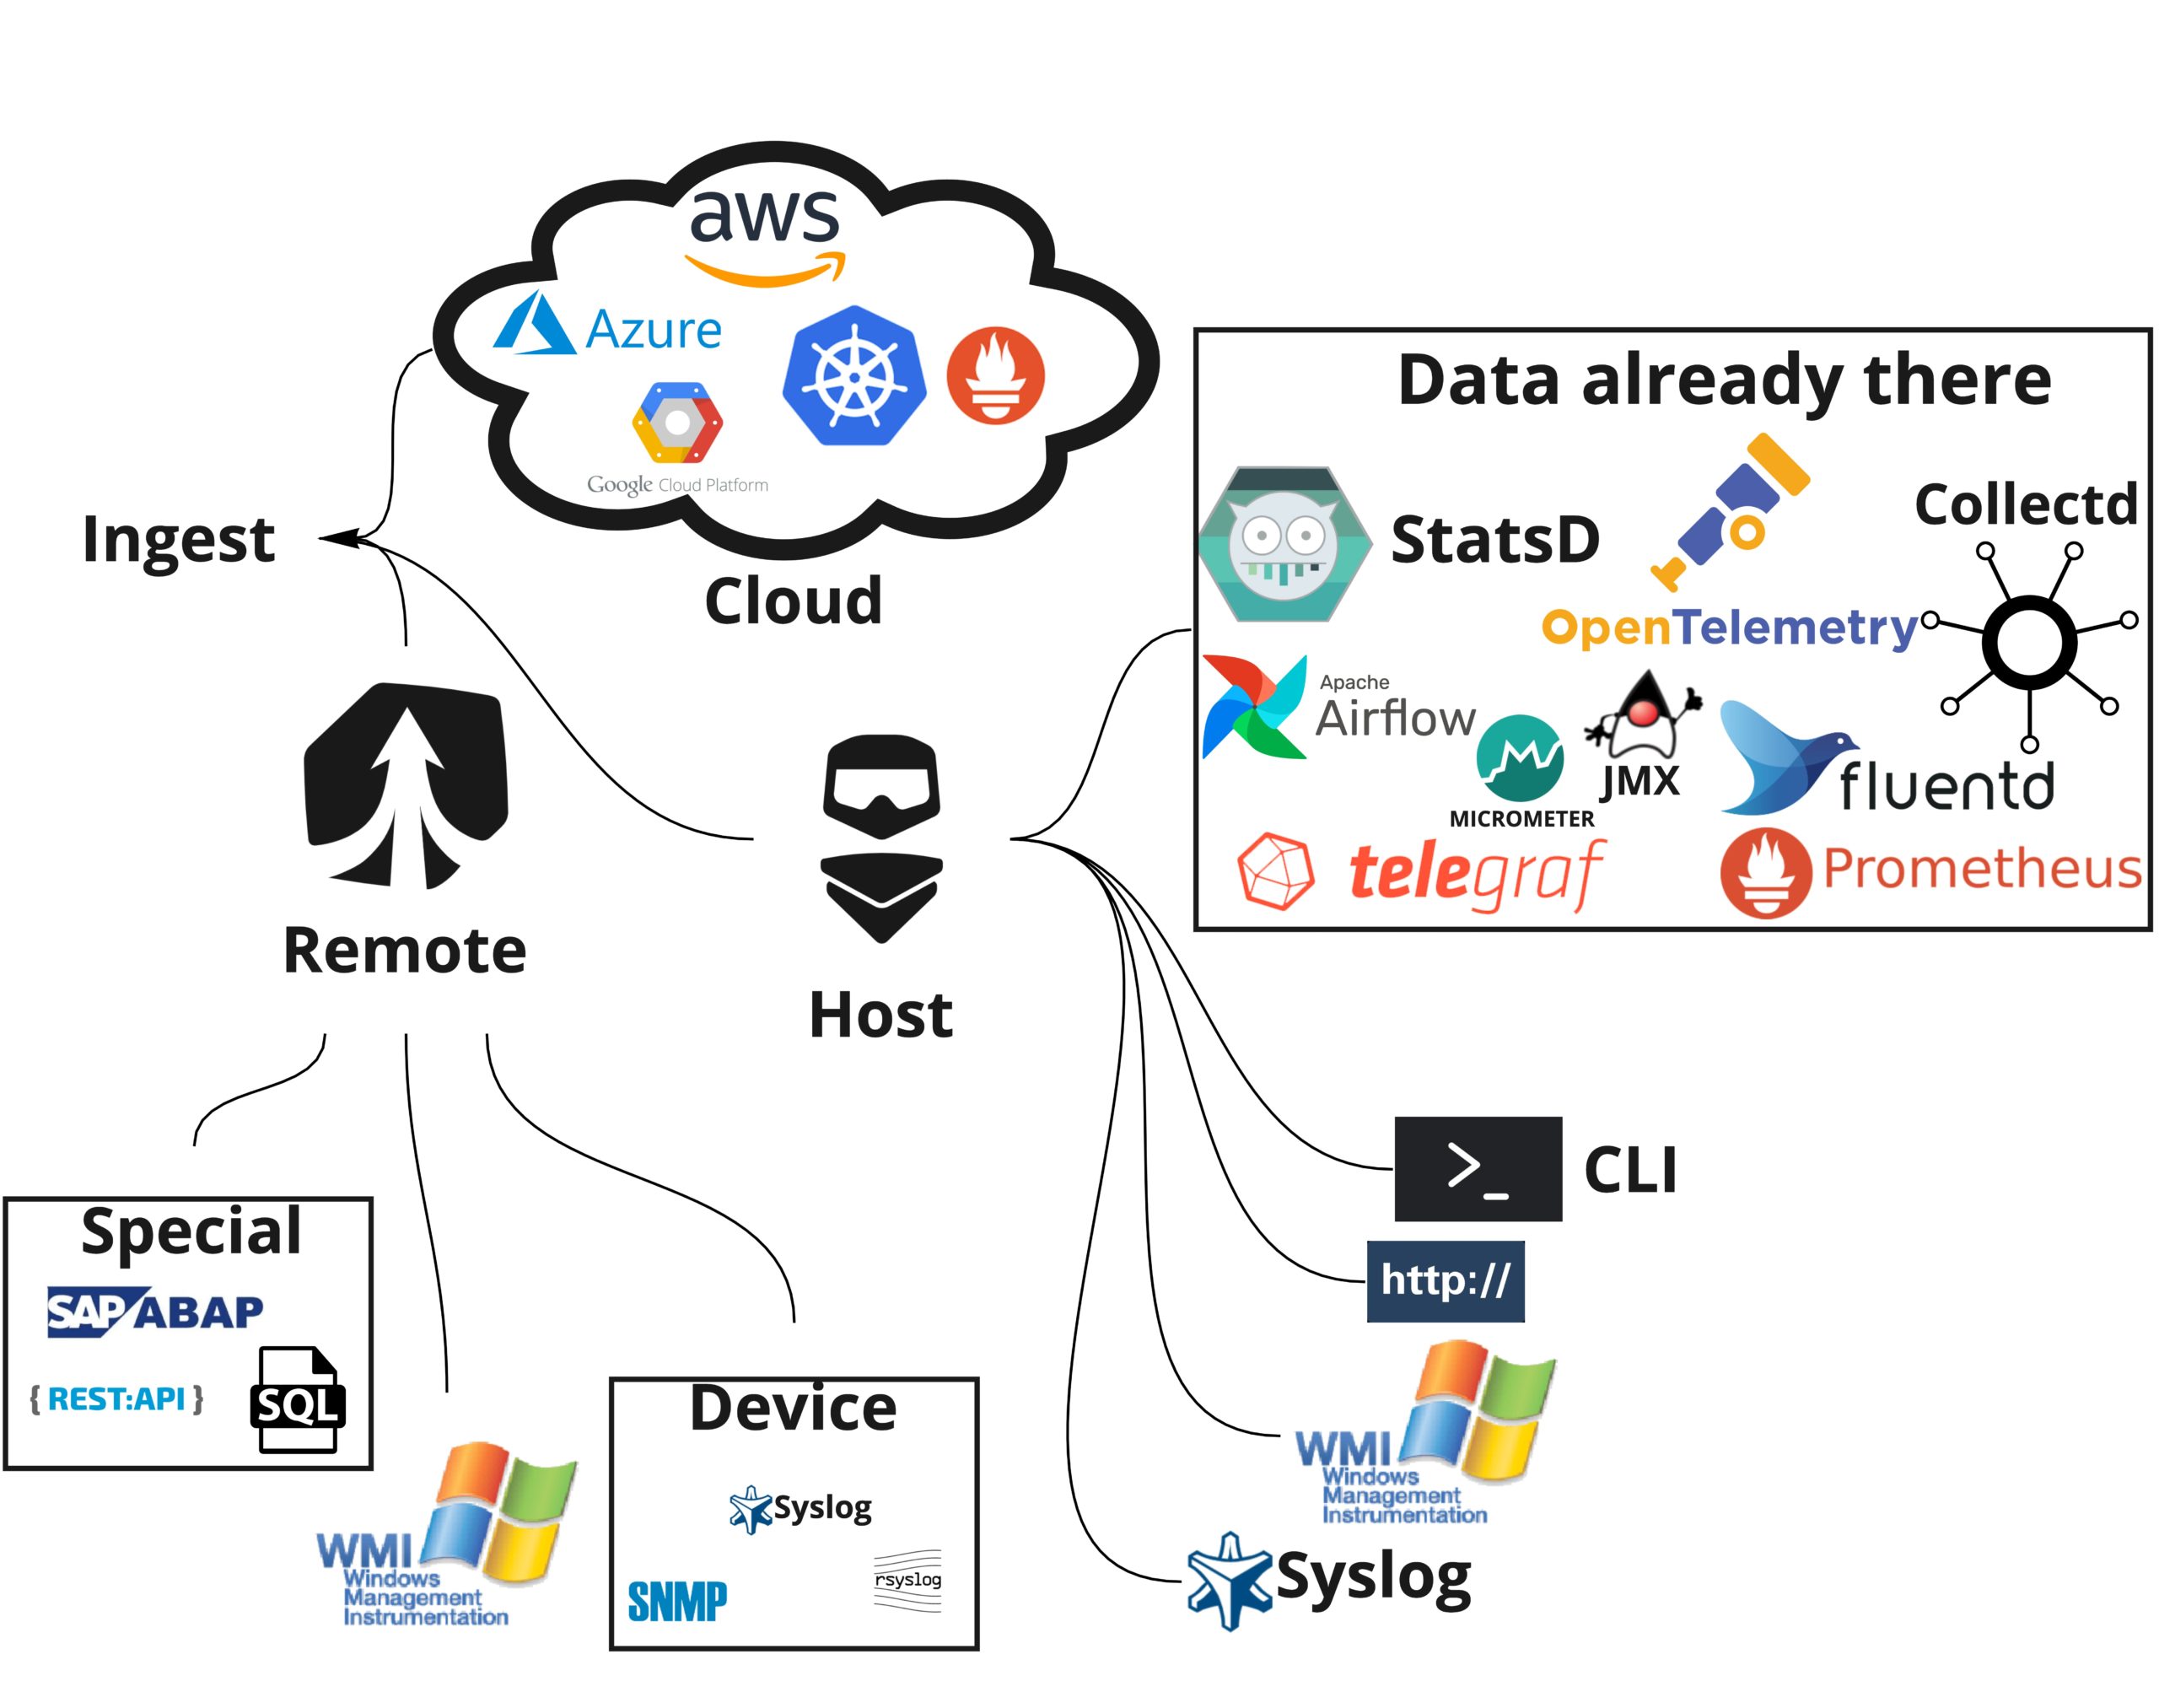
Dynatrace Extensions (formerly known as plugins) enable you to extend Dynatrace monitoring to any remote technology that isn’t covered by OneAgent out of the box. All the data bound to hosts is analyzed by the Davis® AI causation engine and made available on custom dashboards and events pages.
Why use Extensions
The additional data made accessible by Dynatrace Extensions means better visibility and an ability to act proactively. Dynatrace Extensions also lower your maintenance costs by enabling you to have one platform instead of many.
Ingesting data via open APIs vs. extensions—what’s the difference
Dynatrace also allows you to ingest data through public APIs. By using these APIs, you can add metrics, events, and logs. However, in order to build effective monitoring based on these APIs, you need to write, distribute, and deploy scripts. These custom scripts also include a lot of overhead: data security, failover protection, load balancing, and, most importantly, scheduling. As monitoring becomes more complicated at scale, the necessary monitoring maintenance tasks add up exponentially.
Additionally, we see more and more open frameworks such as Prometheus, OpenTelemetry, Fluentd, StatsD, or cloud technologies like CloudWatch being used and generating more and more data that needs to be ingested, analyzed, and made actionable.
The Dynatrace Extensions 2.0 advantage
Thanks to the declarative manner and the centralized and automated deployment and distribution of the new Dynatrace Extensions 2.0, you can now ingest data more easily at scale and derive the topological context along with the topology definition. We also give you more value than just metrics and events. So whether you want to…
- Start monitoring a new technology that is not yet covered by Dynatrace or
- Introduce a new configuration in your environment (for example, organize data in dashboards, create new alerts, introduce complex metrics),
…Dynatrace Extensions 2.0 are the new way to accomplish these goals and much more.
What’s new in 2.0
Having learned a lot from the first generation of extensions, we’ve made further improvements in the areas of ease of use, zero maintenance, democratized extensibility, and opening up the framework to all users.
Enrich your metrics with valuable context information
Extensions are mainly used to import data from previously unknown sources. This data might be in the form of metrics, events, or timeline series, with metric data coming from any source, be it a file, API, stream, database, or other. On its own, the data only gets you so far; you need context, especially topology, to actually make use of it. We’ve found out the hard way that enriching data with context, topology, dependencies, and relationships after ingestion via configuration or CMDBs does not scale well.
The new extensions framework makes the experience easier, allowing everyone to leverage the Dynatrace Davis AI to monitor their environments in a manner similar to other supported technologies.
Easy versioning and deployment
Whether you want to extend Dynatrace to monitor a new technology by deploying a new extension definition, configuring an existing extension, or distributing a new version of a previously deployed extension, the new extensions framework makes all use cases easier, faster, and, in the end, less of a burden.
Automated distribution
Distribution of extensions through enterprise environments can be complex. Typically, environments grow and change constantly, and containers bring new meaning to the word “dynamic.” In the past, it was sometimes necessary to copy a custom extension from host to host, either manually or with some custom automation that had to be maintained.
With Dynatrace Extensions 2.0, we’re not simply trying to reduce the cost of maintenance or distribution of extensions but, rather, completely eliminate it. The introduction of a central API allows the distribution of extensions to hosts that are authorized to run them.
Failover and load balancing
We want you to focus on your monitoring use cases while Dynatrace takes care of the rest.
Sometimes things break. But when something goes wrong while using the Extensions 2.0 framework, you don’t have to worry. Even if monitoring breaks, the framework automatically tries to execute it from a different source. Dynatrace also takes care of load balancing between the available ActiveGates during deployment.
Democratizing the extensibility
By saying that we want to democratize Dynatrace extensibility, we mean that we want to allow anyone to extend Dynatrace, regardless of their skill set or level of Dynatrace experience.
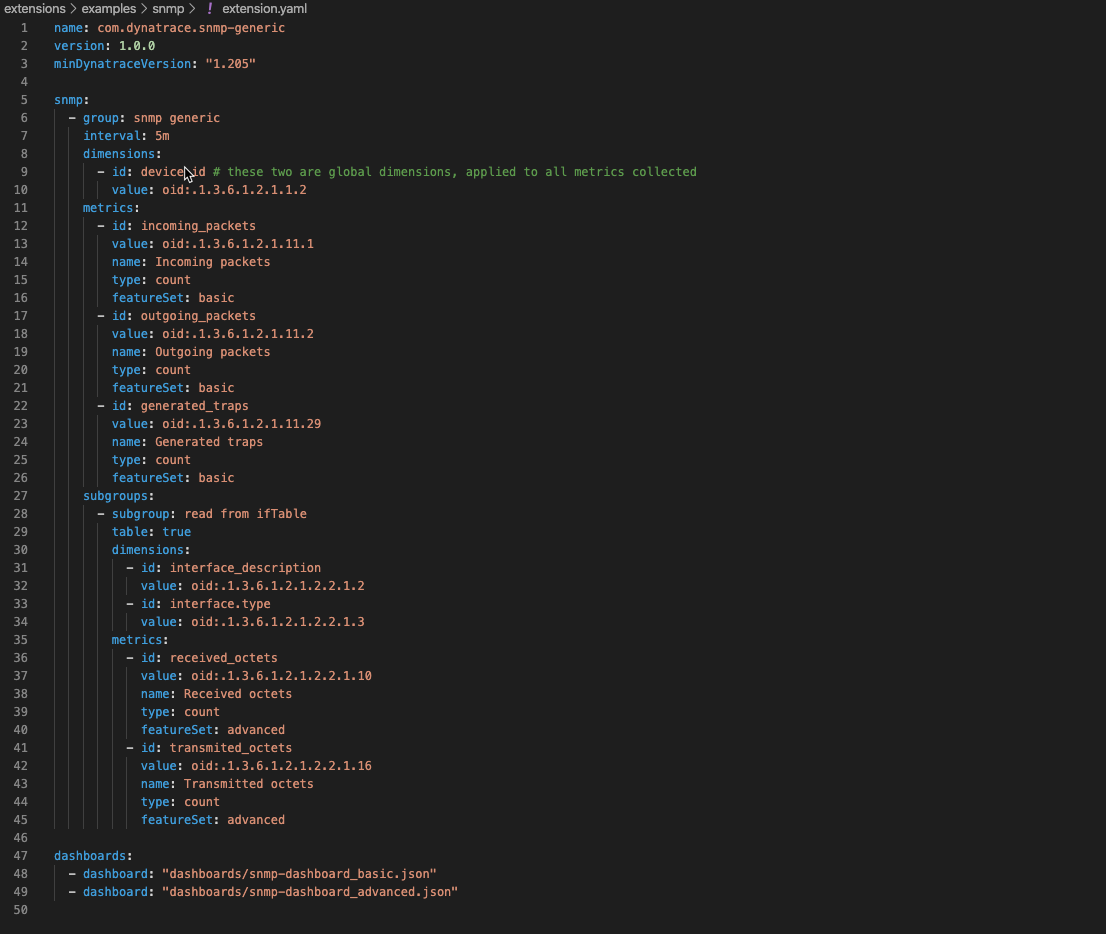
Imagine teams that are not yet familiar with Dynatrace contributing to the monitoring that your teams deliver. By introducing declarative extensions for network devices with SNMP or your Windows hosts with WMI, we’re taking the first steps towards codeless 2.0 extensions.
If you’ve ever used custom Dynatrace JMX extensions (previously known as plugins), you’ve already voted for declarative Dynatrace extensibility.
One place to rule them all
Well, two places actually…
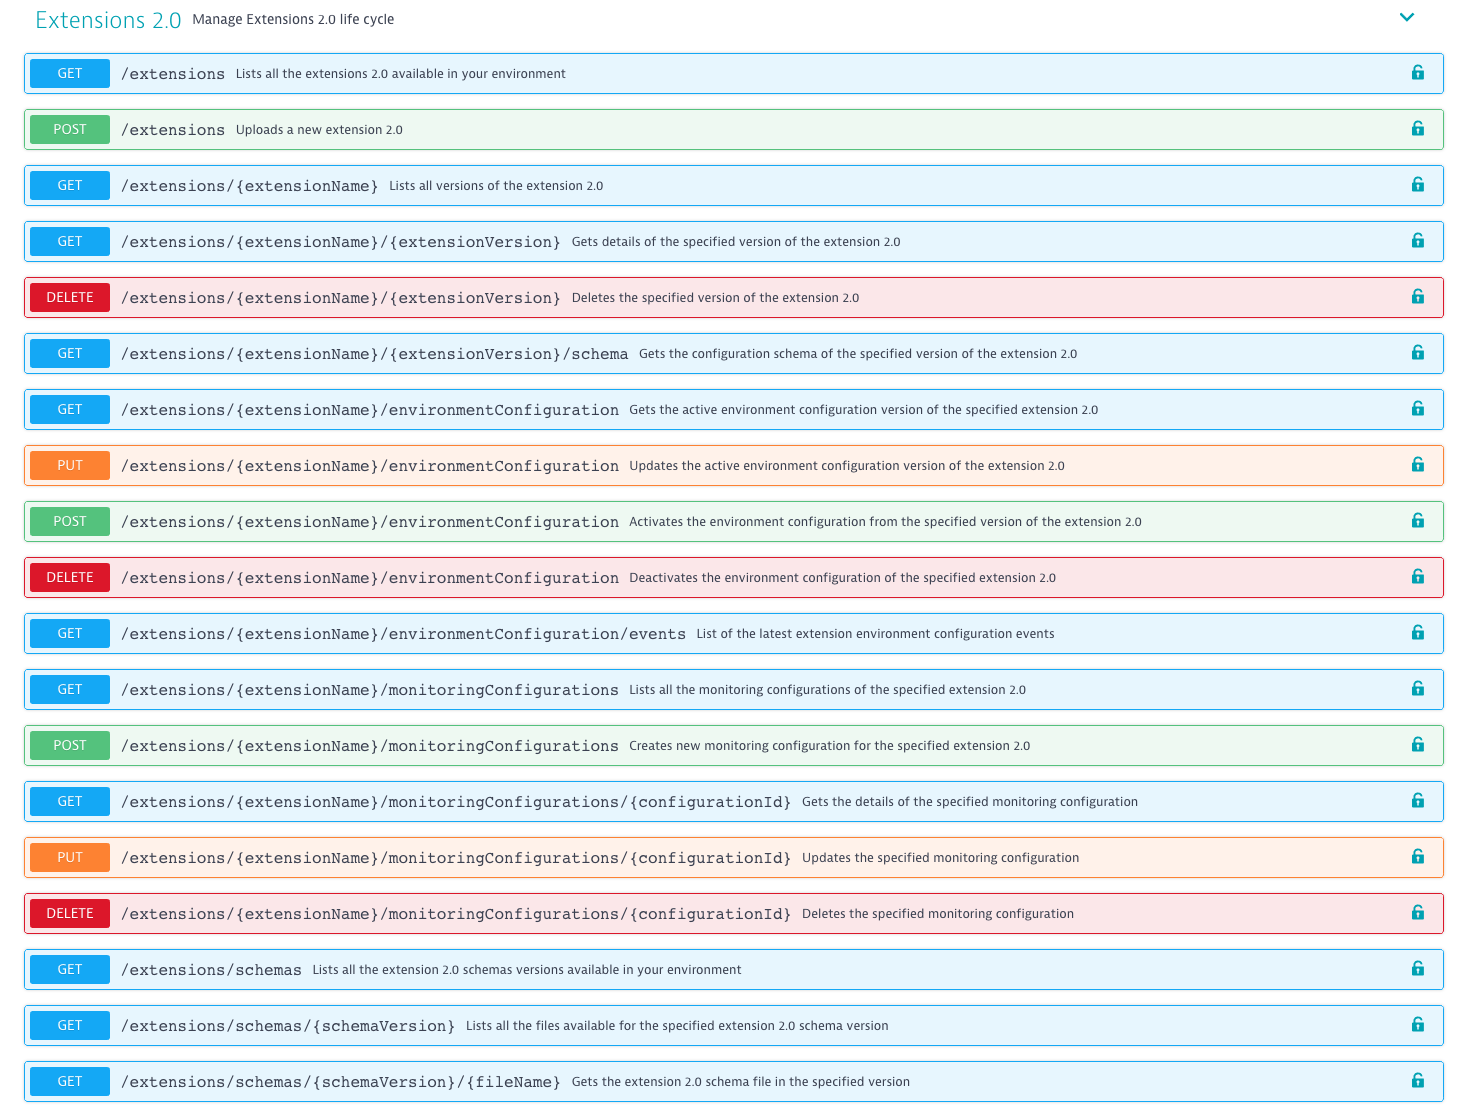
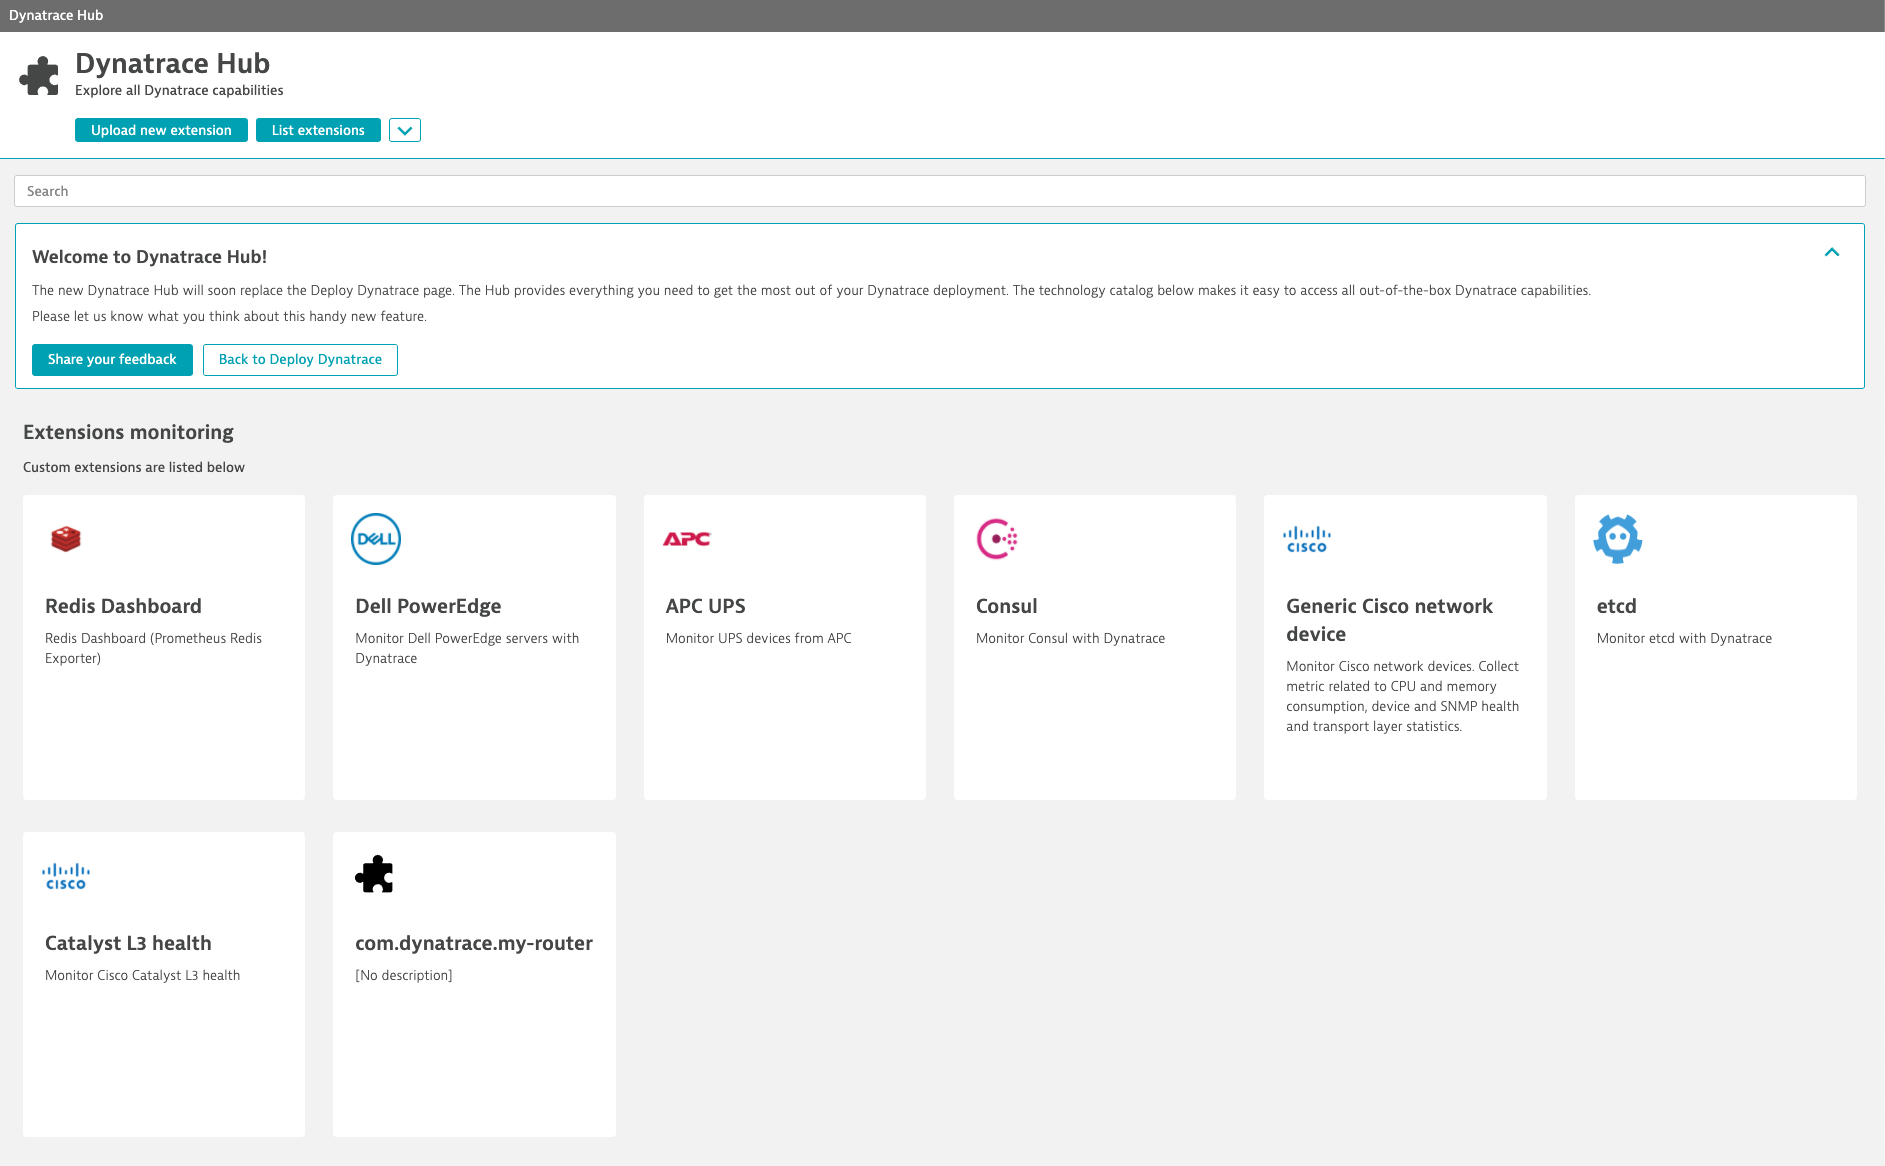
We’ve delivered an open, public API to create, manage, and configure your extensions. This API is the nerve center of each of your environments for your extensibility needs. At the same time, the Dynatrace Hub delivers a convenient UI counterpart where you can find all Dynatrace technologies in one place. This means that Extensions 2.0 are just as manageable from the Dynatrace Hub (“power to the people,” to quote John Lennon), as the Hub is built using the open, public API that you can use yourself. This use of the API is yet another example of democratizing Dynatrace extensibility.
Extensibility for everybody
A major goal of Extensions 2.0 is to provide Dynatrace extensibility to everybody.
Anything that Dynatrace delivers for Extensions 2.0 will be available to all users as well. This means that a lot more features are going to be extensible with upcoming releases.
How to get started
With Dynatrace version 1.213, you can add, manage, and configure Extensions 2.0 with the dedicated, open, public API. Check our Getting started guide for Extensions 2.0.
Coming up next, SNMP-based network device monitoring as well as WMI monitoring will soon be available.
Extensions are already available for local upload and configuration in the Hub. With upcoming releases, the Dynatrace Hub will allow you to configure your extensions as well—expect an announcement soon.
What happens to my existing extensions?
Legacy extensions will run in parallel with Extensions 2.0.
We’re pushing hard to cover all existing capabilities of legacy extensions in the new Extensions 2.0 framework. The long-term outlook, of course, is to sunset the legacy Extension framework at some point in the future.
What’s next
We’re working on introducing new declarative capabilities and new 2.0 extensions based on these capabilities. Expect new blog posts very soon; new 2.0 extensions will keep rolling out throughout this year.
Of course, for users who are comfortable with coding and are already using Python extensions, coded 2.0 extensions are already planned.
At the same time, expect more capabilities (for example, topology definitions, technology definitions, complex metrics, log patterns, log event metrics, and more) to become available for extending.
Start a free trial!
Dynatrace is free to use for 15 days! The trial stops automatically, no credit card is required. Just enter your email address, choose your cloud location and install our agent.


Looking for answers?
Start a new discussion or ask for help in our Q&A forum.
Go to forum