
Migrating workloads from on-premises to cloud environments is a trend we continue to see in 2019. Every cloud vendor is doing their best to motivate enterprises to move more of their existing services over, replace some of their services with cloud services (e.g: databases, queues, ML, …) and build new ones simply “cloud native” (e.g: microservices on k8s).
One question that comes up a lot is: Why do I need a cloud monitoring solution like Dynatrace? Can’t I just go with what is provided by the cloud vendor? There are multiple answers to this question and I thought I’d give you some real-life examples and reasons why our customers leverage Dynatrace, on top of what is provided by the cloud and platform vendors.
Reason #1: Technology Diversity Requires Hybrid-Cloud Monitoring
StepStone – one of our customers in Europe – recently re-fitted their monolith into a Hybrid-Cloud architecture spanning their on-premises data center to AWS. They run everything from NGINX, Tomcat, PHP, Apache to MS SQL Server. They use some AWS Cloud Services such as ELBs, EC2, S3 or RDS, but also still have some of their components running in their On-Premise Data Centers. The following animation shows the ServiceFlow of one of their critical transactions and shows how diverse their technology landscape is. No available Monitoring Service of the Cloud or Platform Vendors nor any OpenSource (e.g: Prometheus) solution that I am aware of can cover these scenarios:
Reason #2: FullStack Metrics vs Siloed Metrics to Validate Business Success
Metrics give you a good idea on what is happening in different parts of your environment or in different services. Dynatrace, for that reason, pulls in metrics from cloud APIs such as CloudWatch:
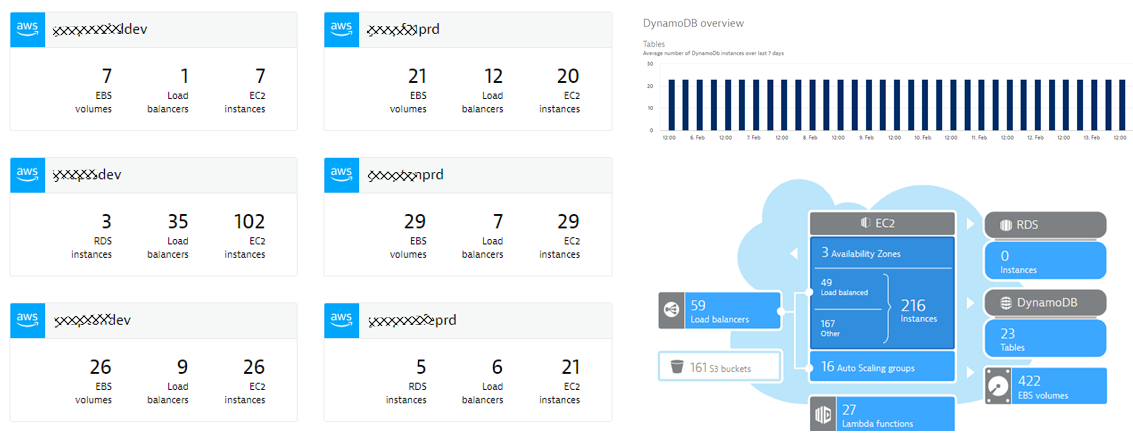
These metrics are great, but only tell one part of the story – and typically a very “isolated” story, about individual services or resources. These metrics don’t tell you anything about service quality, performance, end user experience, deployment health or cross service impact.
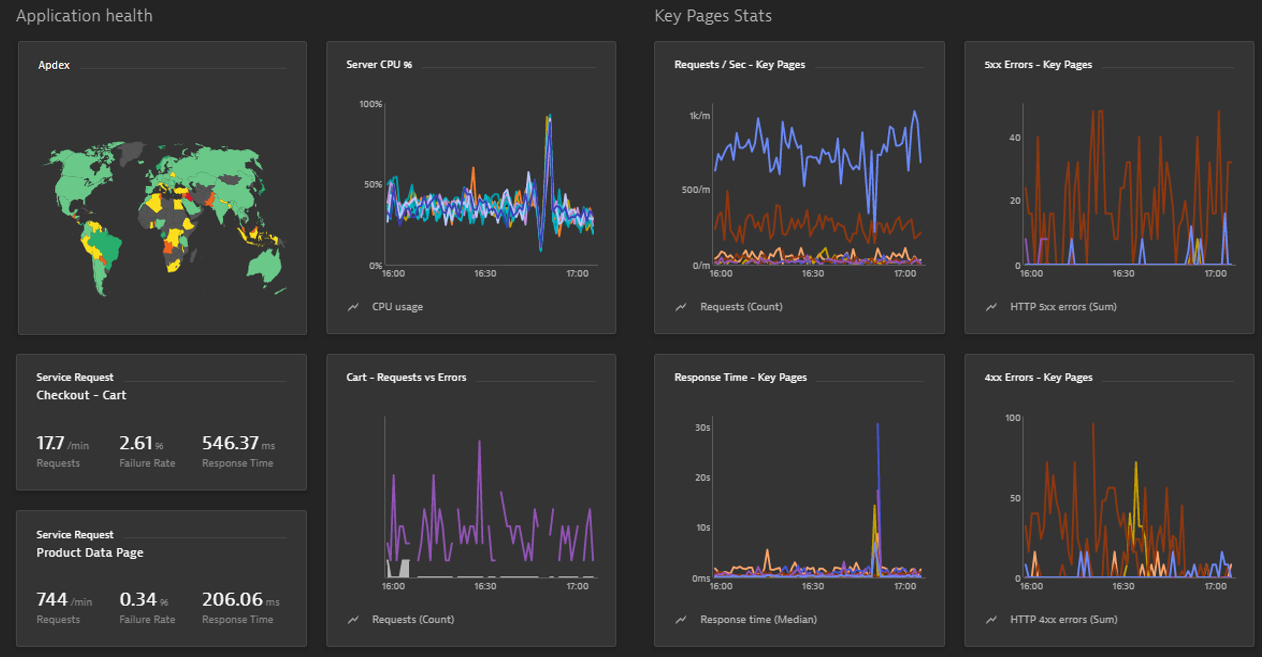
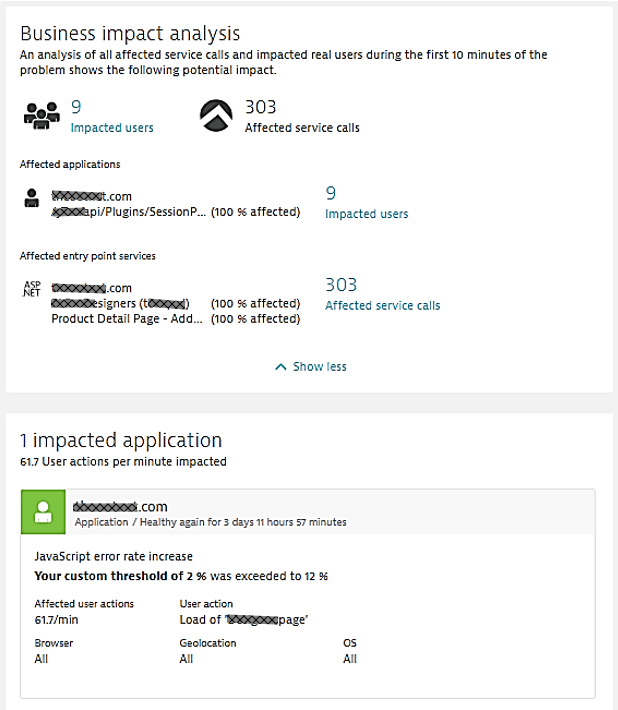
Through the Dynatrace OneAgent, Dynatrace provides automatic full-stack monitoring which includes everything from data center, host, processes & containers, services, applications and end users. The following screenshots shows a typical application health and business impact dashboard. It is from a one of our retail customer that did a Lift & Shift of their existing ASP.NET-based eCommerce store into AWS. While they like AWS CloudWatch metrics, they need the full-stack metrics that Dynatrace provides to understand how their eCommerce store is doing:
Reason #3: Deployment Context & Topology Data to Validate Migration
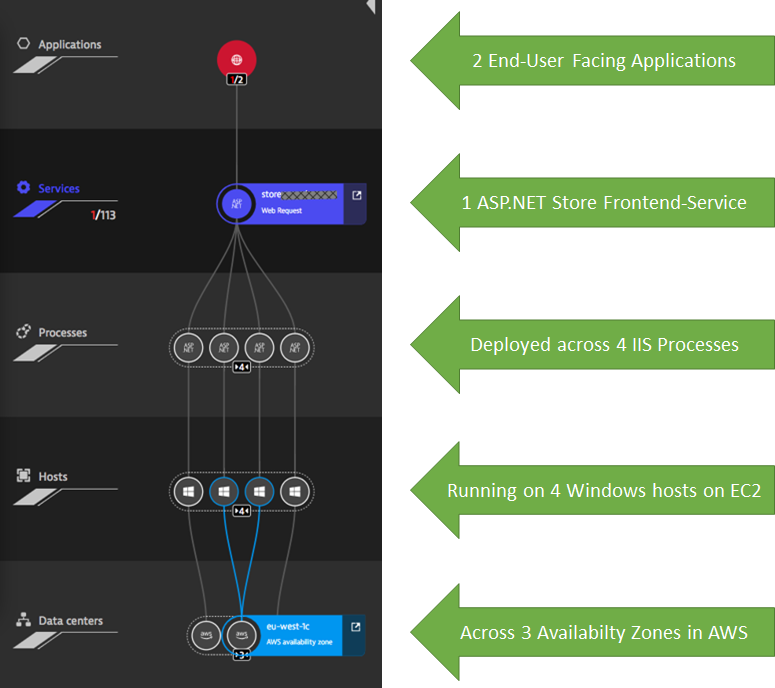
The same eCommerce customer wanted to optimize operational costs when lifting & shifting to AWS. In order to validate whether the migrated application is deployed and scales correctly with increasing load, they leverage Dynatrace Smartscape. Smartscape provides live topology information across all data centers, cloud platforms and technology stacks. In the case of our eCommerce customer they automatically rolled out Dynatrace OneAgent’s on the EC2 Windows hosts that host their ASP.NET Services in IIS:
Tip: My personal favorite feature with Smartscape, is that we can access this data through the Dynatrace REST API. This allows us to monitor changes in topology during different workloads, e.g: under which load does our architecture start to scale up? How does the performance & dependency behavior change with different workloads or how does it change when deploying a new version or configuration? My tip therefore is to explore the Dynatrace REST API and leverage Dynatrace data for your deployment validation and scaling rules.
Reason #4: Operations needs to leverage AIOps to scale & implement self-healing!
There is no doubt that we have no shortage of data. The problem is that we have a shortage of time to analyze the data – especially when we try to do it the “traditional” way:
- putting metrics on a dashboard
- setting custom thresholds
- repeat #1 & #2 as you onboard more apps & services
- reacting to the increasing alert storm
With Dynatrace Davis®, we solved that problem with our deterministic AI, which analyzes all the metrics, while factoring in the live dependency data we have through Smartscape. So, instead of staring at dashboards, the operations team of our customers, trust Dynatrace Davis. If there is a problem, a ticket will be opened that highlights the impact of the detected issue. The following screenshot shows parts of such a problem ticket containing information about the impacted application or service and the number of users experiencing a problem. This information allows operation teams to classify and act upon an incident based on its severity: Sev1, Sev2 or Sev3
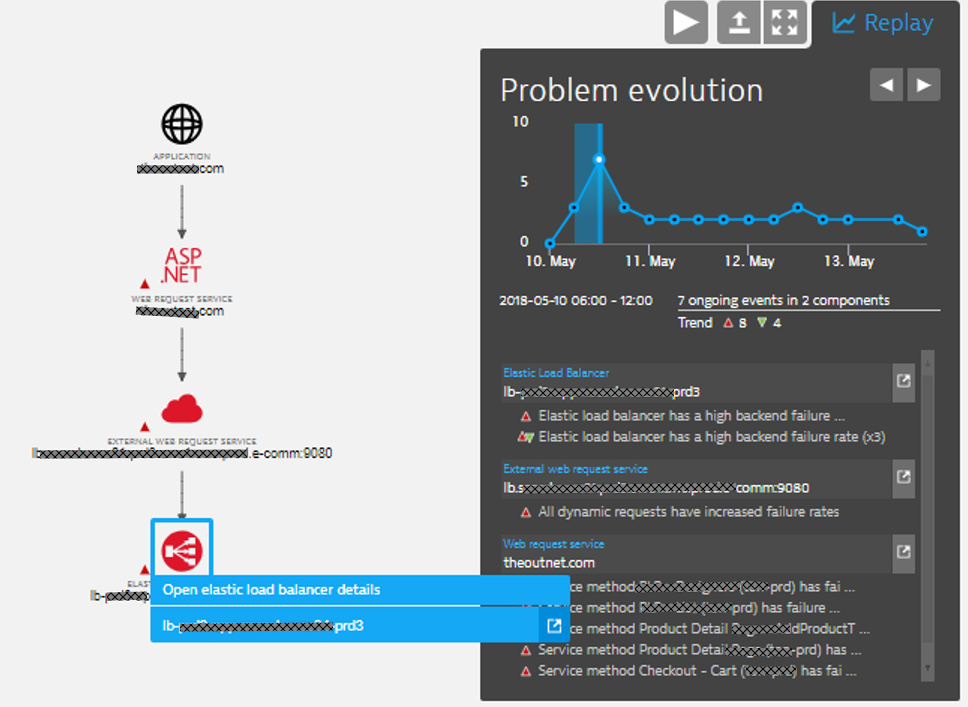
Dynatrace provides several incident notification integrations such as with ServiceNow, PagerDuty, xMatters, OpsGenie, VictorOps, Slack and email. Dynatrace can also trigger custom remediation actions which can execute auto-remediation actions based on the actual root cause data Dynatrace also pulls up automatically. The following screenshot shows the Dynatrace Problem Evolution screen for the failure rate increase issue above. It attributes the root cause to an AWS ELB issue, which impacts the ASP.NET service that tries to access a backend eCommerce service through that ELB:
Tip: Dynatrace Davisbecomes even more effective when pushing external events or data points to Dynatrace. Look at the Dynatrace Events REST API to e.g: push deployment or configuration change events to Dynatrace. If Dynatrace Davis detects an issue in your applications or services, it will then automatically correlate your external events to this problem, so you have all the root cause information in a single place.
Conclusion
Thanks to our customers for sharing their stories. As the cloud migration projects will continue in 2019, I hope this blog and my answers give you more food for thought on why metrics-based monitoring alone will not get you the insights and automation capabilities you need to scale your operations in our hybrid cloud worlds.
If you want to give Dynatrace a try, sign up for our Free Trial.


Looking for answers?
Start a new discussion or ask for help in our Q&A forum.
Go to forum