
Anyone who has struggled with Kubernetes OOMKilled (out of memory) issues knows how frustrating they can be to debug.
Kubernetes has a lot of built-in capabilities to ensure your workloads get enough CPU and memory to stay healthy. However, misconfiguration is a common reason why Kubernetes might kill pods despite the workload just doing fine and all your Kubernetes nodes still having enough free resources.
Assigning memory resources to pods and containers is a science and an art. Despite good Kubernetes knowledge and best intentions, bad things can, and probably will happen, especially in dynamic software development. While you may have allocated adequate request and limit memory resources for one software version, those settings may not work for another. And when things do go wrong with memory allocation, it’s good to have troubleshooting tips at hand.
This troubleshooting story was brought to me by my friend, Robert Wunderer, founder of CapriSys GmbH.
An out-of-memory issue lurks
Robert runs a multi-tenant e-commerce system on a managed Kubernetes environment. Each tenant gets its own e-commerce site deployed on a shared Kubernetes cluster, isolated through separate namespaces and additional traffic isolation.
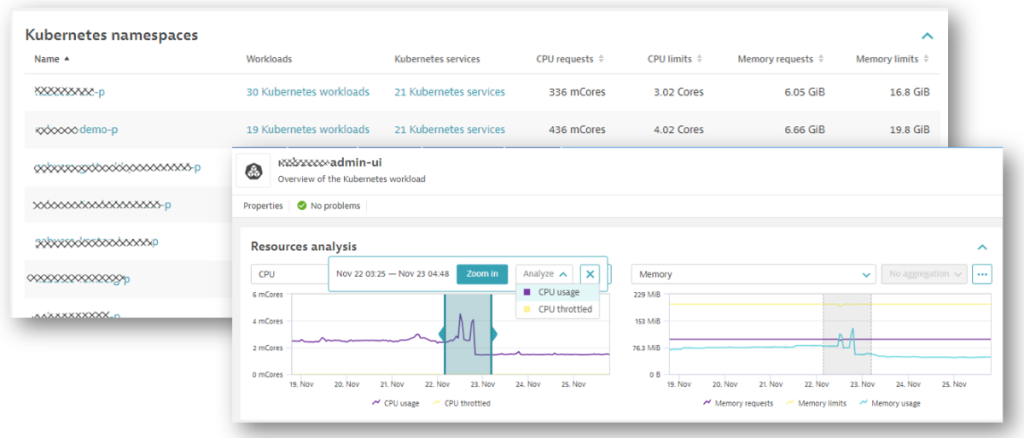
The following screenshot gives an overview of some of those namespaces with details of workloads, services, and allocated resources:
A few weeks ago, Robert’s team rolled out a new software version, but things took an unexpected turn. Here’s what happened, the steps Robert took to troubleshoot the problem, and how Dynatrace helps automate the forensics.
OOMKilled discovery: High error rates on backend service
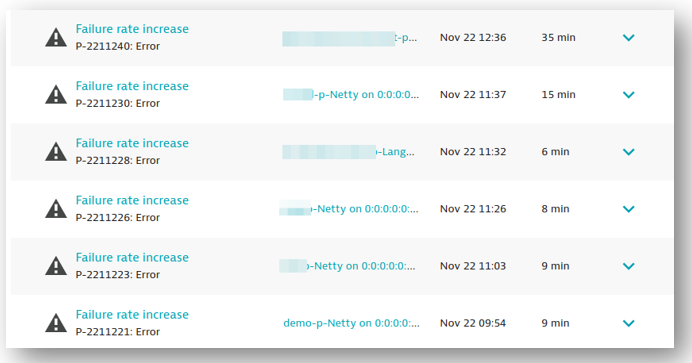
It started on a Friday in the late afternoon, when Robert’s team rolled out a new version across all tenants. There was not much traffic during the weekend, but as Monday came along, Dynatrace started sending alerts about a high HTTP failure rate across almost every tenant on the backend service. The following screenshot shows the list of problems Dynatrace detected.
Robert first looked through the application logs of the backend service where he noticed intermittent backend failures when contacting the report service. As the name implies, the report service creates various user-defined PDF reports that can be triggered by the user.
Just looking at the application logs for the report service, however, didn’t provide much clarity except that the report-service pod kept restarting with no obvious application logic errors. No exceptions, no error logs, nothing. Both backend and report service are implemented in Java, but Robert found no Java runtime-related issues, either.
Analyzing: Looking for unusual Kubernetes event activity
So Robert analyzed the data and events Dynatrace captured for the Kubernetes cluster responsible for keeping the pods running. He immediately spotted an unusual spike in the number of out-of-memory events (OOMKilled) shown in the following Dynatrace Kubernetes screens.
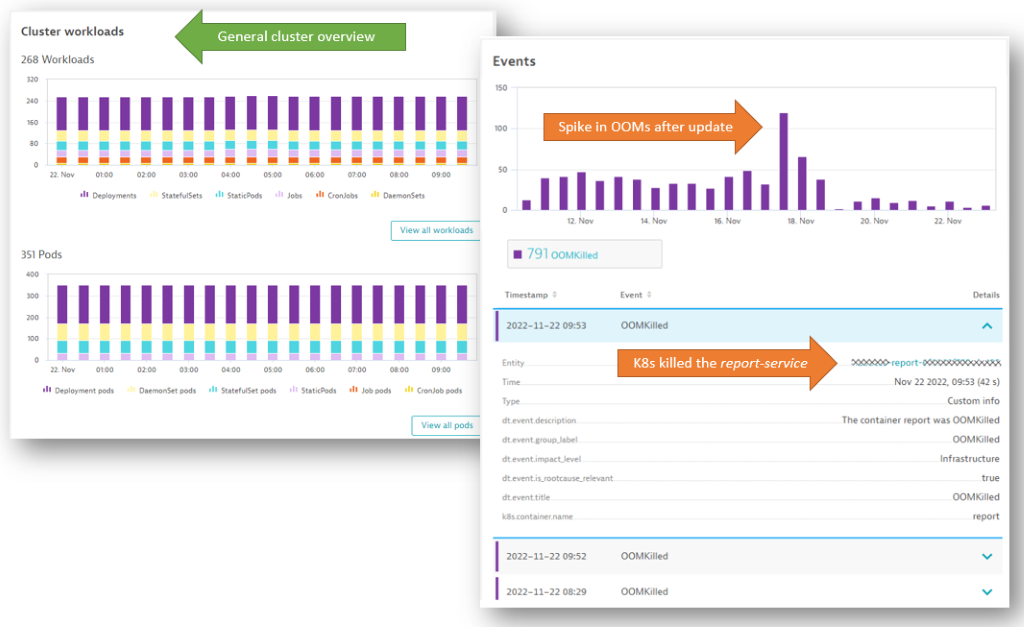
This data confirmed that the system was killing off the report service pods for lack of memory. During the container restart, the backend service could not connect to the report service, which led to the errors.
The memory needed for running those reports varies depending on the number and size of the requested report. The question was whether the problem was due to actual memory pressure or whether it was caused by too-tight resource settings. Did somebody change the memory settings or did the memory requirements of the new version change?
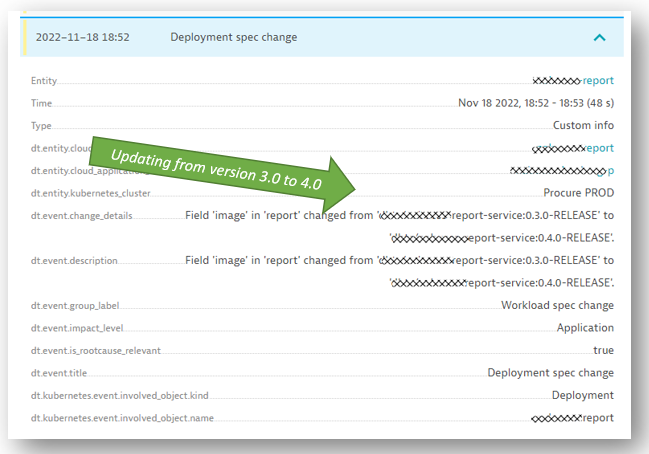
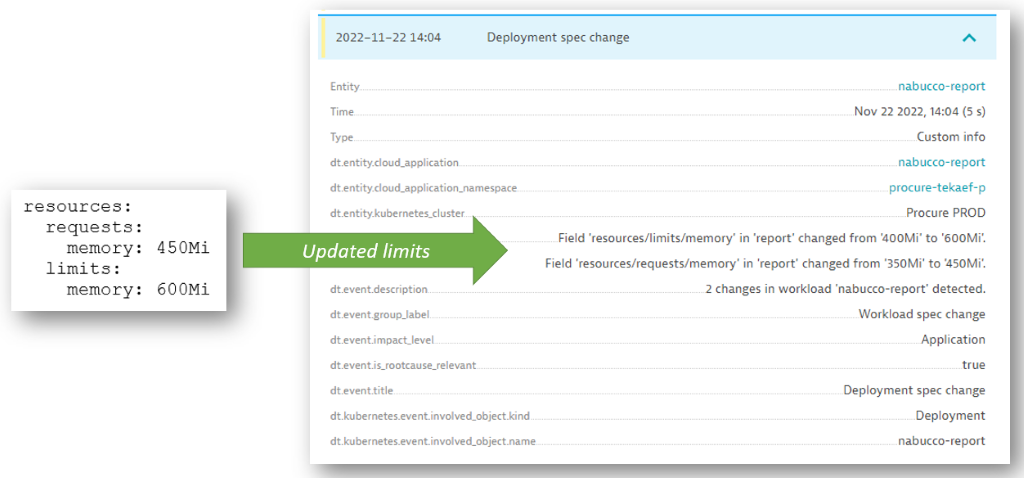
Dynatrace automatically detects any deployment specification change (such as replicaset, version, limits, and so on) shown in the list of Kubernetes events. In the following screenshot, you can see that Dynatrace automatically detected the deployment specification version change, which went from 3.0 to 4.0. But that’s about it. No other change was detected.
Besides the version update, nothing has changed. So why were the pods killed with an OOMKilled error? Was there a general memory shortage on the Kubernetes cluster nodes? Or did version 4.0 of the report service just need more memory than the previous 3.0 version?
Out-of-memory root cause: Wrong settings or shortage of resources?
Because the problem was happening with almost all the report service pods and Dynatrace reported no problems with memory on any of the Kubernetes nodes, Robert already suspected that the memory behavior of the new version has changed.
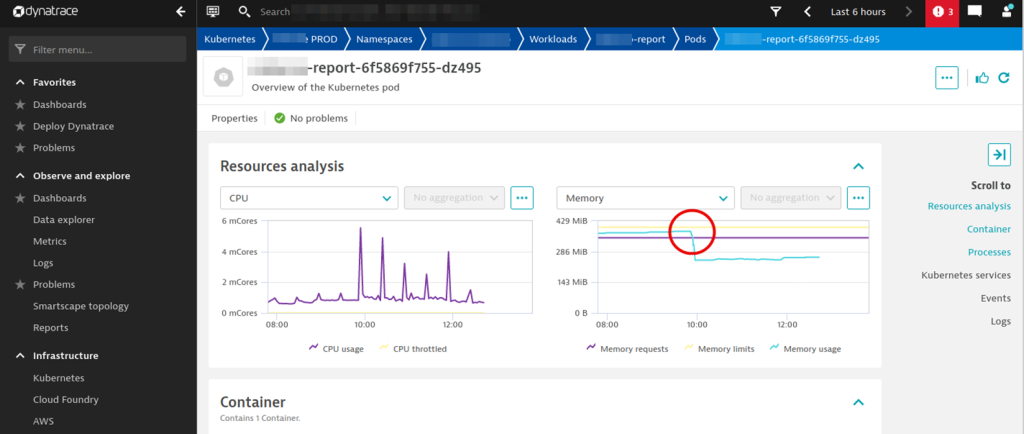
Looking at the resource analyses confirmed the suspicion. The following chart shows how memory usage rises to almost the defined limit of 400MB before the pod is killed off and restarted. Historical data shows this didn’t happen with the old version.
The fix: Adjust the memory settings to avoid OOMKilled errors
Armed with that knowledge, the solution was simple: Robert increased the pod’s memory limit from 400MB to 600MB so that reports didn’t run into the out-of-memory shortage.
Lesson learned: Avoid out of memory issues by regularly testing memory allocation
In my conversation with Robert, he told me they mainly do functional testing before promoting a new version to production. Now they’re investing in more load, scalability, and memory testing with the goal of better understanding capacity requirements.
If they had run more tests with varying report sizes, they would have identified the changed memory behavior. This could have resulted in either fixing a memory problem or simply identifying the proper limits for smooth production operations.
An automatic safety net for discovering out-of-memory and other errors
With Dynatrace in place, Robert could immediately pinpoint the root cause of the OOMKilled errors, which confirmed his suspicions. This instant answer spared his team a lengthy troubleshooting process so they could get right to implementing more comprehensive testing.
I want to thank Robert for sharing this story. Because Kubernetes is becoming the default platform for most of our workloads, it’s important to know what can go wrong. It’s also important to educate others about how Kubernetes handles resource settings and how we can use observability data to detect the root cause and take corrective actions.
If you want to learn more about Kubernetes, I also highly recommend the following resources:
- Kubernetes Observability for SREs with Dynatrace
- IsItObservable: all episodes around Kubernetes Observability
- How Dynatrace saves you from broken Kubernetes clusters
- Automated Release Validation with Dynatrace
To try Dynatrace yourself, sign up for your own Dynatrace SaaS Trial.
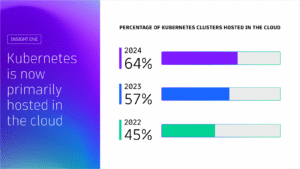
Kubernetes in the wild report 2025
Uncover global Kubernetes adoption trends, cost-optimization strategies, and key tools driving innovation for thousands of organizations worldwide. This report highlights global trends in the technology’s adoption and usage in production environments from thousands of organizations across diverse industries.


Looking for answers?
Start a new discussion or ask for help in our Q&A forum.
Go to forum