

Kubernetes monitoring
Manage the health, performance, and security of containerized applications and multi-cloud infrastructure with metrics, traces, and logs in one place.


Kubernetes monitoring and beyond. Way, way beyond.
Easily run and monitor your entire Kubernetes environment in one observability, analytics, and security platform.
Manage platform health and performance
Gain full, ongoing visibility into cluster health and:
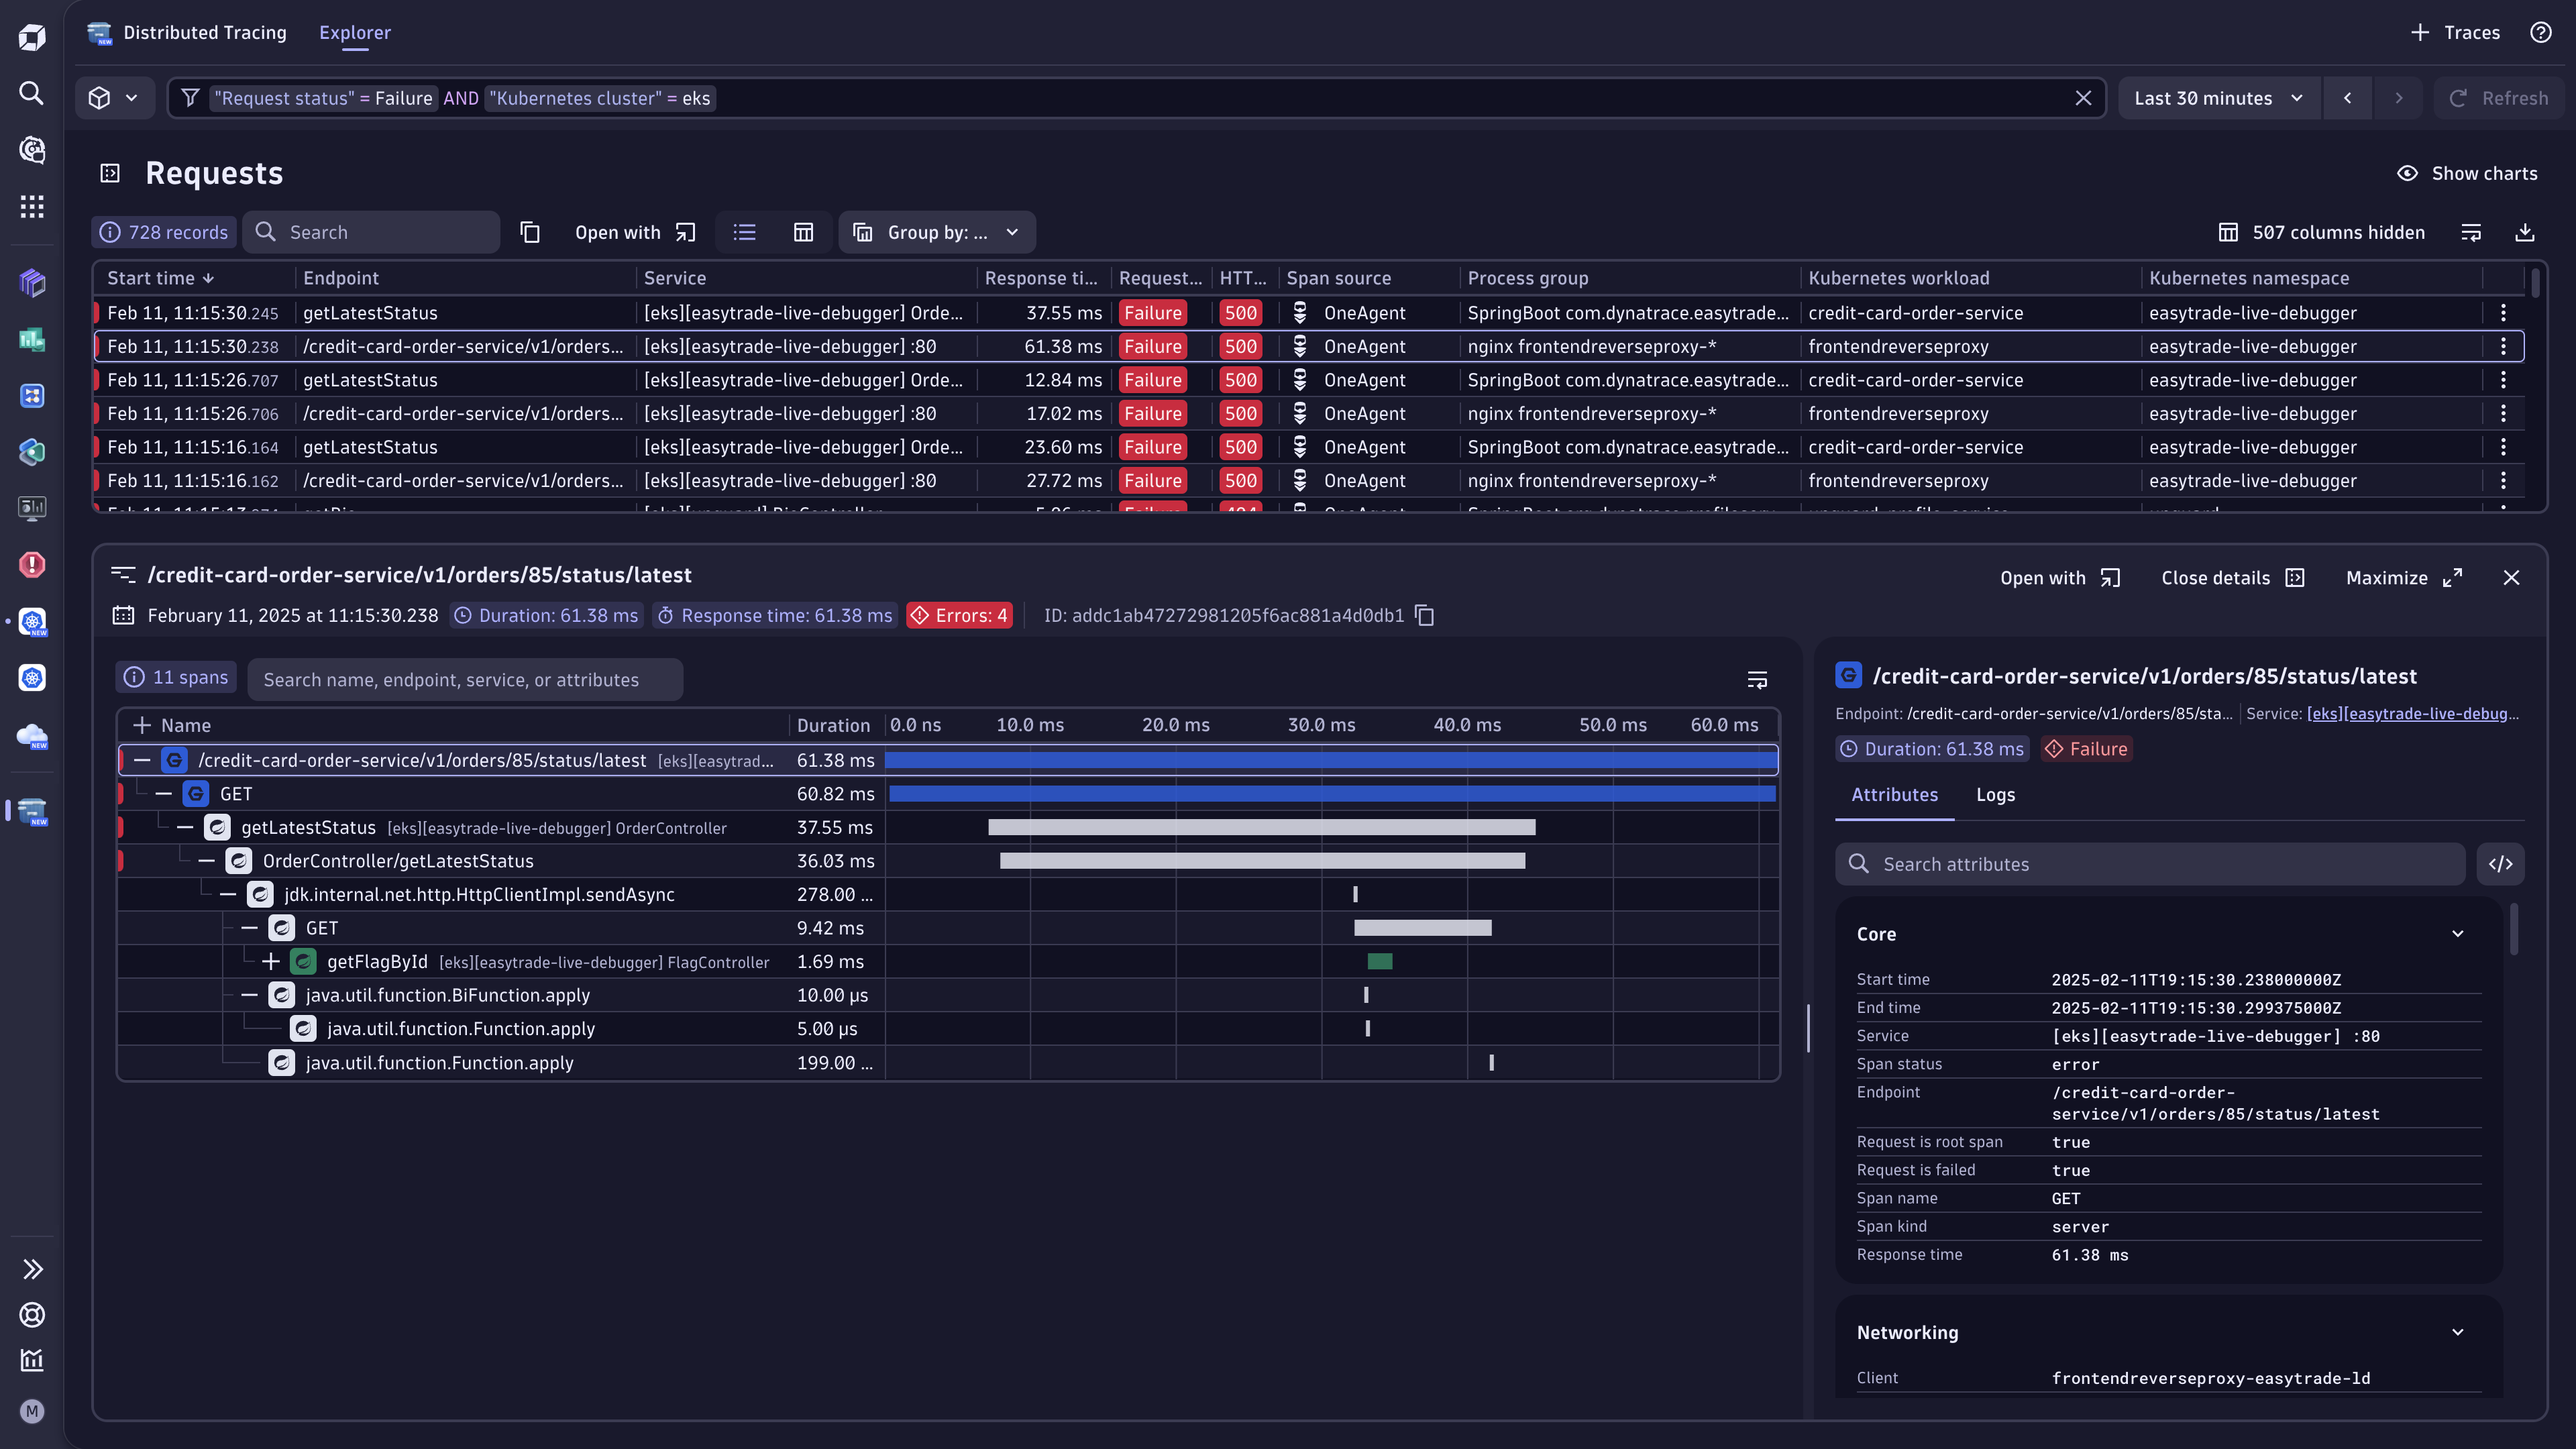
- Continuously discover and monitor Kubernetes nodes and pods
- See metrics, events, and logs from Kubernetes pods and nodes in one view
-
Seamlessly stream Kubernetes logs and leverage log analytics to gain cloud-native workload insights
Full support of GitOps practices with Monitoring as code
- Get automatic, out-of-the-box alerting for Kubernetes
Optimize resource utilization across workloads
Improve performance and better leverage resources with exploratory and predictive analyses, so you can:
- Understand overall cluster resource utilization
- Identify workloads consuming the most resources
- Determine workloads not getting enough resources and reallocate.
Deliver excellent customer experience and application performance
Solve complex interactions between microservices and your Kubernetes platform, and:
- Automatically identify root cause and impact with Dynatrace Intelligence
- Continuously discover microservices, end user experience, and Kubernetes workload health.
- Visualize requests end-to-end with distributed tracing and code-level profiling
- Test the impact of changes with automatic deployment validation
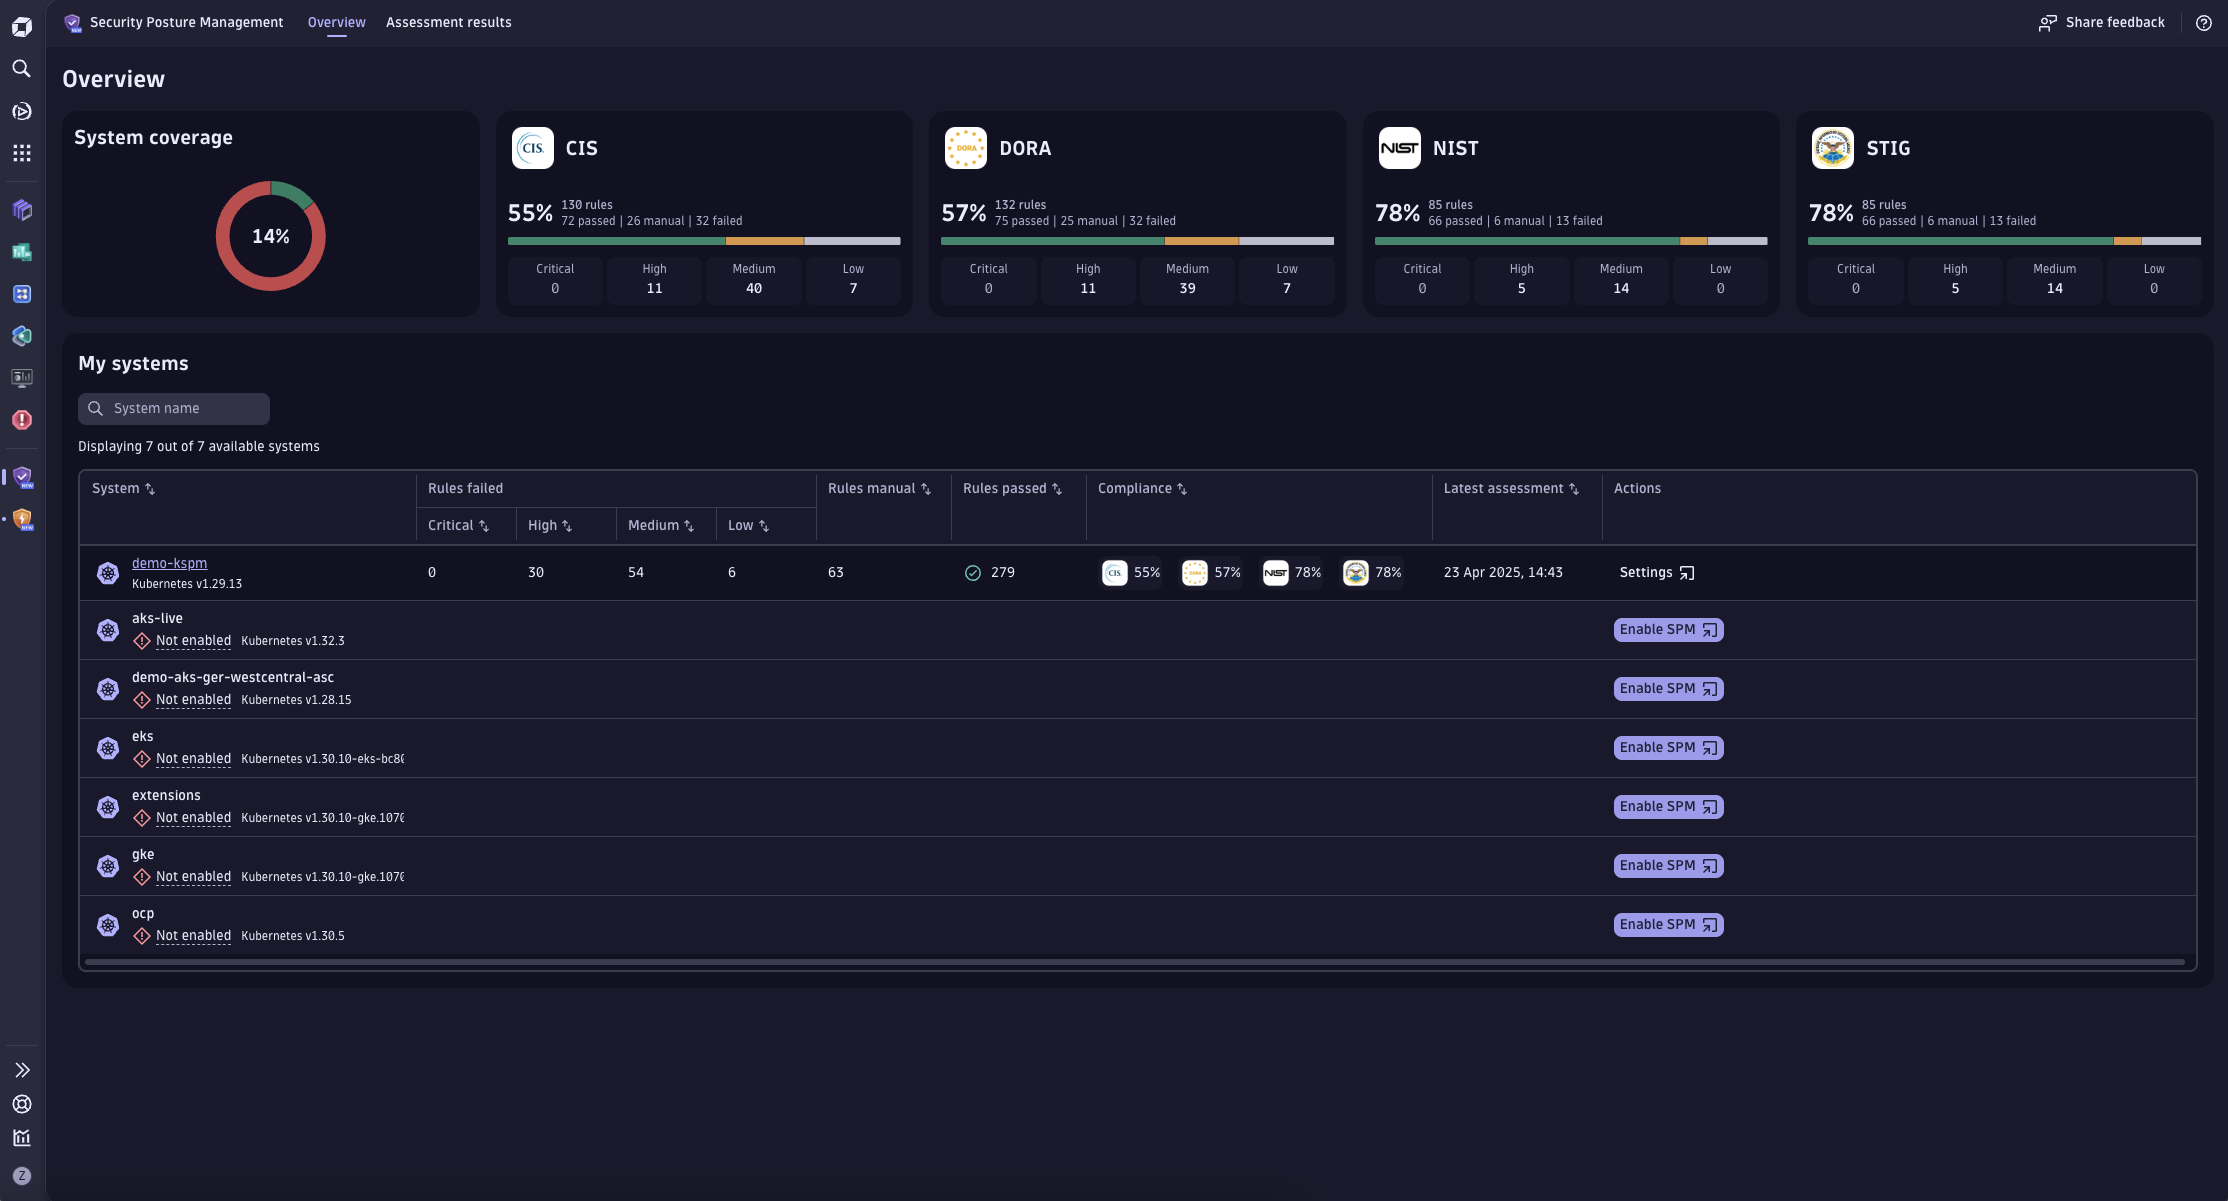
Ensure Kubernetes security
Empower DevSecOps with cloud-native security solutions and intelligent automation, so you can:
- Identify and remediate vulnerabilities in production with runtime security analytics and proactive risk mitigation
- Detect and block attacks in real-time, while enhancing defense through log audit and forensics
- Simplify compliance monitoring and strengthen your Kubernetes security posture


Comprehensive Kubernetes Observability at scale
-
Digital Experience
MonitoringEnsure perfect user experiences with proactive and real-time insight into availability, performance, and user behavior.
-
Application
ObservabilityAdd the power of Full-Stack app monitoring with code-level insights, AI-assistance and root cause analytics.
-
Automation
Create Kubernetes auto-remediation and team notification workflows.
-
Security Protection
Protect your clusters and apps from security threats.
-
Log Management
& AnalyticsDiagnose cluster and app health with automated analytics.
-
Extensions
Get visibility into the entire Kubernetes ecosystem.

Scale fast, securely, and cost-effectively
Kubernetes monitoring resources
 REPORT2025 Kubernetes in The Wild Report
Learn how top organizations use Kubernetes and related technologies in production. BLOGFlexible, scalable, self-service Kubernetes native observability
See how we leverage native Kubernetes standards to deliver the data teams need fast. BLOGOut-of-the-box alerting for Kubernetes
See how a scalable and context-based solution empowers multiple teams with different needs. WEB SERIESWatch: Is it Observable?
Join Cloud Native Advocate, Henrik Rexed, for video deep dives and tutorials into the technologies (like Kubernetes) shaping the observability landscape.


