
To make exploratory data analytics even easier, organizations are using more AI techniques to make sense of data from their cloud environments. With Dynatrace Grail dashboards, Notebooks, and CoPilot generative AI, getting instant answers has never been easier.
In a digital-first world, site reliability engineers and IT data analysts face numerous challenges with data quality and reliability in their quest for cloud control. Increasingly, organizations seek to address these problems using AI techniques as part of their exploratory data analytics practices.
Exploratory data analytics is an analysis method that uses visualizations, including graphs and charts, to help IT teams investigate emerging data trends and circumvent issues, such as unexpected traffic spikes or performance degradations.
Challenges to exploratory data analytics
Among the challenges analysts face are multiple heterogeneous data sources, noisy or incomplete data, insufficient causal reasoning (faulty connections between event cause and effect), and untrustworthy AI, according to an article from the Columbia University Data Science Institute.
Another hurdle is mistaking easy patterns as effective analysis, according to an article in the Harvard Data Science Review. Techniques analysts use to emphasize patterns, such as aggregating data by default, can cause them to overlook variation and uncertainty in their data, so they can draw conclusions that the data don’t fully support.
AI techniques provide a solution
A first line of attack is selecting the right analytics tool, which can help teams detect meaningful patterns in real-time data, integrate data from multiple sources, and render data visualizations.
To that end, in 2022, Dynatrace released Grail, the auto-indexing, schema-on-read data lakehouse, along with Notebooks and Dashboards. This expansion of the Dynatrace platform builds on its foundation, which uses topology mapping and causal AI, an AI technique based on fault-tree analysis, to pinpoint root causes.
The next challenge is harnessing additional AI techniques to make exploratory data analytics even easier. Dynatrace Grail, Notebooks, Dashboards, and multiple AI techniques combine to provide analysts with instant insights, as demonstrated by Thomas Ziegelbecker, a senior product manager at Dynatrace, and his colleagues Peter Zahrer, principal product manager, and Gabriele Hasson-Birkenmayer, senior product manager at the recent Perform 2024 conference.
Three steps in exploratory data analytics: Discover, browse, explore
Grail captures heterogeneous data from across the network in one place while retaining its context and semantic details, which eliminates the limitations of traditional databases. From this unified, semantically rich data resource, analysts can explore data on the fly and share findings using Notebooks and Dashboards.
With Notebooks, analysts can “explore their data, use ad-hoc analysis, and work with data in a sequential fashion to refine, refine, refine,” Ziegelbecker said. “With Dashboards, you can observe [the data you’re interested in] over time,” covering common monitoring use cases such as system health.
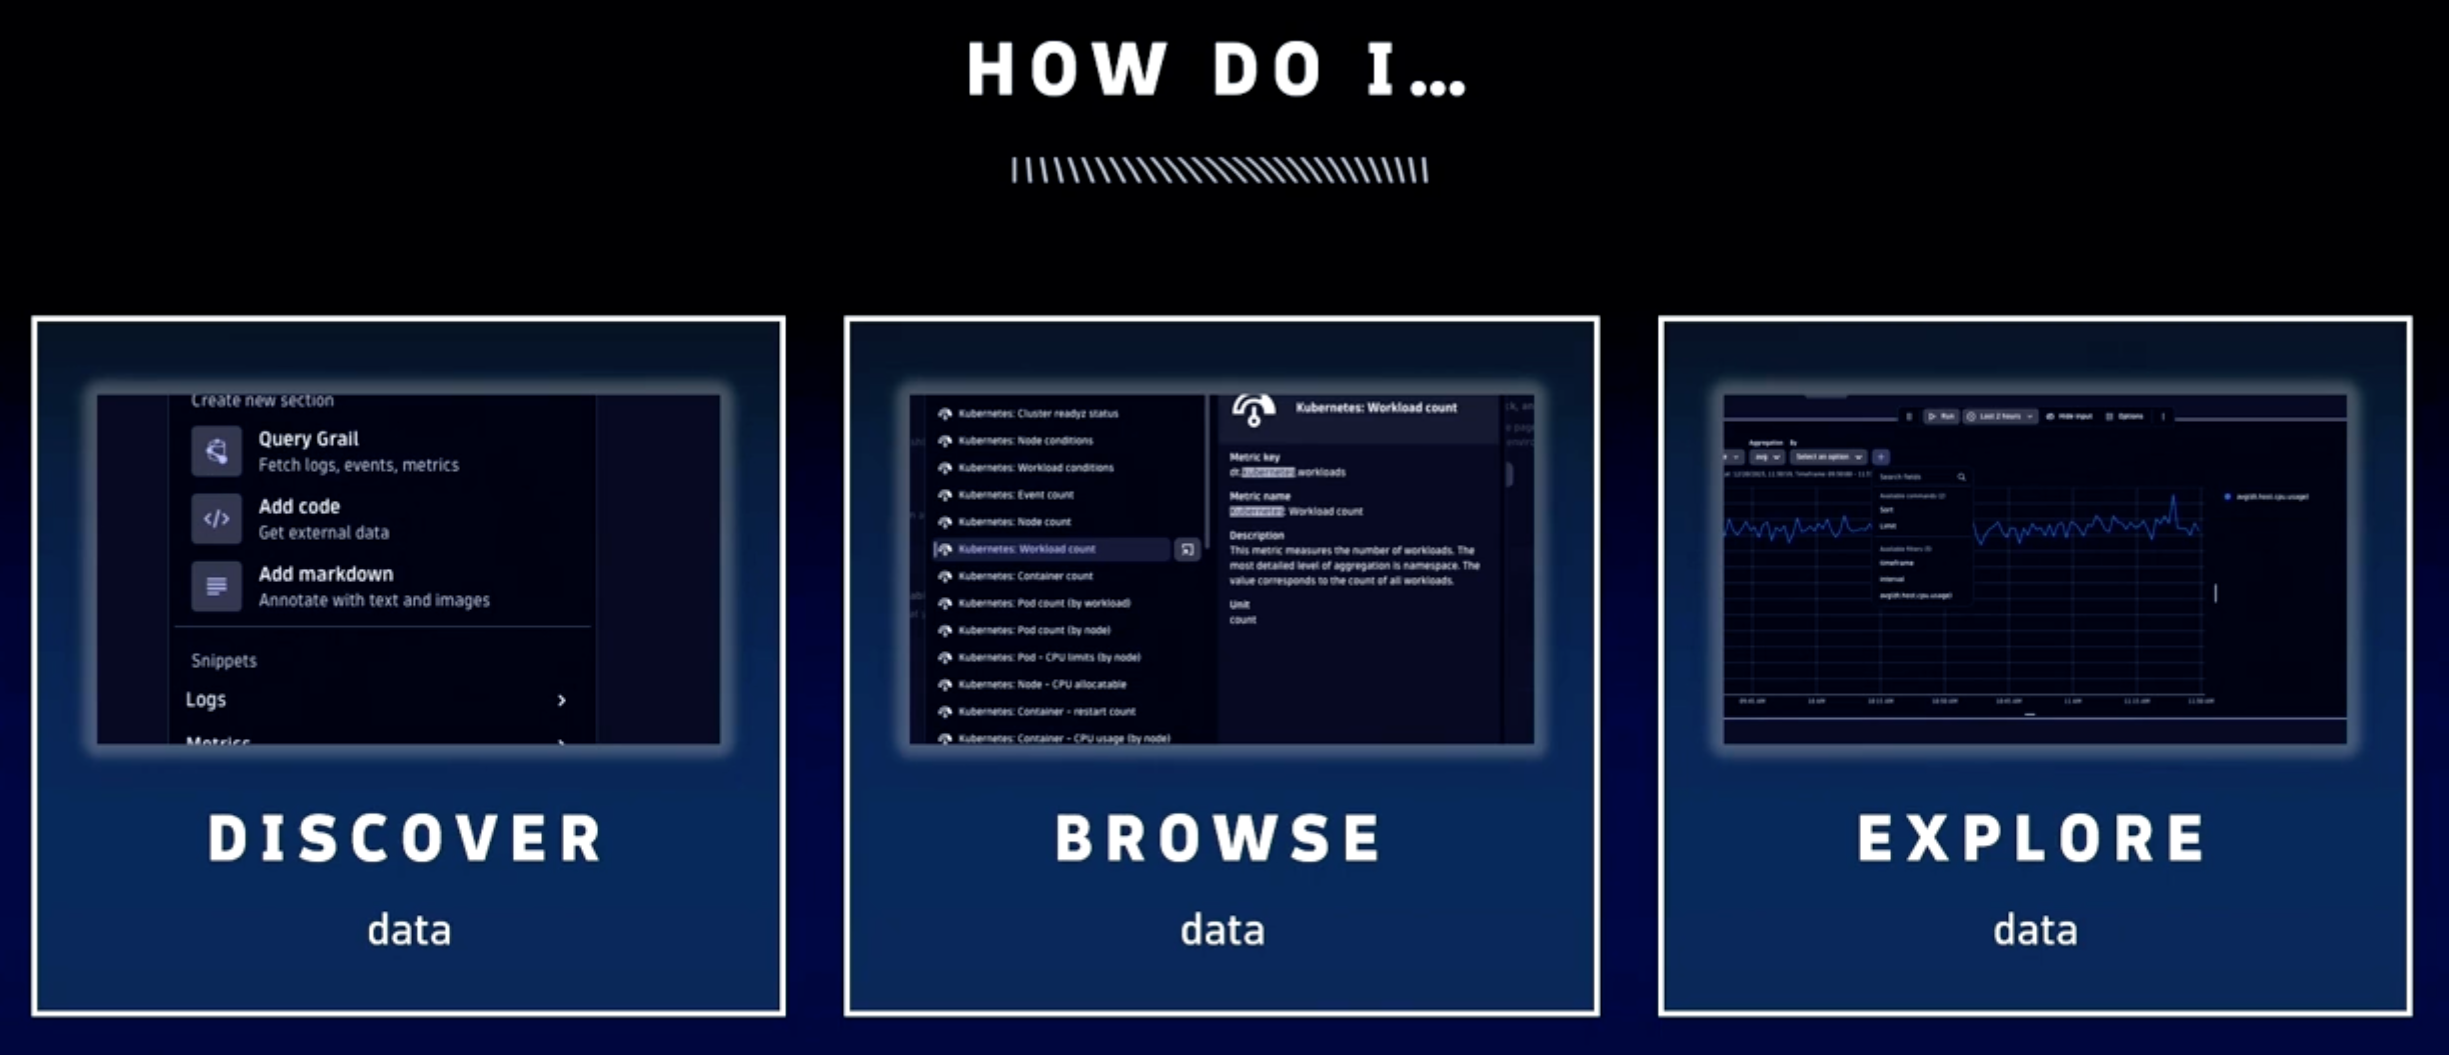
“When you work with data, it comes down to three steps: Discover, browse, and explore,” Zielgelbecker said. “Start by asking yourself what’s there, whether it’s logs, metrics, or traces. Once you double down on the type, you want to figure out, or browse, which metric is relevant. Then when you have the metric, you want to explore it—what splits are available, how can I break it down, how can I aggregate it, and so on.”
Discover data using global search on the new ‘explore’ section and tile type in Notebooks and Dashboards
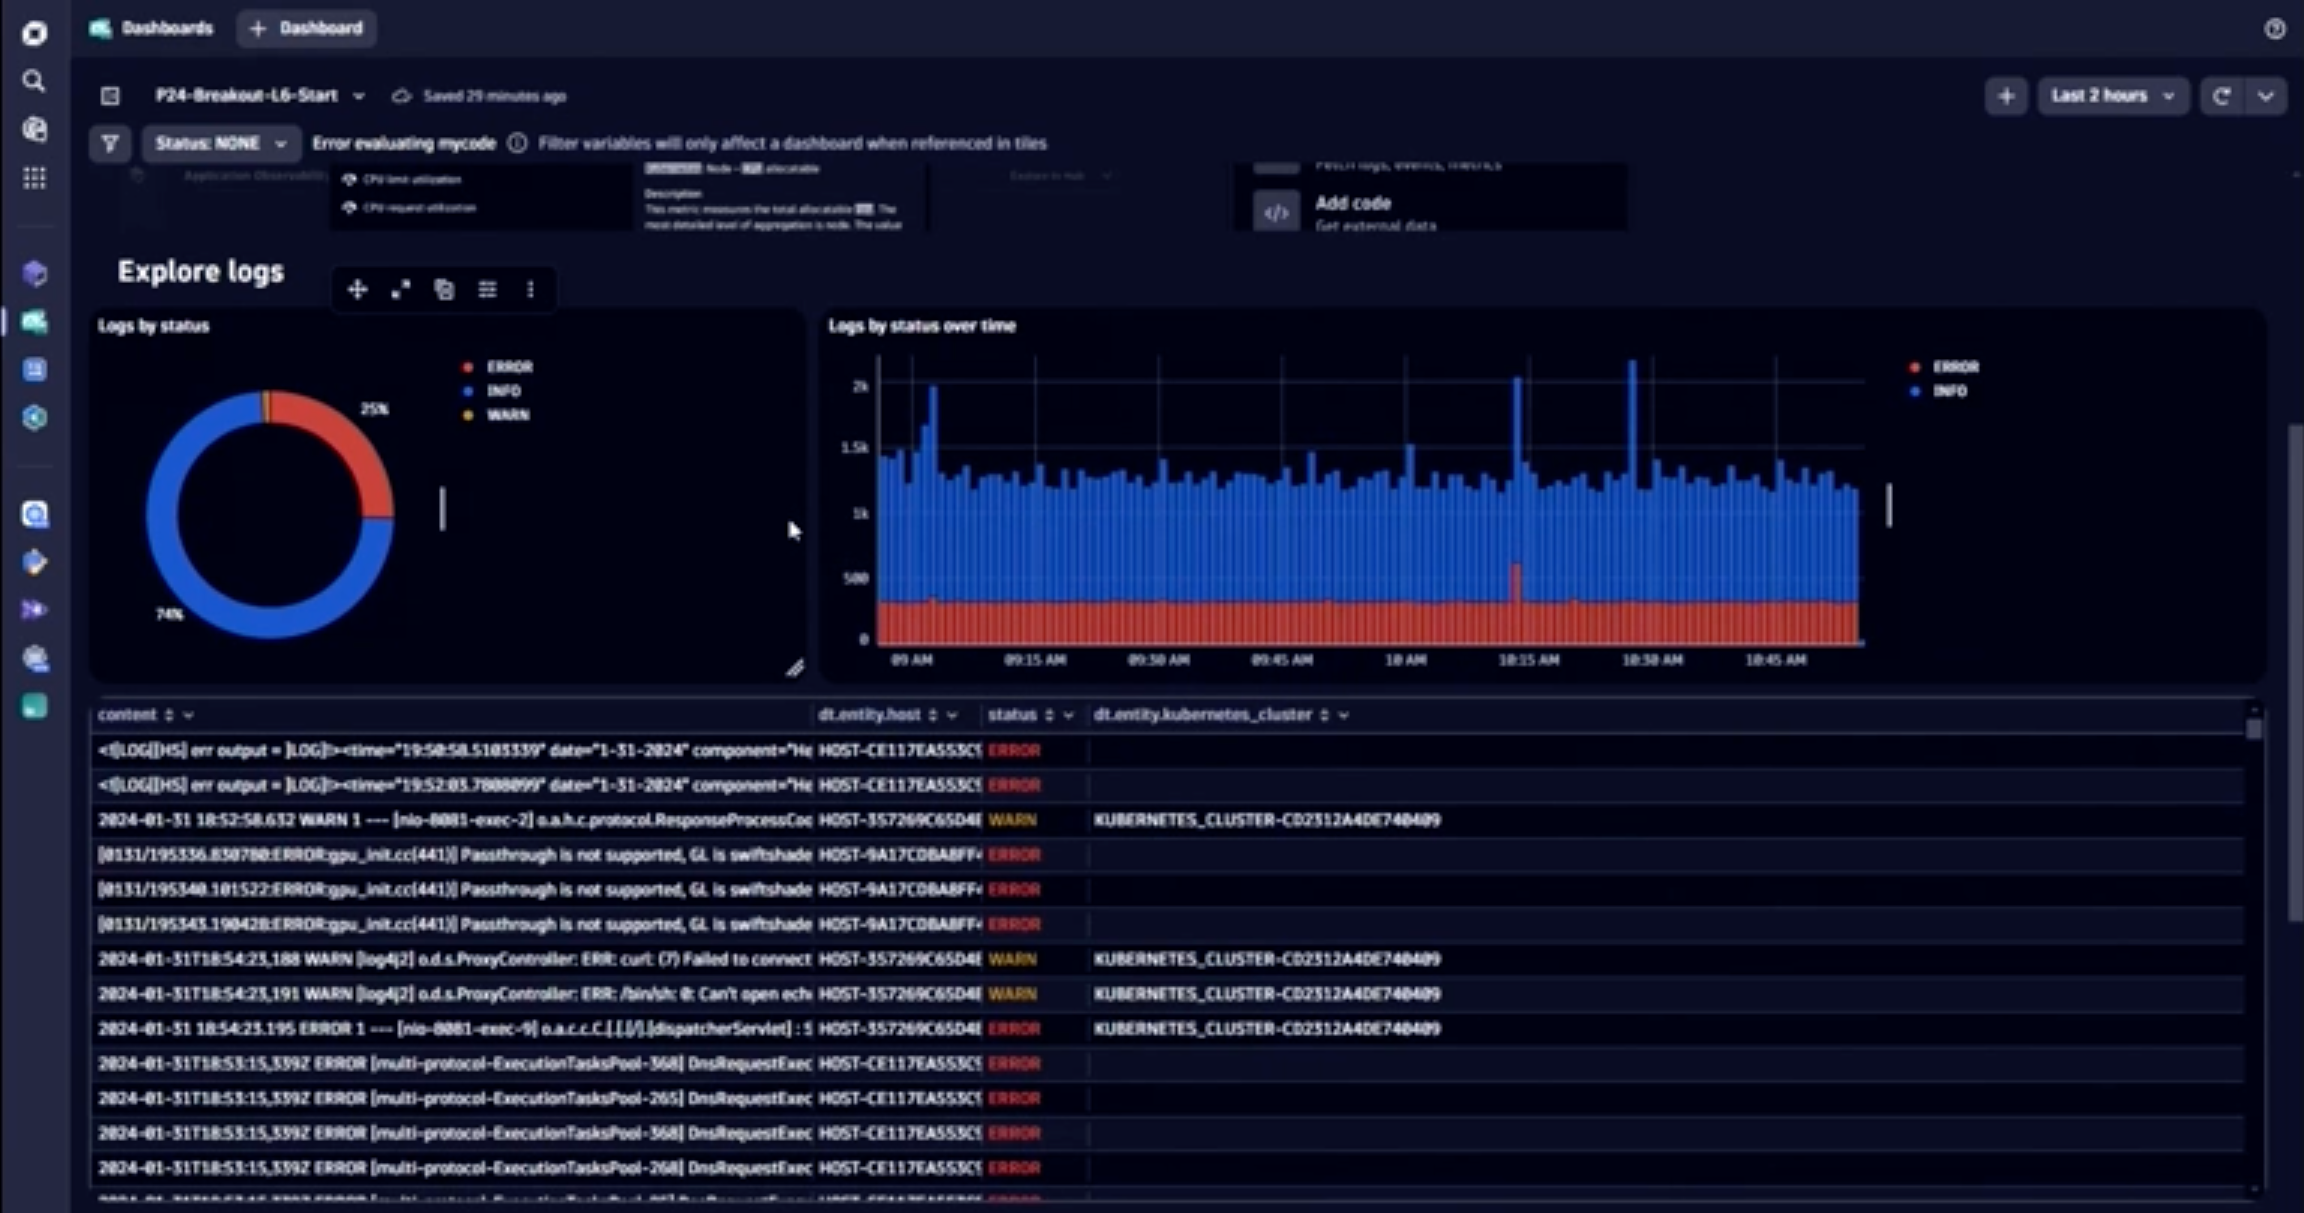
From a dashboard, an analyst can investigate an issue, such as a 25% error rate from a key Kubernetes cluster. According to Ziegelbecker, the discovery phase of exploratory data analytics can start in two ways: doing a global search or using the “explore data” interface.
- Discovery using global search. Analysts can easily navigate to any entities (hosts, applications, processes, Kubernetes nodes, and so on) or metrics in their environment using global search. Users can trigger the global search from any context with
CTRL/CMD +K. Type>to see a list of all available search categories. Select the relevant category (such as “Metrics”) and type the search term. This provides a quick way to navigate data or start a DQL query. - Discovery using the “explore data” interface. For those who think visually, Dynatrace provides an interface to explore data within Dashboards and Notebooks. Using step navigation and drop-down menus, this simplified UI approach streamlines query building for essential tasks such as filtering, aggregating, and sorting. This method also enables users to aggregate, filter, sort, limit, or split metrics.
Browse data: Advanced exploration using DQL
Once analysts discover the data they’re interested in, the next step is to refine the search and share results.
Dynatrace Notebooks is an interactive data exploration interface that enables users to collaborate using code, text, and rich media to build, evaluate, and share insights.
“[Notebooks] is purposely built to focus on data analytics,” Zahrer said. “We use Dashboards to monitor and present; we use Notebooks to work with the data and, at the same time, document what we just did.”
Using DQL, users can query any data stored in Grail, such as metrics, logs, events, and time series, in context of any entity (hosts, processes, applications) in the monitored environment, provided by Dynatrace Smartscape.
Using Notebooks, an analyst can extend the query started in the discovery phase to further troubleshoot an issue, such as a 25% error rate in a Kubernetes cluster. “I’m interested in seeing whether the [Kubernetes] log errors we’re seeing on our dashboard are related to a misconfiguration on the Kubernetes side,” Zahrer said.
To relate logs and metrics using Grail, analysts can use DQL within the Notebooks app to further explore the problematic Kubernetes logs. DQL prompts help analysts filter on enriched data from Dynatrace OneAgent—a single file that automatically discovers all the processes running on a host and auto-instruments application pages.
By enriching data with the topological context of Smartscape through OneAgent and keeping data consistent, Zahrer said, Dynatrace helps analysts do causation-based cross-correlation to see how events relate and to pass on details, such as Kubernetes nodes involved in errors, to further refine investigation and analysis.
Explore data using Davis CoPilot—a generative AI technique for advanced analytics of logs and metrics
As an alternative to identifying and exploring data, analysts can also use Davis CoPilot to achieve the same result.
“Davis CoPilot is a generative AI that works in concert with our predictive AI and with our causal AI,” Hasson-Birkenmayer said. The blend of these three AI techniques—predictive, causal, and generative AI—make up the Davis composite, or hypermodal, AI approach.
Davis CoPilot generative AI helps analysts get started with—and get more proficient using—DQL. Instead of configuring tiles or sections, or instead of writing DQL, analysts can explore data with a natural language prompt. For example, “you can ask Davis CoPilot to ‘summarize all logs by status,’” she explained. “In the background, Davis converts the prompt into DQL and auto-executes it. So you can go straight from a conversational prompt using your natural language directly into insights.”
Because the Davis CoPilot integration in Notebooks is a DQL assistant, it runs the query so analysts can see if the results are what they intended without having to first review and validate the DQL syntax themselves. If users need to refine the results, they can do so either by refining the natural language input or by creating a new DQL section and refining the details directly.
Analysts can also customize data visualizations according to their needs. “In some cases, I am actually choosing and selecting a particular visualization, and in some cases [such as with certain metrics], it gets done automatically,” Hasson-Birkenmayer said.
Exploratory data analytics enhanced by AI techniques
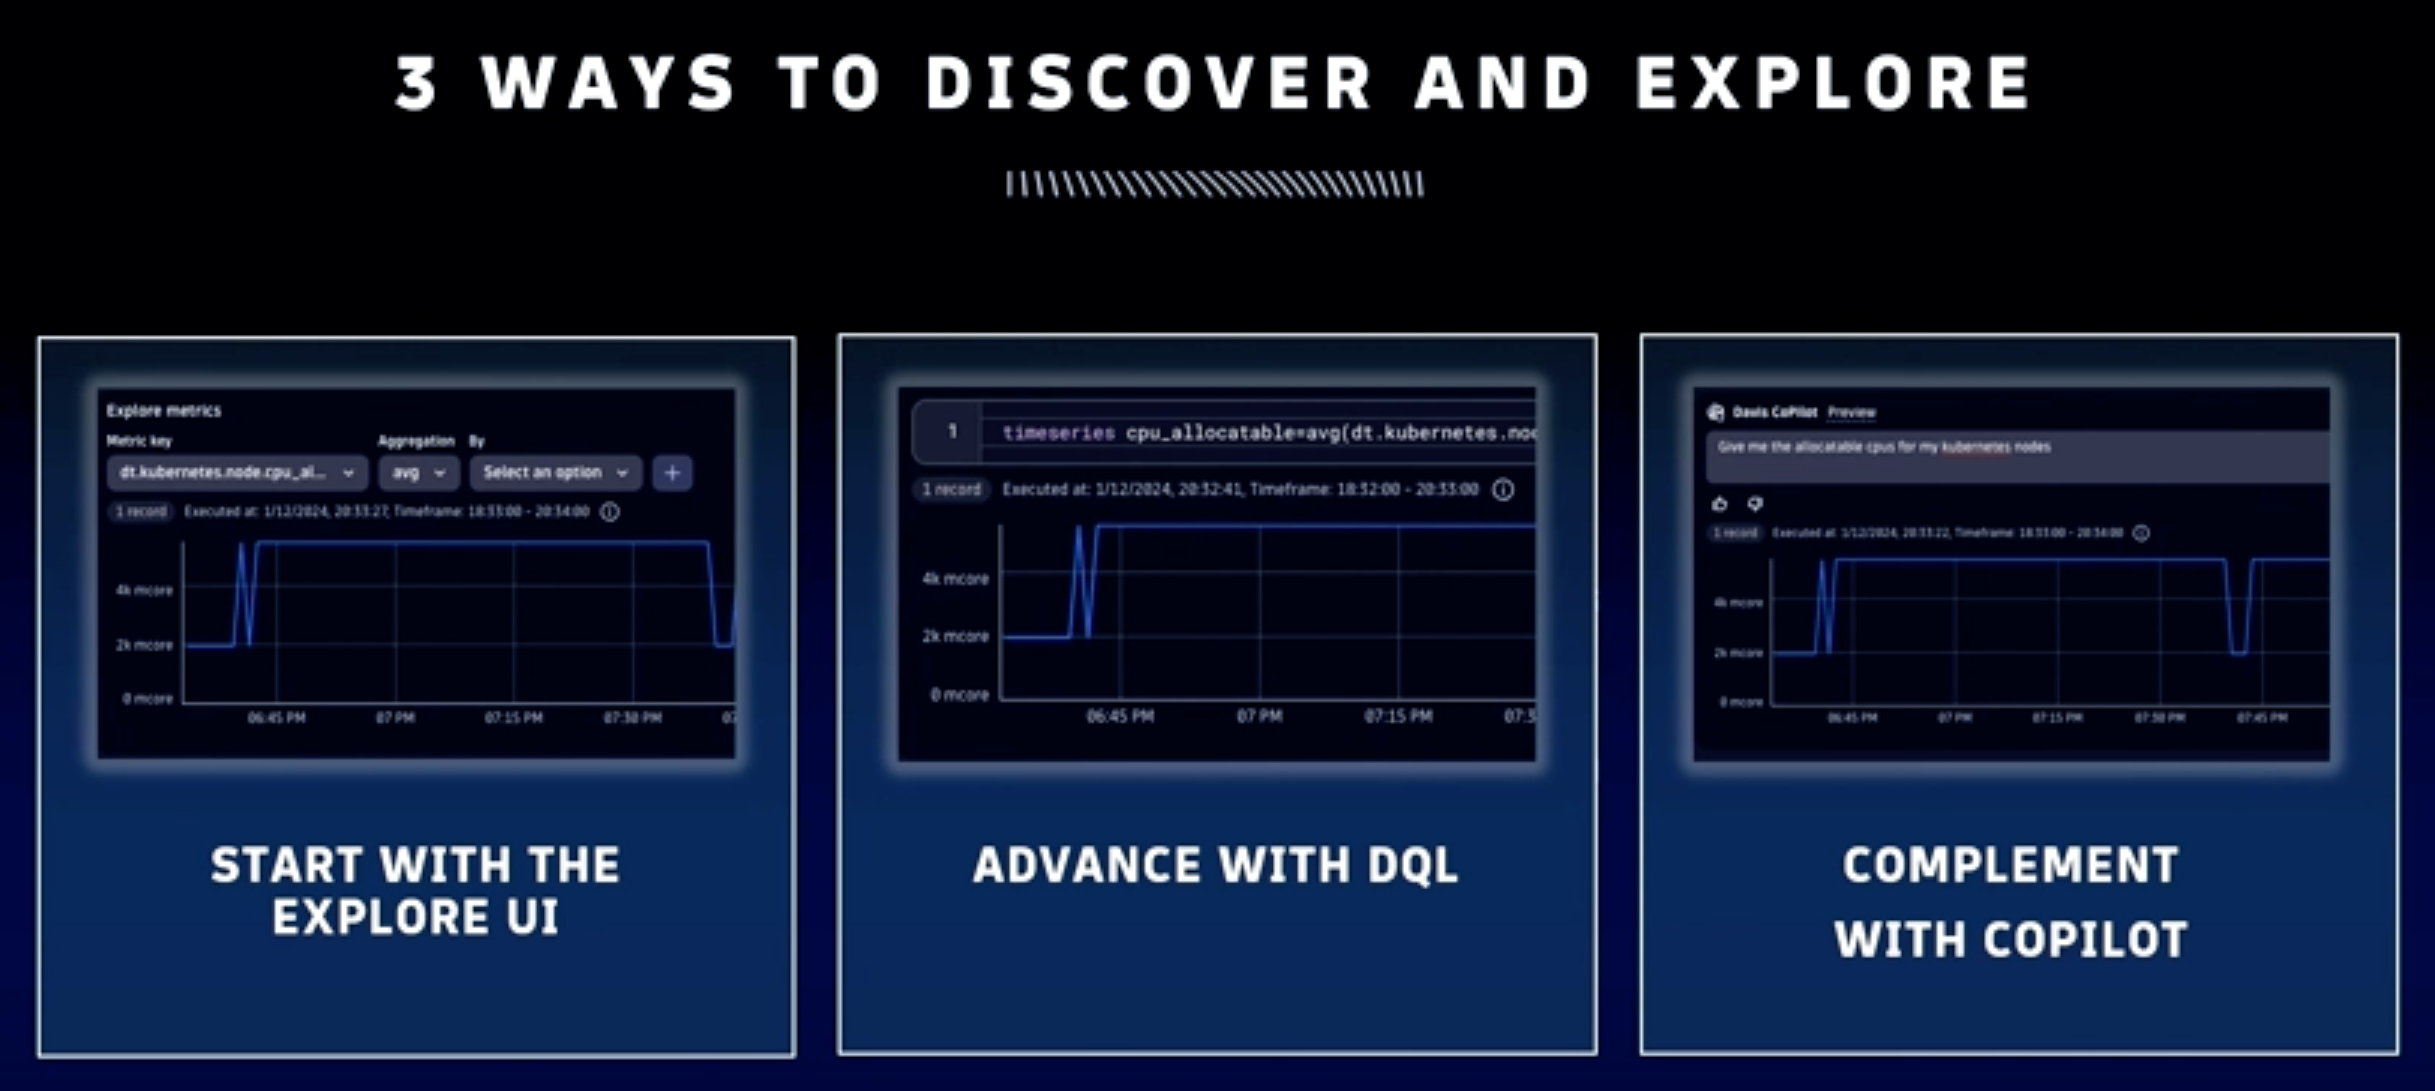
Starting from a dashboard or notebook using the “Explore data” interface to cover simple data exploration routines, analysts can advance their inquiries in Grail using DQL. With a combination of AI techniques—generative AI using data verified by predictive and causal AI—Davis CoPilot enables analysts to further refine complex explorations using natural language queries.


Looking for answers?
Start a new discussion or ask for help in our Q&A forum.
Go to forum