
How Java Garbage Collection Works
Chapter: Memory Management

Java Memory Management, with its built-in garbage collection, is one of the language's finest achievements. It allows developers to create new objects without worrying explicitly about memory allocation and deallocation, because the garbage collector automatically reclaims memory for reuse. This enables faster development with less boilerplate code, while eliminating memory leaks and other memory-related problems. At least in theory.
Ironically, Java garbage collection seems to work too well, creating and removing too many objects. Most memory-management issues are solved, but often at the cost of creating serious performance problems. Making garbage collection adaptable to all kinds of situations has led to a complex and hard-to-optimize system. To wrap your head around garbage collection, you need first to understand how memory management works in a Java Virtual Machine (JVM).
How Java Garbage Collection Really Works
Many people think garbage collection collects and discards dead objects. In reality, Java garbage collection is doing the opposite! Live objects are tracked and everything else designated garbage. As you'll see, this fundamental misunderstanding can lead to many performance problems.
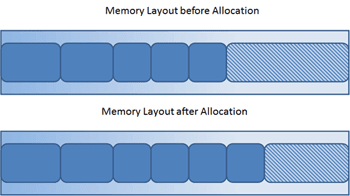
Let's start with the heap, which is the area of memory used for dynamic allocation. In most configurations the operating system allocates the heap in advance to be managed by the JVM while the program is running. This has a couple of important ramifications:
- Object creation is faster because global synchronization with the operating system is not needed for every single object. An allocation simply claims some portion of a memory array and moves the offset pointer forward (see Figure 2.1). The next allocation starts at this offset and claims the next portion of the array.
- When an object is no longer used, the garbage collector reclaims the underlying memory and reuses it for future object allocation. This means there is no explicit deletion and no memory is given back to the operating system.
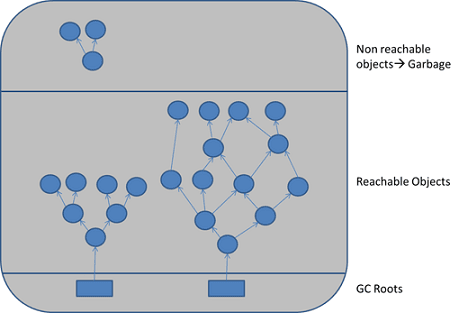
All objects are allocated on the heap area managed by the JVM. Every item that the developer uses is treated this way, including class objects, static variables, and even the code itself. As long as an object is being referenced, the JVM considers it alive. Once an object is no longer referenced and therefore is not reachable by the application code, the garbage collector removes it and reclaims the unused memory. As simple as this sounds, it raises a question: what is the first reference in the tree?
Garbage-Collection Roots—The Source of All Object Trees
Every object tree must have one or more root objects. As long as the application can reach those roots, the whole tree is reachable. But when are those root objects considered reachable? Special objects called garbage-collection roots (GC roots; see Figure 2.2) are always reachable and so is any object that has a garbage-collection root at its own root.
There are four kinds of GC roots in Java:
- Local variables are kept alive by the stack of a thread. This is not a real object virtual reference and thus is not visible. For all intents and purposes, local variables are GC roots.
- Active Java threads are always considered live objects and are therefore GC roots. This is especially important for thread local variables.
- Static variables are referenced by their classes. This fact makes them de facto GC roots. Classes themselves can be garbage-collected, which would remove all referenced static variables. This is of special importance when we use application servers, OSGi containers or class loaders in general. We will discuss the related problems in the Problem Patterns section.
- JNI References are Java objects that the native code has created as part of a JNI call. Objects thus created are treated specially because the JVM does not know if it is being referenced by the native code or not. Such objects represent a very special form of GC root, which we will examine in more detail in the Problem Patterns section below.
- and reuses it for future object allocation. This means there is no explicit deletion and no memory is given back to the operating system.
Therefore, a simple Java application has the following GC roots:
- Local variables in the main method
- The main thread
- Static variables of the main class
Marking and Sweeping Away Garbage
To determine which objects are no longer in use, the JVM intermittently runs what is very aptly called a mark-and-sweep algorithm. As you might intuit, it's a straightforward, two-step process:
- The algorithm traverses all object references, starting with the GC roots, and marks every object found as alive.
- All of the heap memory that is not occupied by marked objects is reclaimed. It is simply marked as free, essentially swept free of unused objects.
Garbage collection is intended to remove the cause for classic memory leaks: unreachable-but-not-deleted objects in memory. However, this works only for memory leaks in the original sense. It's possible to have unused objects that are still reachable by an application because the developer simply forgot to dereference them. Such objects cannot be garbage-collected. Even worse, such a logical memory leak cannot be detected by any software (see Figure 2.3). Even the best analysis software can only highlight suspicious objects. We will examine memory leak analysis in the Analyzing the Performance Impact of Memory Utilization and Garbage Collection section, below.
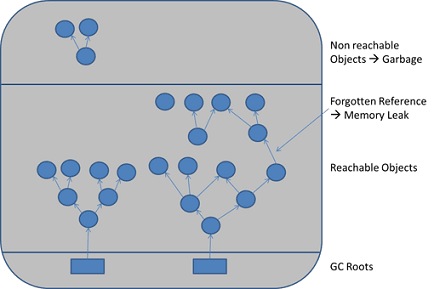
Table of Contents
Application Performance Concepts
Memory Management
How Java Garbage Collection Works
The Impact of Garbage Collection on application performance
Reducing Garbage Collection Pause time
Making Garbage Collection faster
Not all JVMS are created equal
Analyzing the Performance impact of Memory Utilization and Garbage Collection
The different kinds of Java memory leaks and how to analyze them
High Memory utilization and their root causes
Classloader-releated Memory Issues
Performance Engineering
Virtualization and Cloud Performance
Try it free
