
After our AI-Driven DevOps webinar with Anil from Verizon Enterprise I got into a debate with my colleague Dave Anderson on how to call the auto mitigation approach we discussed during the webinar: Is it “auto mitigation”, “auto remediation” or shall we be bold and call it “self-healing”?
Instead of getting caught up on terminology I thought to write this blog post and explain our thoughts and let you decide on what you think we should be calling it.
Here is the animated slide from our webinar that started the discussion:
Our point of the webinar was that with the Dynatrace AI (Artificial Intelligence) analyzed data, we can trigger and build much smarter Auto Mitigation actions. Here are our thoughts to explain the slide:
- Escalate at 2AM? Dynatrace auto detects the problem and how many end users and service endpoints are impacted and this translates directly to the severity of our escalation process.
- Auto Mitigate! Dynatrace is aware of all important events across all entities involved in the problem. (e.g: network connection issue, critical log message after a configuration change, CPU exhaustion) This allows us to write smarter auto-mitigation steps to address the root cause and not the symptom of the problem!
- Update Dev Ticket! If the mitigation actions work, we can automatically update the Jira ticket about the executed actions and in the daily stand-up, developers can discuss what happened last night.
- Mark Bad Commits! If the mitigation actions didn’t solve the problem, we still have the option to rollback and mark the responsible Pull Request as BAD and Detailed Analysis can be done in the post-mortem retrospective!
- Escalate as last resort! If rolling back doesn’t solve the situation, it’s time to definitely escalate – even at 2AM!
Auto Mitigation Implementation with AWS Lambda
Inspired by the work that my colleague Alois Reitbauer did around Auto-Mitigation in the last couple of months, we sat down with our easyTravel Demo Team. easyTravel – in case you’ve never heard of it – is our #1 application we use to demo the capabilities of Dynatrace Fullstack Monitoring and the Dynatrace AI. It is also available for anyone to download and install.
easyTravel comes with many different components, services and some built-in problem patterns, that can be enabled or scheduled, on demand or via REST. easyTravel was also recently enhanced to scale up and down, individual dockerized components, such as the backend service.
Rafal Psciuk, Team Lead in our Gdansk office, thought about good auto-remediation use cases, just in case something goes wrong with easyTravel. He implemented two use cases which he recently demoed to me and I found it just “AWSome.” 😊 With the following explanation, I hope it inspires you to combine Dynatrace AI detected problems with your automation tools to implement auto-mitigation, auto-remediation or self-healing (or whatever you want to call it 😊).
As we host easyTravel in AWS, Rafal decided to leverage AWS Lambda to automate mitigation. He wrote Lambda functions Dynatrace triggers when a problem gets detected. The function then analyzes the actual problem, all its correlated events and issues course correcting actions, depending on the actual root cause of the problem. These actions can range from restarting processes, scaling up or down docker containers, rerouting traffic, running cleanup or database scripts.
Here is the schematic overview of what happens when Dynatrace AI detects a problem:

Process Crash: Restart Process
The first use case is a simple, but very common use case. Dynatrace AI detected a JavaScript error rate increased to 94%, impacting 713 real user actions per minute. Dynatrace AI detected the root cause of this error to be a crash of a CouchDB process which is used by Tomcat (Application Server) to serve all dynamic page requests:
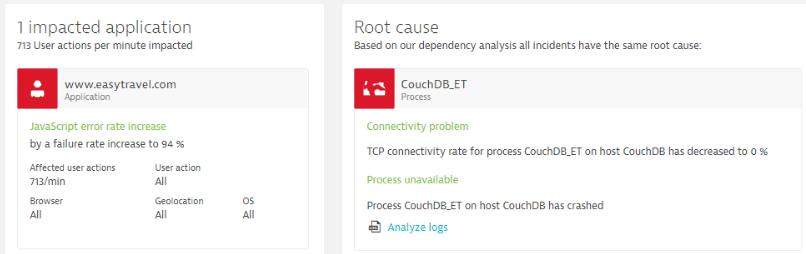
One would normally not suspect the correlation of a spike in JavaScript Errors to a CoucheDB process crash. Thanks to Dynatrace OneAgent (FullStack Data), Smartscape (Automated Dependency Model) and the AI engine (Anomaly Detection) the root cause was automatically detected.
We can leverage this information to our advantage and build smarter mitigation scripts. Here are some additional thoughts on this problem pattern:
#1 – Restart Process: If we see a crash of a back-end process that is impacting our end users or any type of SLA (Service Level Agreement) we have to try to restart that process. We do have all the information which process is impacted and where that process normally runs.
#2 – Prevent Future Process Crashes: Besides knowing which process, on which machine crashed, Dynatrace also captures any critical log message, deployment or configuration change event that preceded the crash. (e.g: an update to CouchDB was deployed 5 mins prior or there was a connection pool configuration change leading to too many incoming connections causing the crash). Knowing more about what caused the crash allows us to not just restart the process and see it crash again soon after, but it also allows us to solve the problem that caused it to crash in the first place.
Our AWS Lambda Mitigation Function
Here are parts of the AWS Lambda function that Rafal implemented. First, he parses the incoming problem details and then processes the event based on whether it matches the problem pattern he is handling:
exports.handler = function(event, context, callback) {
var parsedEvent = parseEvent(event);
if (!isCorrectProblem(parsedEvent)) {
callback(null, { "Not a valid problem": "true" });
} else {
processEvent(parsedEvent, callback);
}
};
function parseEvent(event) {
console.log('Loading event');
console.log(event);
var parser = new EventParser(event);
var parsedEvent = {
hasApplication: parser.hasApplication('www.easytravel.com'),
hasProcess: parser.hasProcess('CouchDB_ET'),
isOpen: parser.isOpen(),
problemId: parser.getProblemId()
};
console.log("isOpen: " + parsedEvent.isOpen + " hasApplication: " + parsedEvent.hasApplication + " hasProcess: " + parsedEvent.hasProcess);
return parsedEvent;
}
If he needs more data from Dynatrace, he simply queries the Dynatrace REST API to access deployment events, timeseries or Smartscape information. Based on the information in the problem details and event history reaches out to the easyTravel Orchestration Engine to restart CouchDB.
function processEvent(parsedEvent, done) {
if (parsedEvent.isOpen) {
console.log("Resolving problem");
disablePlugins(parsedEvent, done);
} else {
console.log("Send resolved comment");
addProblemResolvedComment(parsedEvent.problemId, done);
}
}
function disablePlugins(parsedEvent, done) {
var error = {
couchErr: null,
javaScriptErr: null
};
disablePlugin(couchDBPlugin, function(couchErr) {
error.couchErr = couchErr;
disablePlugin(javascriptErrorsPlugin, function(javaScriptErr) {
error.javaScriptErr = javaScriptErr;
disablePluginCallback(parsedEvent, error, done);
});
});
}
The Lambda function also puts a comment on the Dynatrace Problem to indicate when the function started to mitigate the problem and when it eventually solved the problem! All of this is neatly documented when looking at the Dynatrace Problem history!
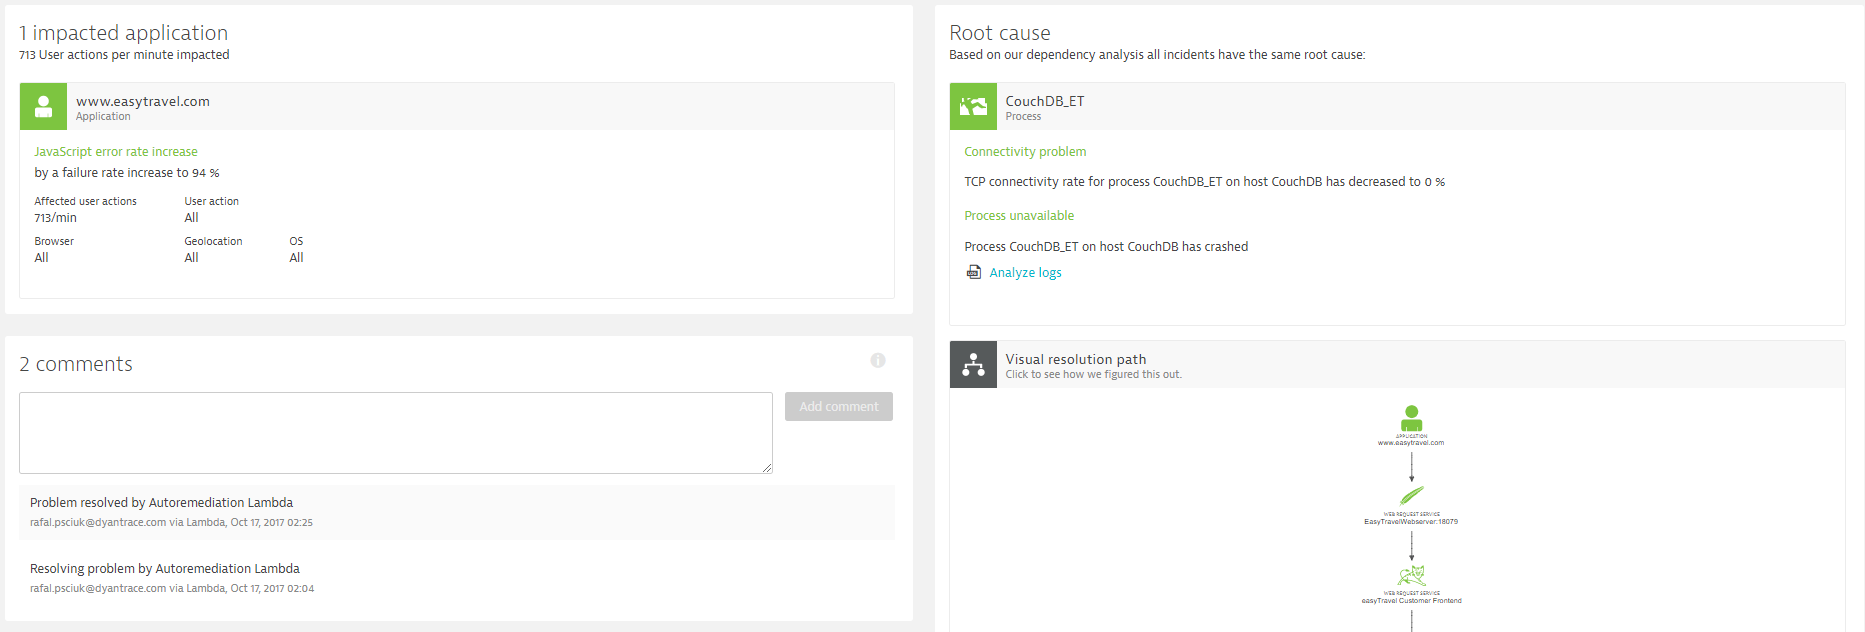
The key point in this use case is that we can quickly react to a situation where a critical process crashes. We know which process it is and we also know which impact it currently has.
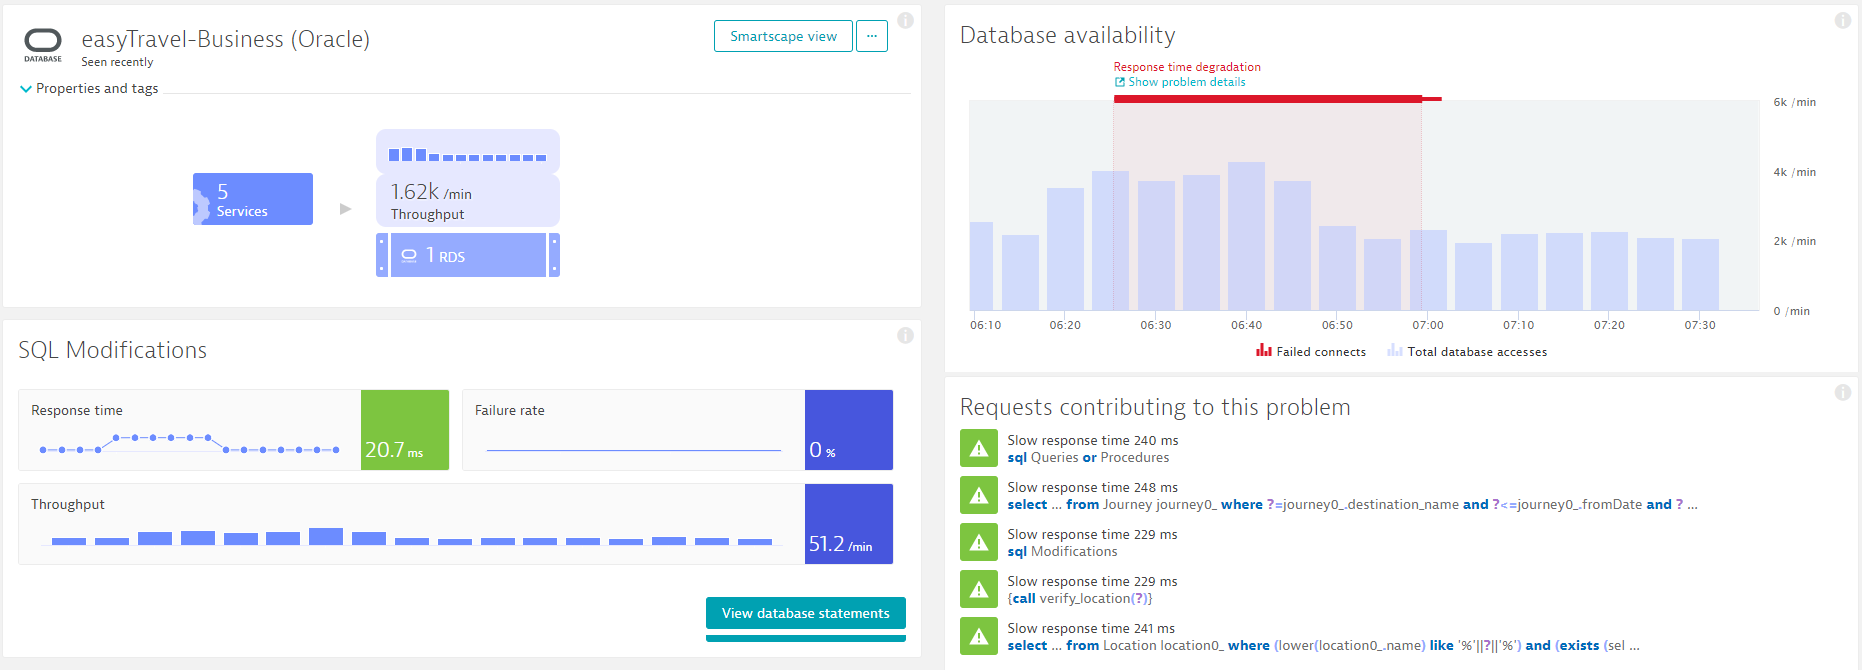
Slow Database impact Microservices: Increase Microservice Capacity
The second use case is one we keep seeing more frequently with architectures leveraging microservices that share resources such as a back-end service or database.
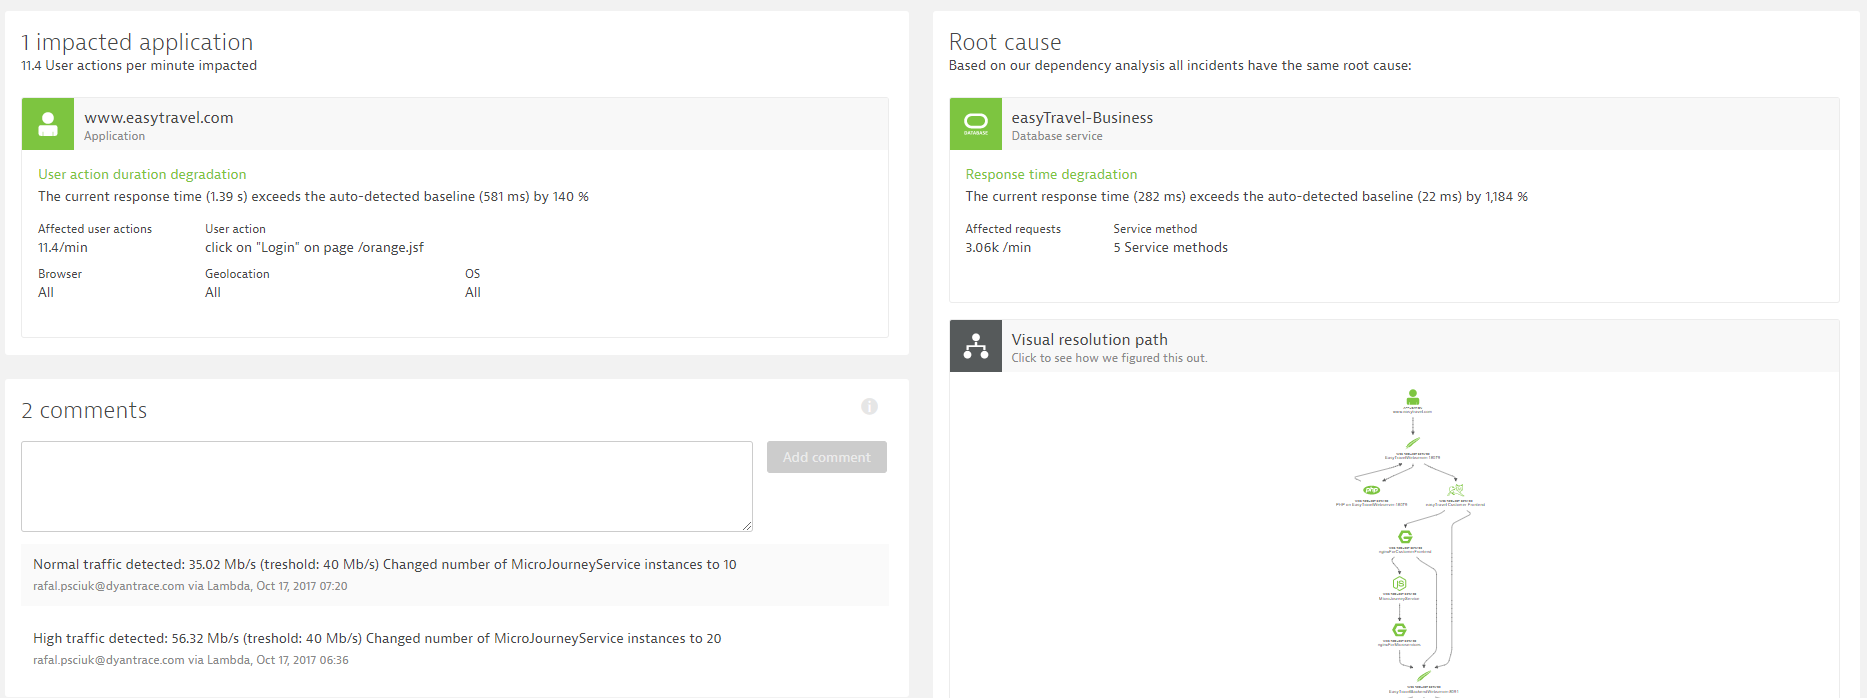
The first observation is that the database is the problem and therefore, it has to be fixed. A closer look at all the details Dynatrace captured, shows us that the slow down came from a high number of UPDATE statements executed by one of the 5 services that share this database. It was basically a batch job that somebody had triggered, impacting all other services that use that database.
All other services had to wait much longer for database responses, which meant that their threads were blocked and couldn’t accept newly incoming requests fast enough.
Knowing these details about the database activity and impact, we have different options (and probably more than these listed) to mitigate this problem:
#1 Throttle Batch Service: Depending on how important the batch job is, we could give it lower priority and slow down its execution of SQL updates.
#2 Temporarily Increase or deploy Cache Layer for Read Only Use Cases: While these UPDATEs run, switch your front-end services to access a cached data set instead of hitting the database. And change that route once updates are completed. While this means that users may see slightly outdated data for a couple of minutes, it prevents the performance impact.
#3 Scale front-end services: If service requests are slowed down due to a slow database, it means you may run into capacity issues, leading to not only very slow requests, but rejected requests. In that case, we could simply scale up instances of the front-end services until the database is back to normal speed. The same approach is valid if we would see an increase in end user requests – we can simply scale that tier and dependent tiers to handle the new load patterns.
Our AWS Lambda Mitigation Function
In this use case, Rafal implemented an extended version of the mitigation function that executes remediation actions based on the details that Dynatrace is pushing as part of the Problem Notification Integration. Rafal’s Lambda function additionally queried the Dynatrace Problem and Timeseries API, to learn more about traffic patterns on both front-end, as well as other services that access that problematic database. He was automating what a human would do as well by pulling in more information to make smarter decisions!
Rafal ended up implementing the mitigation function to temporarily scale up the number of front-end microservice instances that supported the login page. That opened up more worker threads for incoming requests from people hitting the login page. This mitigated the problem, as users could access the login page without a major performance impact or even error pages.
Here is the Problem Evolution replay of this use case – showing how the Dynatrace AI not only detects the problem, but also detects when it was mitigated / solved:
The Lambda function also puts a more detailed comment on the Dynatrace Problem to indicate WHICH situation was detected (high database traffic) and how it solved the problem!

The key revelation of this use case is that just treating this as a database issue would probably result in suboptimal responses. (e.g: fixing the problem on the database level and not on the service that causes the problem). With the AI, we can execute much better and automated remediation actions.
Auto-Mitigation, Auto-Remediation or Self-Healing! What is it?
Reading my own blog (before publishing), shows me that even I used all three terms throughout the blog 😊 – well – whatever we call it. I believe it is the way we have to think about automating problem resolution. Gone are the days where we are always getting people on bridge calls, spending time to find out who is to blame and how to actually fix the problem. We now have better data (OneAgent), automatic dependencies (Smartscape), anomaly detection (baselining, machine learning and domain knowledge) and a REST API that allows us to automatically react to the actual root cause. This will reduce MTTR (Mean Time To Repair) drastically!


Looking for answers?
Start a new discussion or ask for help in our Q&A forum.
Go to forum