
Virtualization's Impact on Performance Management
Chapter: Virtualization and Cloud Performance

PaaS and SaaS go one step further and outsource parts of the application itself, putting ever more focus on our core business and core application while depending even more on third-party black-box services. Therefore, APM comes into its own in the cloud. In the next section we'll look at the implications of virtualization on performance management.
Think about it. Each virtualized operating system, or guest, is hosted inside a virtual machine, and multiple guests share the same hardware, though none has exclusive access. This sleight of hand is managed by the hypervisor, which provides the virtual operating platform for each of the guests.
The hypervisor adds an extra layer on top of the hardware operating system so that it can schedule and route system requests from simultaneously executing applications running on the multiple guests. It's a complex task to ensure that everything gets to the right place at the right time without interference. Doing so efficiently is even harder, which is why there are two important side effects of virtualization:
- The hypervisor adds a measure of overhead to every hardware request. This is typically minimal, but one can only be sure by monitoring the overhead.
- Hardware is shared and finite, and no guest is assured instant access to these resources. Delayed availability of the CPU can cause increased latency, known as steal time, which can seriously degrade performance and scalability in ways that standard utilization metrics are unable to measure. This is true for all resources (I/O, memory, network, and so on), not just CPU.
For the purpose of application performance monitoring, the difficulties associated with virtualization have less to do with the impact of added overhead per se than with measuring this impact on application performance. It's this difficulty that makes hardcore performance people like me suspicious.
Sharing Resources in a Virtual Environment: Setting Priorities and Exaggerating the Truth
Virtual environments, while created in software, can exist only within the physical hardware provided. CPU, memory, disk storage, and network access are shared among the several virtual machines, and each VM is assigned specific resources as needed. Processing appears to execute as it would on any non-virtualized machine, but there are two major differences:
- The number of available resources (CPU, memory, etc.) as seen by the VM are not necessarily physically available.
- The Guest OS does not get exclusive access to assigned resources, which it doesn't know.
Why We Stretch the Truth, and the Impact on Performance
The virtualization software itself requires resources, limiting what's available for the VM. Also, resources are not shared fairly, but are allocated according to preconfigured settings and policies. Most importantly, virtualization is used to achieve better utilization, and overcommitting resources is the most efficient way make this happen.
Let's say we are running five VMs on a machine that has eight CPUs and we assign two CPUs to each VM. As long as the virtual machines are not simultaneously using 100% of their resources, things should run fine. And because we can do a given amount of virtualized work on less physical hardware than we would need for non-virtualized work, our environment is being used more fully and efficiently.
When a system's utilization approaches 100%, the same logical rules that operating systems use for multiple processes are employed: one or more of the VMs must wait. This means that at any specific point, the guest system may not be able to achieve 100% CPU utilization. That is no different than the fact that a process might not get 100% of the available CPU on a regular system.
But there is more. Instead of just assigning the number of CPUs, many virtualization systems can assign a range of GHz to a specific VM (e.g., 1000—2000 GHz). If a VM has used up its share in a given time slice, it has to wait.
And here's the kicker: since the VM is ignorant of this throttling, internal time measurements and calculations of CPU utilization go completely out of whack! CPU utilization at the guest level has a different meaning from one second to the next, or rather, it really has no meaning. I will explain this phenomenon in detail shortly
Why Memory Balloons Can Blow Up Your Performance
Sharing CPU resources is relatively straightforward compared to sharing memory. The utilization strategy is the same: more virtual memory is assigned than is physically available. The virtualization system tracks individual allocations in each guest, as well as total memory utilization for all guests. When physical memory is used up, the next VM allocation can only be made by reclaiming some of the memory in use. This is achieved in two ways:
- The hypervisor transparently swaps a portion of guest memory out of physical memory onto disk. To access the portion swapped out, the hypervisor simply swaps it back in, just like normal OS-level swapping. Problems arise because of indiscriminate swapping at the hypervisor level, which seriously degrades performance; for example, when portions of an active JVM are swapped out. Often, virtualization systems will install a balloon driver to coordinate swapping and alleviate this problem, which leads us to the second method for utilizing memory.
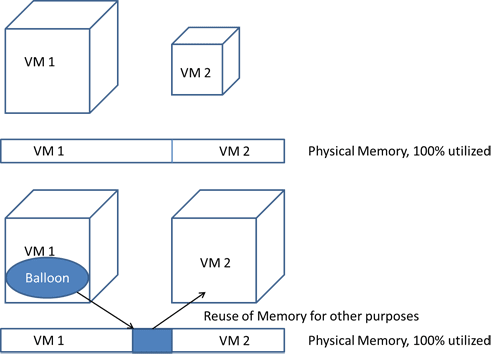
- Ballooning makes the guest operating system aware of the low-memory status of the host. To reclaim memory, the hypervisor gives the balloon driver inside the guest a target balloon size. The driver will then inflate the balloon by allocating guest memory and pinning the underlying memory pages. Pinned pages are not swapped to disk. The hypervisor can then reclaim those pinned pages and reassign them to another VM (Figure 7.1). It can do that because the original guest is not using those physical memory pages. This works quite well, but it also means that a guest with a balloon might be forced to swap out other areas itself. This is preferable because the guest can make an informed decision about what to swap, whereas the hypervisor cannot.
Overcommitting memory leads to better resource utilization because systems seldom need all of their assigned memory. However, too much overcommitting leads to swapping and can degrade performance. This is especially true for Java applications.
Since the JVM accesses all its assigned memory in a random fashion, large portions of assigned memory are accessed throughout the JVM's lifetime. This means that no part of a JVM can be swapped out safely without negatively impacting performance. For this reason, it is essential to understand swapping behavior and the impact this has on applications running within the VM.
Why Running Isolated VMs Hides the Root Cause of Performance Problems
Because resources are shared in virtual environments, VMs, though isolated from each other in terms of memory and access, can nonetheless affect each other in terms of performance (Figure 7.2). This can be problematic because although we can see the impact in terms of performance, the underlying root cause stays hidden.
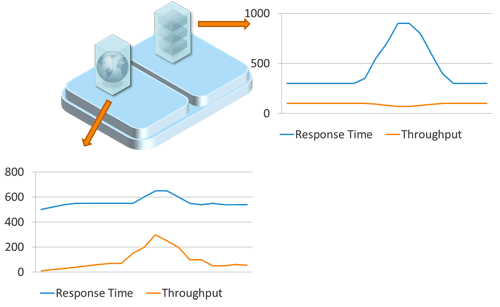
Let's say the load increases on one application to the point where the maximum hardware allocation is met. The VM is either stalled (has to wait), or it begins to steal resources from other VMs running on the same host. This creates a hardware shortage that can cause other VMs to slow down, affecting the responsiveness of other applications running.
Sounds like an obvious enough problem, but it can be very difficult to find the root cause in such a situation. A problem caused by an application running in one VM shows up only in the second VM. Analyzing the application in the second VM fails to identify the hot spot because it's the wrong place to look.
Even worse, in many organizations the team responsible for an application has no knowledge or insight into what else is running on the underlying hardware. To quote a customer, "We only know that something else might be running if the performance numbers look funny."
However, by looking at CPU, memory, and I/O utilization at the virtualization level, we see that the first VM's CPU usage is increasing while the second VM's is decreasing. At the same time, the hypervisor reports CPU steal time for the second VM, which we see is also waiting for CPU resources. To understand what is really going on, we need to correlate the performance measurements from both applications using monitoring data at the hypervisor layer.
What Tricky Time Measurement in a VM Means for APM
Einstein told us that time is relative. He might have been talking about virtualization. But in a VM, time is relative and has holes.
The timekeeping problem is well known in the VMWare community. It results from de-scheduling VMs without acknowledgement and is compounded by the archaic PC timer architecture, unchanged since the early '80s.
A VMWare whitepaper explains this in some detail. However, it doesn't discuss other virtualization solutions, such as Xen, KVM, and Hyper-V, that attempt to solve this problem in different ways. But since various guest operating systems behave differently, time measurement inside a guest is not to be trusted.
When the hypervisor suspends a guest system, it is like an OS suspending one process to execute another. But whereas the OS is responsible for timekeeping, the guest system won't usually know when it is suspended and can't account for this when tracking time.
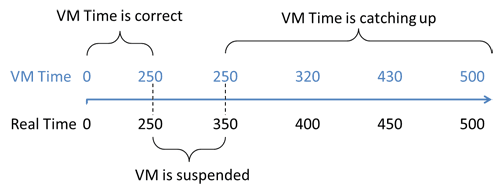
Windows and Linux systems track time by counting the periodically triggered Interrupts. A suspended guest can't count Interrupts as none are triggered, and thus it quickly falls behind real time (Figure 7.3). To fix this, the hypervisor records Interrupts and replays them when the VM is resumed. This ensures that the time in the guest keeps up with real time, but it leads to another problem. After resuming, a lot of queued interrupts are processed in quick succession. Because the Interrupts represent time slices, time effectively speeds up!
As a smoothly running system would never suspend a guest for more than tenths or even hundredths of a millisecond, this represents a fine solution for most day-to-day applications. But it is a big problem for monitoring and detailed performance analysis, for two reasons:
- Measured response times in a VM cannot be trusted on a millisecond granularity.
- Method-level performance analysis is a problem because a method might appear to be more expensive (suspension or catchup) than it actually is.
Modern Linux systems and para-virtualizing solve the speedup problem by using tickless timers. A tickless timer does not need periodic interrupts to function; thus there is no catchup problem. For other systems, hypervisors often provide separate virtualization-aware times that our monitoring tool can use. Such systems allow near-accurate measurement of response time. However this still leaves us with the suspension and its impact on method-level analysis.
The suspension problem can be solved by correlating the suspension times with the performance measurement, thus accounting for it. This is very similar to correlating garbage-collector suspensions with the method-execution times. The easiest way to do this is to look at CPU ready time (VMware) or CPU steal time (Xen, Amazon EC2) as reported by the hypervisor or para-virtualized guest.
There is one additional timekeeping issue, which renders our inability measure time accurately essentially unimportant—the implications for system monitoring.
Why System Metrics in the Guest Are Not Trustworthy
APM and monitoring solutions can use virtualization-aware timers and take steal time into account, at least for their own measurements. The guest OS is not doing this! Its time tracking is flawed and that has serious side effects on all system metrics that depend on a time, meaning all utilization (percentage) and rate measures (e.g., requests/second).
For example, CPU utilization is calculated based on CPU cycles available and used within a given timeframe. As the guest system doesn't get the time right, the calculated CPU utilization is simply wrong. The guest cannot deal with the fact that it was not running during the suspension. It even thinks that it and some of its processes consumed CPU resources during suspension (remember, it doesn't know that it wasn't running). VMware and others deal with this by telling the guest system that a special dummy process was running during that time frame. Or they might tell it to account for it under a different metric—e.g., steal time. By doing this they ensure that any CPU usage of process in a guest is mostly accurate, but the CPU utilization (on the guest and process levels) is not!
Here we have the solution to the conundrum. Instead of trusting the CPU utilization we must turn to CPU usage and time measurements at the application level. Not only do the virtualization systems try to ensure that CPU usage (not utilization!) is accurate on the process level, but our application performance can measure steal time and CPU usage at the hypervisor level and correlate this correctly to our application measurements. That brings us to the main subject—how to monitor applications in virtualized environments, discussed in the next section.
Table of Contents
Application Performance Concepts
Memory Management
How Java Garbage Collection Works
The Impact of Garbage Collection on application performance
Reducing Garbage Collection Pause time
Making Garbage Collection faster
Not all JVMS are created equal
Analyzing the Performance impact of Memory Utilization and Garbage Collection
The different kinds of Java memory leaks and how to analyze them
High Memory utilization and their root causes
Classloader-releated Memory Issues
Performance Engineering
Virtualization and Cloud Performance
Try it free
