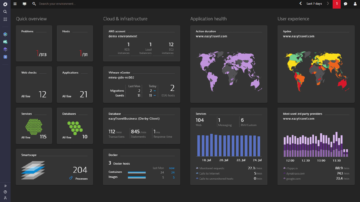
Top 3 reasons people choose Dynatrace over Cisco AppDynamics and New Relic
1
The broadest depth and widest scope
Advanced observability in context, so you get the complete picture of every app, every user, across every cloud, down to code-level, traces, metrics, logs, and metadata.
2
Smarter with AI-Assist
Davis®, the Dynatrace AI-assistant, provides real-time answers and actions into root cause, behavioral intelligence, and business impact. Just install it and try it for yourself, if you can get both started, which brings us to the next point.
3
Simpler and easier
Automatic deployment, configuration, thresholds, dashboards, upgrades. Dynatrace was designed to make it easy for all BizDevOps teams to collaborate through a single source of truth. Just compare how long it takes to install both platforms. It isn’t comparable.
Compare Dynatrace, AppDynamics and New Relic
The difference is clear
Dynatrace
AppDynamics
New Relic
Advanced observability
Dynatrace
Beyond 3 pillars of metrics, traces and logs with user experience data, auto instrumentation, and designed to automatically adjust for dynamic workloads across every cloud platform, containers, microservices and Kubernetes.
AppDynamics
Manual config and instrumentation for data collection and dynamic workloads wastes time and resources on redundant work. Not built for Kubernetes, OpenShift, Cloud Foundry, etc. resulting in big blind spots.
New Relic
Manual config and instrumentation for data collection and dynamic workloads wastes time and resources on redundant work. Not built for Kubernetes, OpenShift, Cloud Foundry, etc. resulting in big blind spots.
Beyond 3 pillars of metrics, traces and logs with user experience data, auto instrumentation, and designed to automatically adjust for dynamic workloads across every cloud platform, containers, microservices and Kubernetes
Manual config and instrumentation for data collection and dynamic workloads wastes time and resources on redundant work. Not built for Kubernetes, OpenShift, Cloud Foundry etc. resulting in big blind spots
Manual config and instrumentation for data collection and dynamic workloads wastes time and resources on redundant work. Not built for Kubernetes, OpenShift, Cloud Foundry, etc. resulting in big blind spots.
Manual agent deployment, manual dependency connections, and manual troubleshooting wastes limited time and resources
AI-Assistance
Dynatrace
Davis, AI-assistance, continually learns so there are no wasted resources even as environment changes. Solves precise root cause automatically, prioritized by business impact – acting as a force multiplier for your teams and enabling you to focus on what matters without wasting time
AppDynamics
Correlation-based data engine, with no root cause, means wasting time and resources to comb through the data and manually find issues and their causes
New Relic
Correlation-based data engine, with no root cause, means wasting time and resources to comb through the data and manually find issues and their causes
Davis, AI-assistance, continually learns so there are no wasted resources even as environment changes. Solves precise root cause automatically, prioritized by business impact – acting as a force multiplier for your teams and enabling you to focus on what matters without wasting time
Correlation-based data engine, with no root cause, means wasting time and resources to comb through the data and manually find issues and their causes
Cross-team Collaboration
Dynatrace
All-in-one platform provides a single source of truth across APM, infrastructure monitoring, digital experience, and business analytics – breaks down silos and enables easier collaboration across Biz/Dev/Ops teams
AppDynamics
Siloed tools with a separate, newer platform layered on top of old platform means your teams are not on the same page, and you have to waste time and resources to stitch across disparate tools to get anything done
New Relic
Siloed tools with a separate, newer platform layered on top of old platform means your teams are not on the same page, and you have to waste time and resources to stitch across disparate tools to get anything done
All-in-one platform provides a single source of truth across APM, infrastructure monitoring, digital experience, and business analytics – breaks down silos and enables easier collaboration across Biz/Dev/Ops teams
Siloed tools with a separate, newer platform layered on top of old platform means your teams are not on the same page, and you have to waste time and resources to stitch across disparate tools to get anything done
Omni-channel User Experience & Business Analytics
Dynatrace
Single data model across every digital channel that automatically ties together full-stack performance, user experience and business metrics, creating an outside-in perspective for better business outcomes. Shared business context empowers IT and business teams to prioritize and take the initiative to optimize and fix issues before they impact users
AppDynamics
Siloed tools across web and mobile channels, with no linkages to business metrics. You have to burn resources and time to bridge the silos between digital channels and manually tie to biz impact and fix issues
New Relic
Siloed tools across web and mobile channels, with no linkages to business metrics. You have to burn resources and time to bridge the silos between digital channels and manually tie to biz impact and fix issues
Single data model across every digital channel that automatically ties together full-stack performance, user experience and business metrics, creating an outside-in perspective for better business outcomes. Shared business context empowers IT and business teams to prioritize and take the initiative to optimize and fix issues before they impact users
Siloed tools across web and mobile channels, with no linkages to business metrics. You have to burn resources and time to bridge the silos between digital channels and manually tie to biz impact and fix issues
“When we started at Kroger we had a different monitoring solution, that we had dealt with for the last five years, and I'm not going to name drop but it was not as ‘dynamic’ as they said that it should be”
Jay Cotton
“We were using New Relic, but we never got the full picture of our production environment”
Mark Kaplan
Positioned furthest for Completeness of Vision
2022 Gartner® Magic Quadrant™ for APM and Observability
Dynatrace has been named a Leader among products in Application Performance Management (APM). These user ratings reflect the advantage of Dynatrace’s all-in-one-platform, which was made for IT, DevOps, and digital experience use cases, and built on a unified data model to enable increased automation and intelligence.
While most of the big vendors have spent their time trying to patch and upgrade their way to the needs of today, Dynatrace went back to the drawing board and created something special for today’s needs.”
Larry Roberts, Senior Systems Administrator, SRE, Architect - Gordon Food Service
A gamechanger in monitoring and operations. The unique approach to provide full-stack visibility, not only focusing on one aspect but covering everything that is of interest for a modern cloud operation, driven by a DevOps culture. The scale and automation at which Dynatrace can be applied is unmatched.”
Reinhard Weber, Senior Product Manager - SAP CX
Discover more
2022 Gartner®️ Critical Capabilities for APM and Observability