
Real User Monitoring (RUM) is one of the building blocks of Dynatrace Digital Experience Monitoring and the only way to monitor your users’ experience. Another building block is Synthetic Monitoring, which adds two additional and important use cases that are hard to cover with RUM.
- Availability monitoring—Is my application working 24 x 7?
- Performance baseline monitoring—Did my performance baseline change (based on a clean-room environment)?
When talking to Dynatrace customers who only leverage RUM, we find they usually agree that Synthetic monitoring adds tremendous value to RUM. However, the next question is often, “How do I get started with Synthetic monitoring”?
24×7 monitoring from three locations with a single click
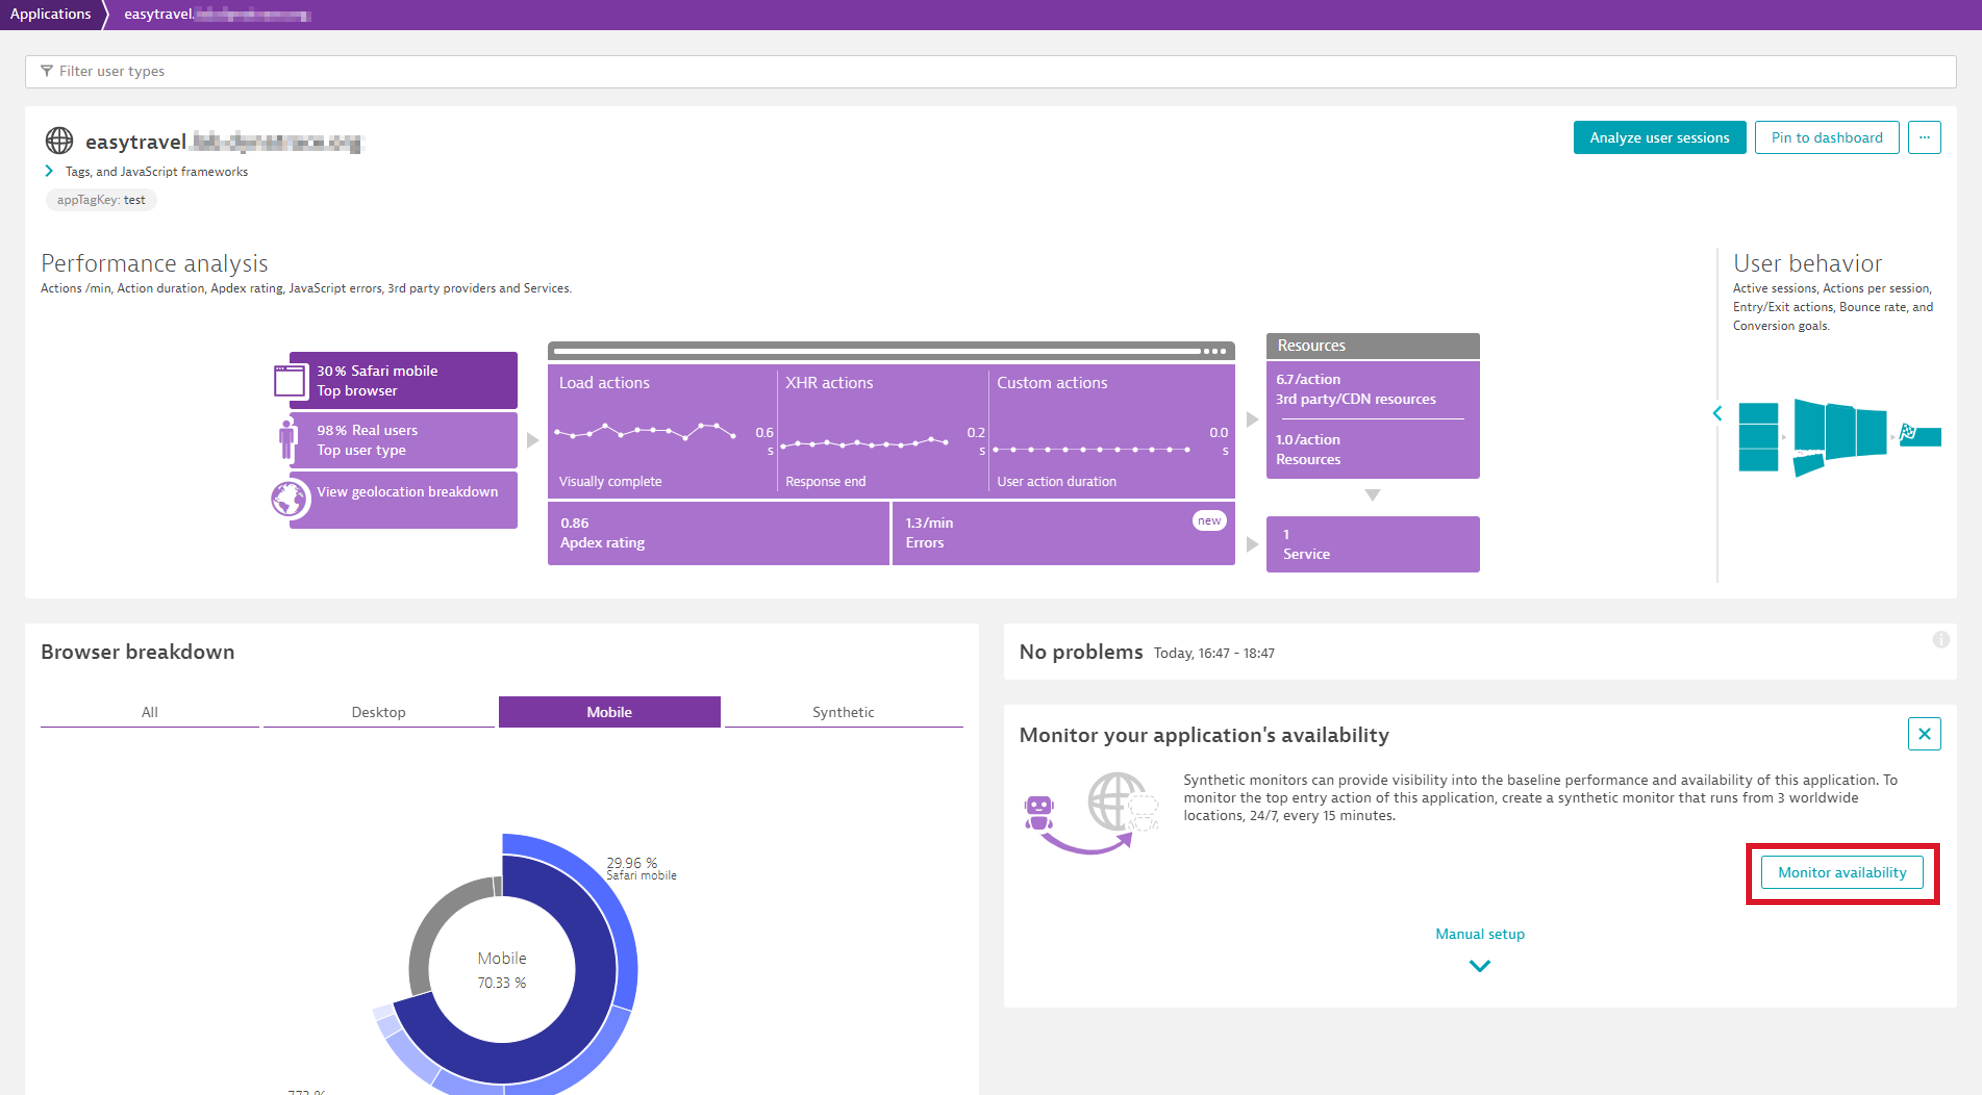
With the latest release of Dynatrace, we’ve made it super easy to start monitoring your application’s availability using synthetic monitors. You’ll see an extra card (Monitor your application’s availability) on the application overview page. Just select Monitor availability and you‘re done!
The main entry points of your application are now actively monitored 24×7 from three locations worldwide.
Customize automatically created monitors, add new locations, and more
When you select Monitor availability, Dynatrace takes the top three entry actions of your application and automatically creates synthetic monitors for them in the background. An entry action is the first action of a user session. By selecting the top three entry actions, your users’ most frequent entry points to your application are covered.
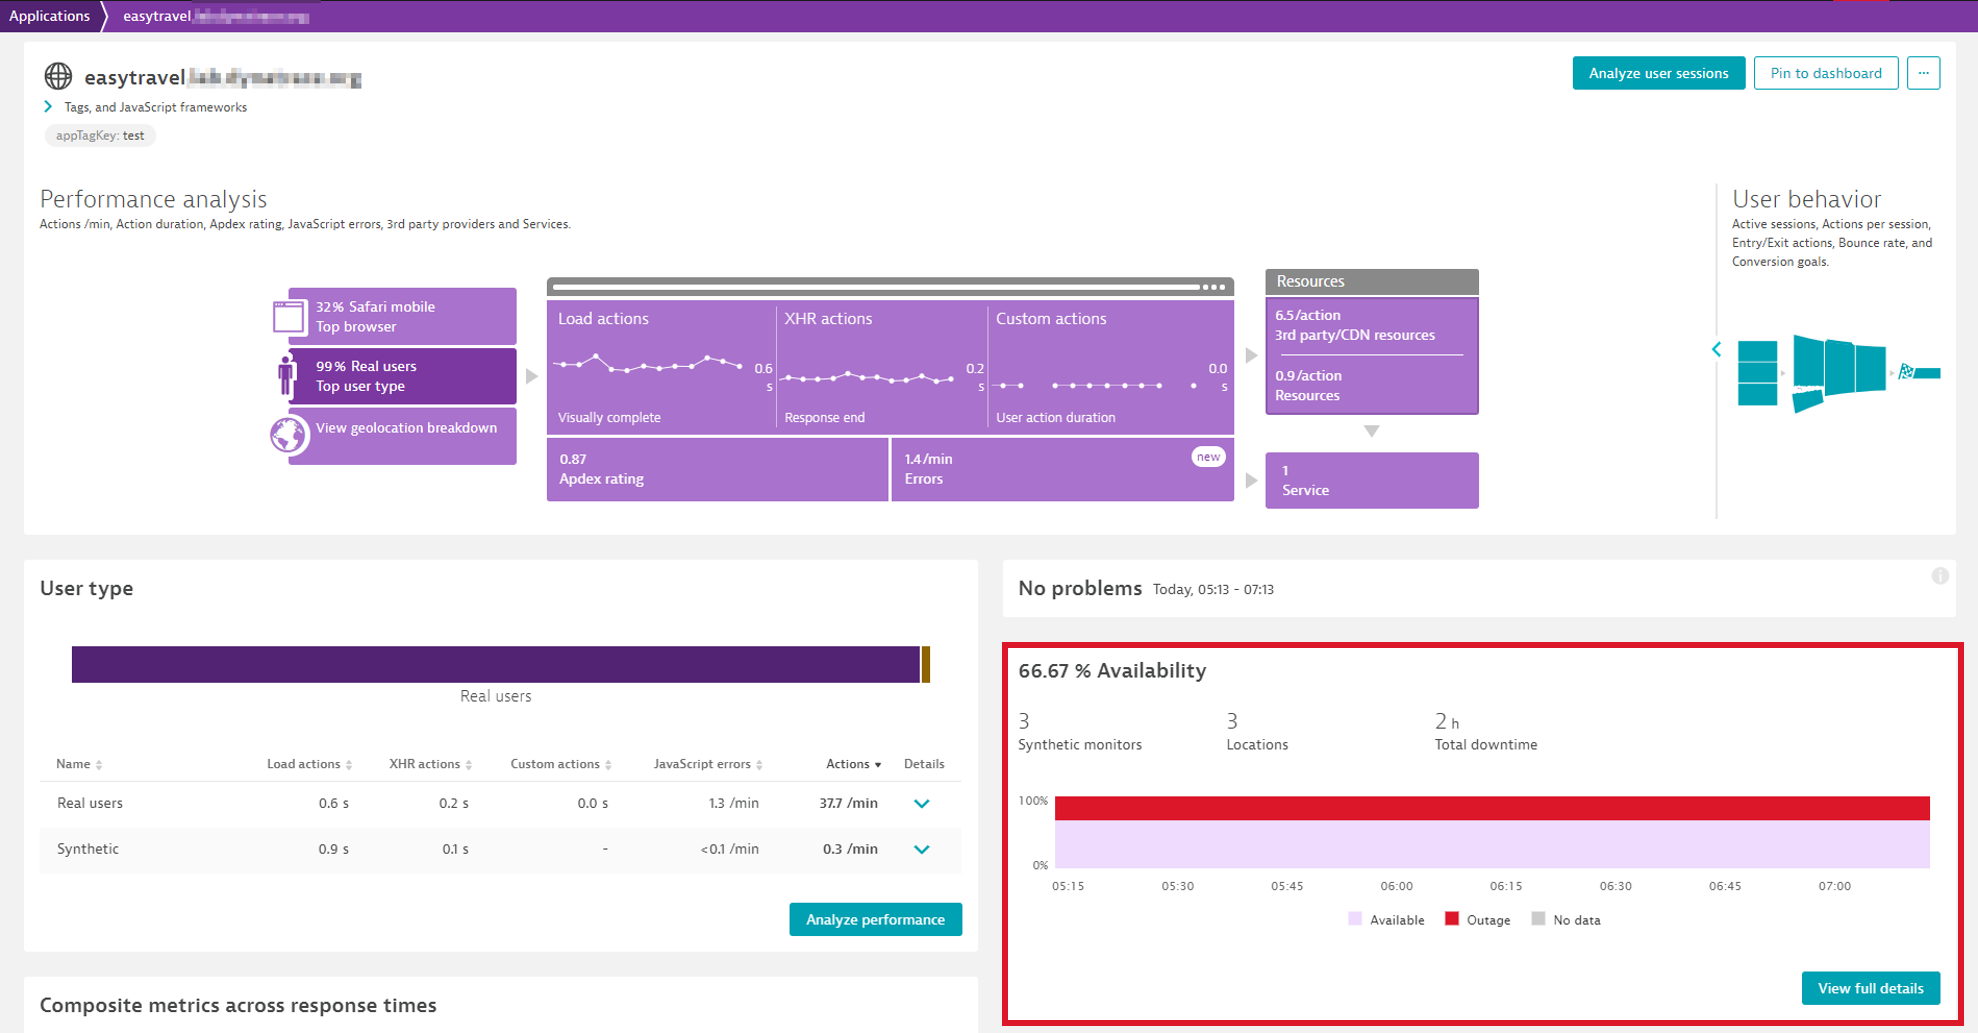
The generated monitors are configured to run from three automatically selected locations to provide geographical coverage and are executed every 15 minutes. The image below shows the Availability card on the application overview page after you have opted to automatically configure the three synthetic monitors.
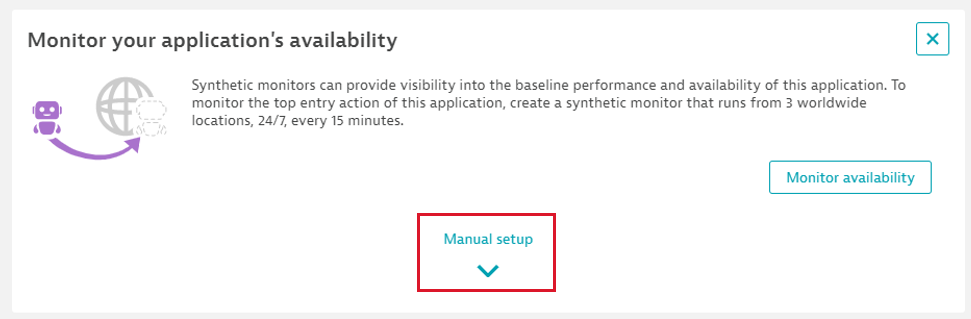
Monitoring the top three entry actions from 3 locations every 15 minutes is a great starting point for synthetic monitoring, and you can always mix this up to your taste. Instead of choosing Monitor availability, simply expand the card by selecting Manual setup and choose the entry action you want to create a monitor for. You can also always further configure automatically created monitors to add additional locations or change the frequency.
Prerequisites
The Availability card (see example above) only shows up on the application overview page if the following conditions are met:
- The user has
change monitoringpermission for the environment. - The application has at least one entry action.
- There are no synthetic monitors configured.
What’s next?
We’re already working on some improvements to this feature. In the upcoming versions, Dynatrace will automatically pick synthetic locations based on the top geographic locations that your real users access Dynatrace from. We’ll also automatically check if an application is only accessible internally and will choose the most appropriate locations accordingly.


Looking for answers?
Start a new discussion or ask for help in our Q&A forum.
Go to forum