Kubernetes is not only a preferred platform for deploying services and applications. In chatting with the One Engineering Productivity Team I got to learn how our teams are using Jenkins Pipelines and leveraging Kubernetes to speed up continuous integration and delivery.
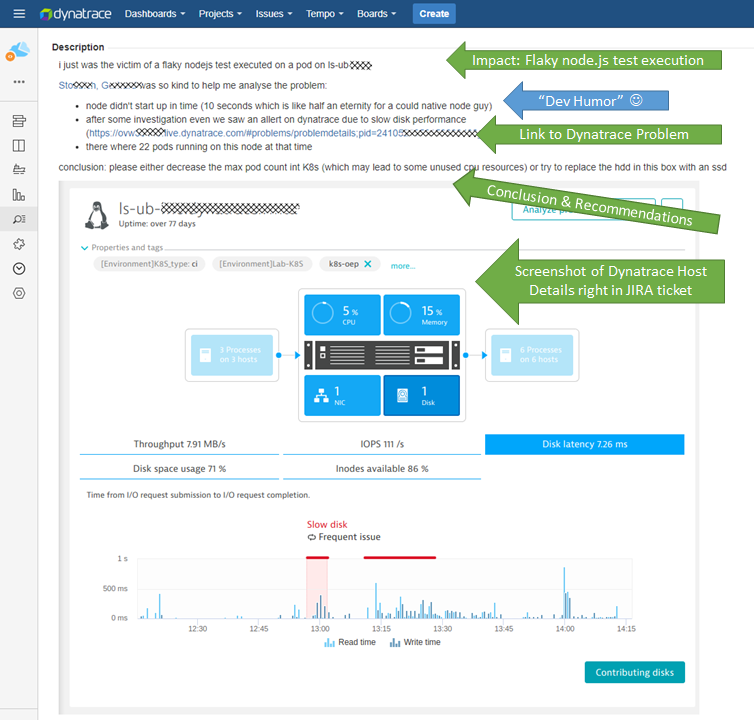
In today’s blog I focus on a “flaky tests problem” some of our engineers experienced and analyzed last week. It will give you some insights into how we use Dynatrace to ensure developer productivity. Let’s get started with the JIRA ticket that was opened by one of the engineers to document track the resolution of this issue:
Analyzing the Flaky Test Problem
The flaky test problem was analyzed by looking at data Dynatrace collected and analyzed from our build environment. Our Productivity Team has rolled out the Dynatrace OneAgent on all relevant physical and virtual hosts that are leveraged in our automated CI/CD pipeline. This includes Jenkins (master and workers) as well as our Kubernetes Cluster Nodes where these flaky tests get executed. There are different ways on how to roll out the OneAgent on Kubernetes. If you want to give it a try yourself I suggest you take a look at our OneAgent Operator for Kubernetes.
Step #1: Start with the Problem Ticket
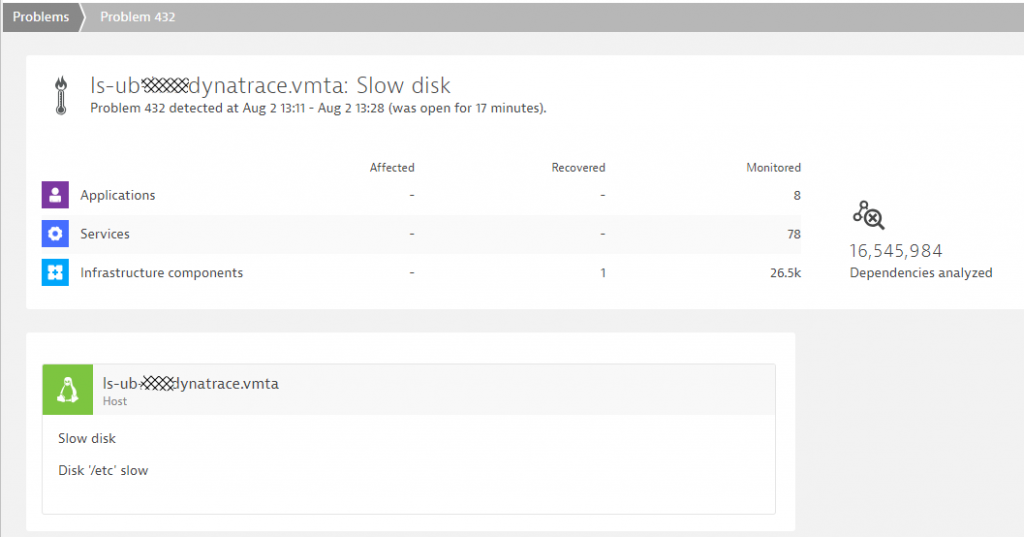
As mentioned in the Jira ticket, Dynatrace detected that there was an issue on the one of the Kubernetes nodes hosts:
Step #2: Root cause details
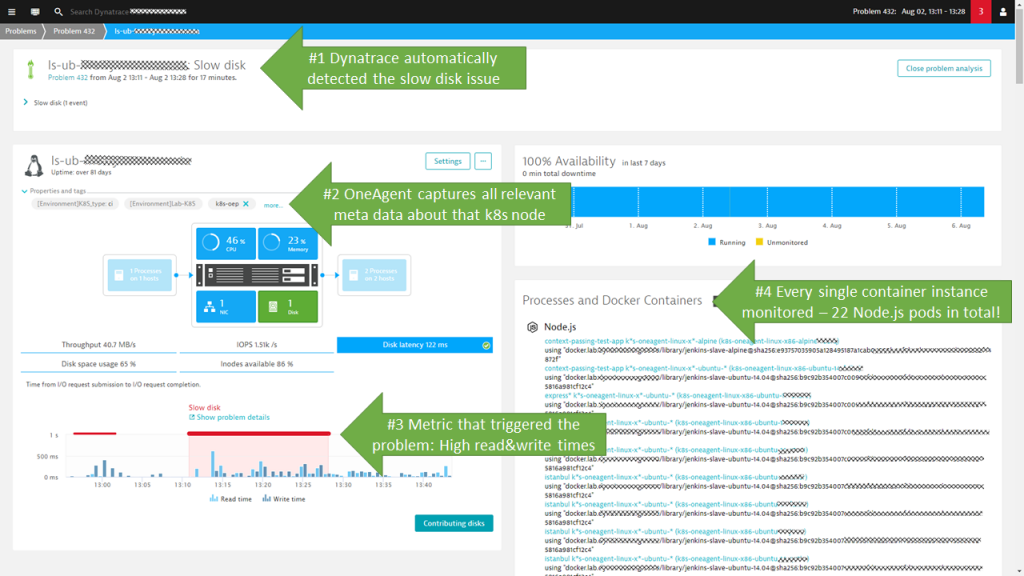
A click on the Linux machine that was detected as having the slow disk reveals the host details screens. This is where our engineer who created the ticket got most of his information that he summed up in the Jira ticket:
Step #3: Additional Information leading to conclusion
I thought to share some additional screenshots for you to see the wealth of information that Dynatrace captures automatically through OneAgent. Also remember that this information is available either through the Web Interface, the Dynatrace REST API or even through our Virtual Assistant Davis® which we have integrated with popular ChatOps tools such as Slack or VoiceOps such as Amazon Alexa. So – if you don’t like the Web Interface you can simply ask Davis: “Tell me more about the problem from yesterday afternoon!” and you will hear all the relevant details.
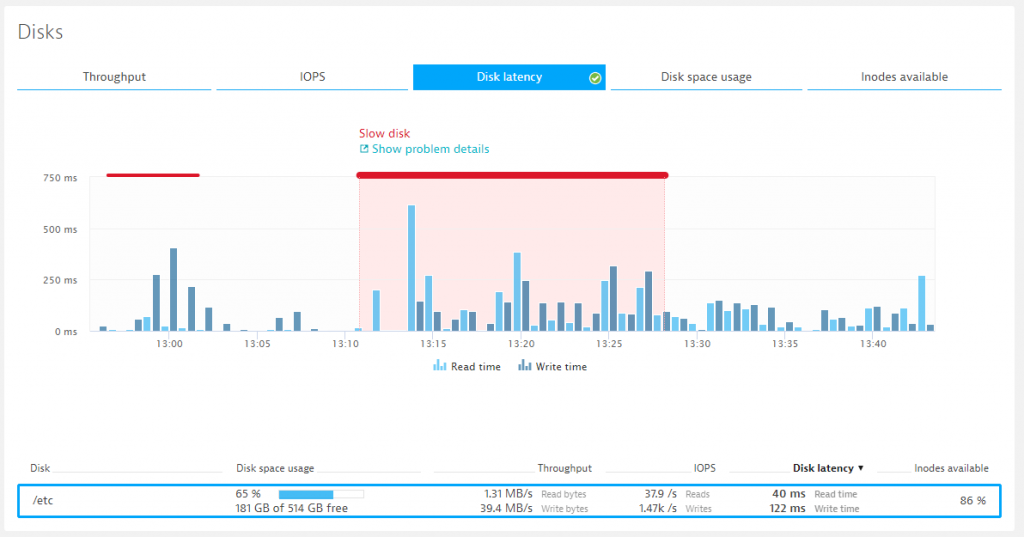
When analyzing CPU consumption, we can start on the host – looking at historical data for that time. If the host runs on VMWare, AWS, GCP, Azure … Dynatrace can also pull in additional metrics from the virtualized infrastructure through their APIs, e.g: CloudWatch metrics from AWS, …
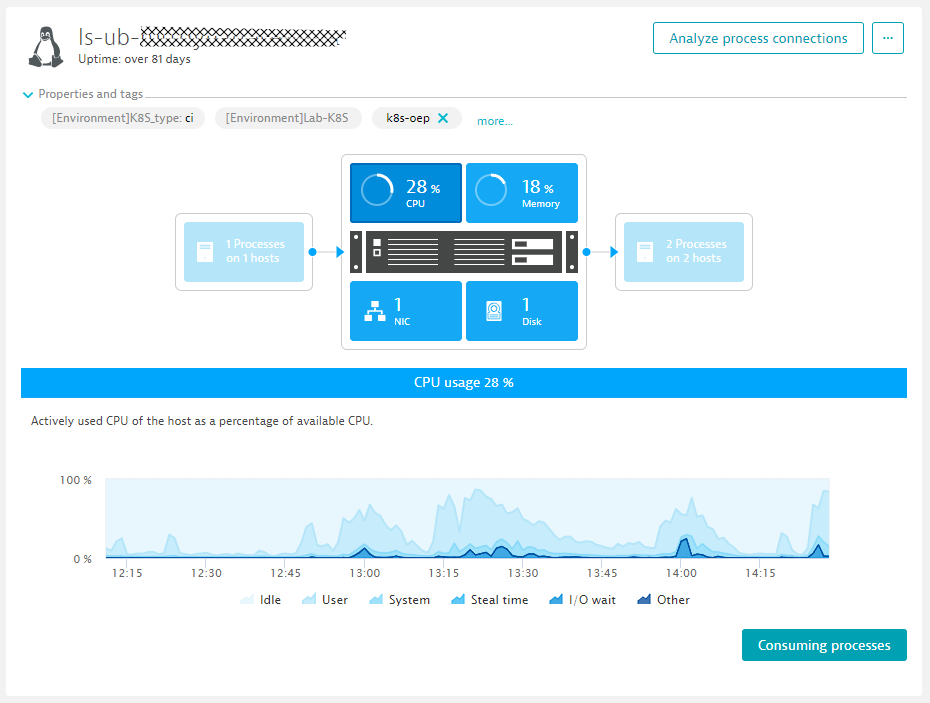
From the previous screen we can click on “Consuming processes” which gets us into a view listing all processes and containers that have consumed CPU, Memory …:
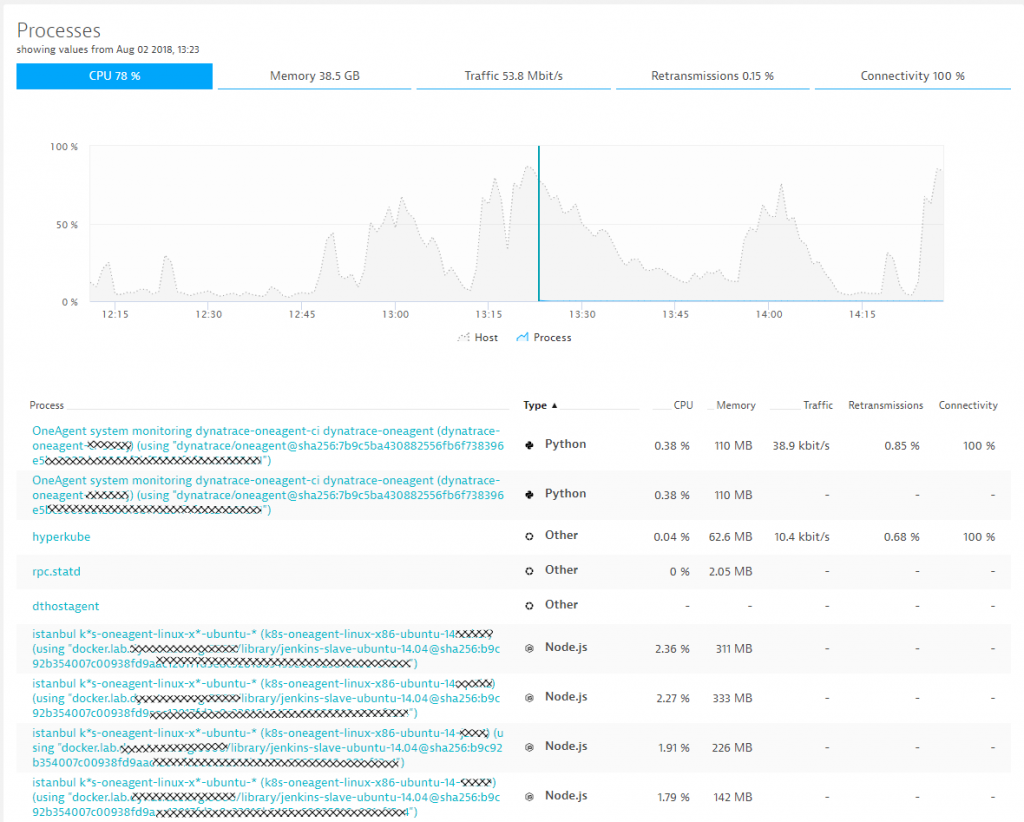
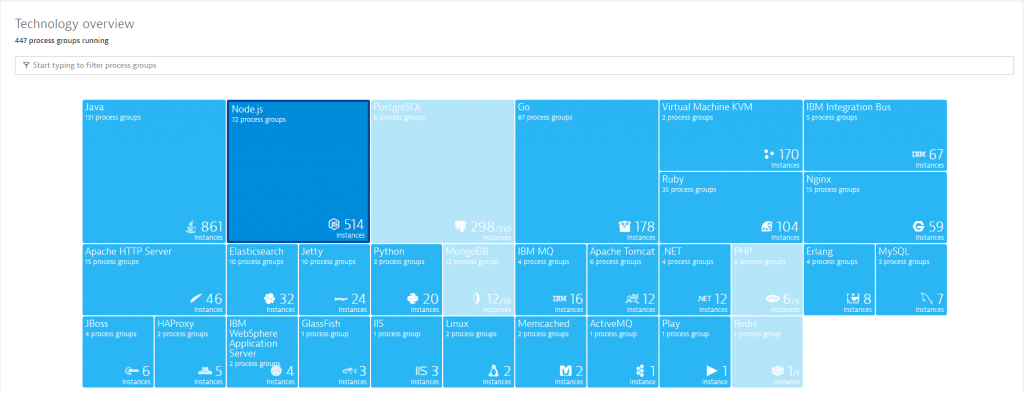
I was only able to capture the top part of the table in the screenshot above. As you can imagine it lists ALL of the 22 Node.js containers. That detailed data lead to the conclusion of our colleague Gerhard Stoebich to either limit the number of pod instances that should be executed on this pod or buy faster hardware.
My observation and suggestions
I am glad that our engineering team allows me to share some of these internals with you. It shows that we are not only selling Dynatrace to support you in your digital transformation but that we are battle-testing and optimizing it for the same use cases every single day with every single build we push through our pipelines.
Even though we are doing a great job here I thought to throw out 3 additional ideas to our team:
#1: Use the Dynatrace REST API to query resource consumption per container and with that either automatically adjust the max pod count or provide some early warning alerting
#2: Use our Dynatrace to Jira integration to automatically create Jira tickets in case of a detected problem
#3: Keep bringing up these stories for us to share 😊
Outlook to Jenkins-focused blog post
I am in the lucky situation of having several channels to push out thought leadership, educational and product related content such as the Dynatrace Blog, the PurePerformance Podcast, the Performance Clinic YouTube channel or through conferences. But I wouldn’t be able to tell any stories or best practices like the one from this blog if my colleagues wouldn’t reach out to me and make me aware of them. I therefore want to say Thank You to Bernd Farka (@BFarka), Dietmar Scheidl and Wolfgang Gottesheim (@gottesheim) who not only helped with this blog but also gave me input on the next blog.
The goal of their Productivity Team is to provide faster & on-demand feedback to the Dynatrace engineering teams. This only works if the automated pipelines are and stay optimized. While I have repeatedly claimed that at Dynatrace we have 10 minutes build it is not an easy task to keep the pipelines that fast with an ever growing code base and growing dependencies. Let me therefore leave you with a couple of “teaser” screenshots of the next blog that focuses on how we internally monitor and optimize our Jenkins pipelines to keep our pipelines fast:
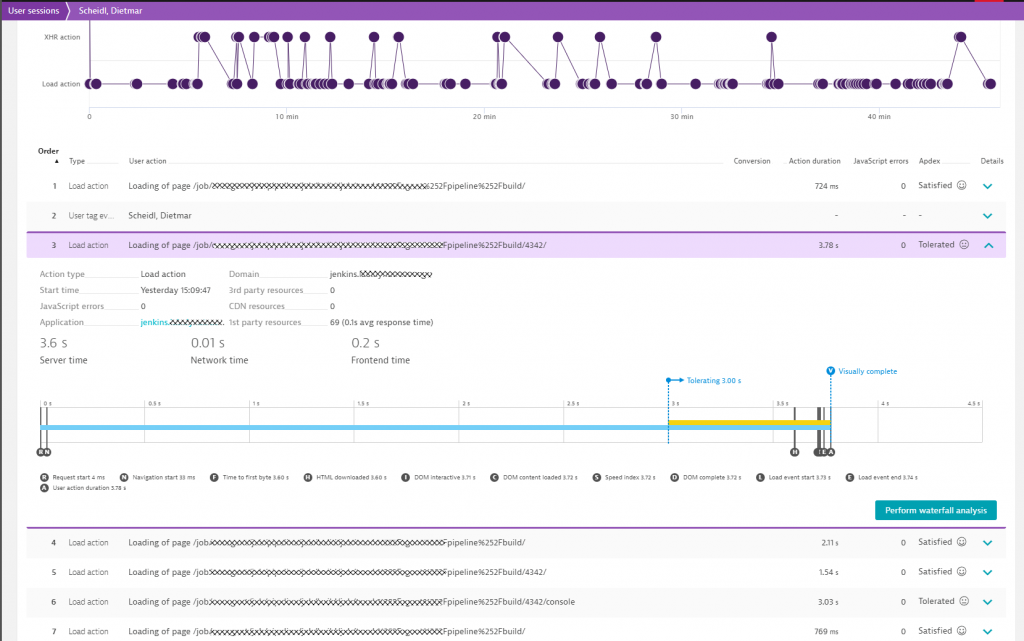
The goal of our Productivity Team is to ensure both fast Jenkins pipeline executions as well as good user experience when working with the Jenkins web interface. They therefore leverage Dynatrace Real User Monitoring (RUM) to analyze how engineers navigate through Jenkins and where Jenkins is slow:
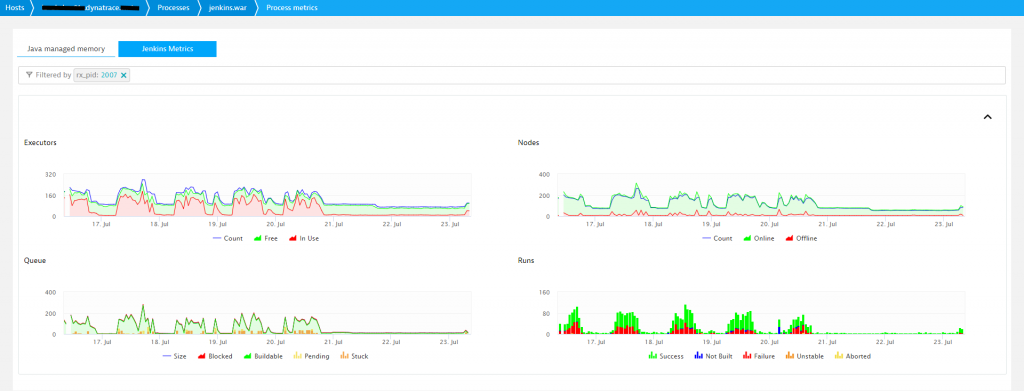
To optimize and speed up Jenkins pipeline and job execution the Productivity Team also looks at key Jenkins metrics they pulled into Dynatrace through our available extension options:
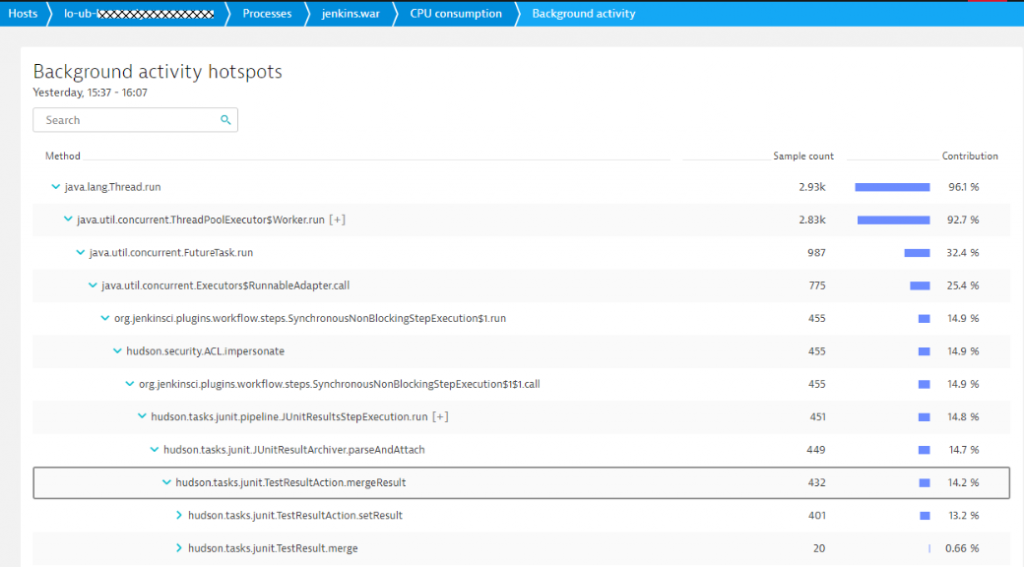
With the help of OneAgent and the CPU hotspot analysis they can also optimize tasks that take too much CPU, such as collecting verbose test results at the end of a job execution!
If you have any questions, comments or feedback don’t hesitate to put in a comment on the blog or send me a tweet (@grabnerandi)



Looking for answers?
Start a new discussion or ask for help in our Q&A forum.
Go to forum