
Many companies are interested in experimenting with the OpenTelemetry observability standard, but have suffered from the lack of a good reference implementation. Now with Astronomy Shop, the OpenTelemetry demo app, organizations can kick the tires using multiple sample microservices that showcase OpenTelemetry features and capabilities. Learn how to deploy and explore OpenTelemetry features using Dynatrace as your full-context OpenTelemetry backend.
OpenTelemetry Astronomy Shop is a demo application created by the OpenTelemetry community to showcase the features and capabilities of the popular open-source OpenTelemetry observability standard.
OpenTelemetry provides a common set of tools, APIs, and SDKs to help collect observability signals from applications and infrastructure endpoints. Many companies are interested in experimenting with OpenTelemetry but have struggled with the lack of a good reference implementation.
The Astronomy Shop demo application, which has been actively developed since 2022, solves this problem, and Dynatrace is one of its leading contributors.
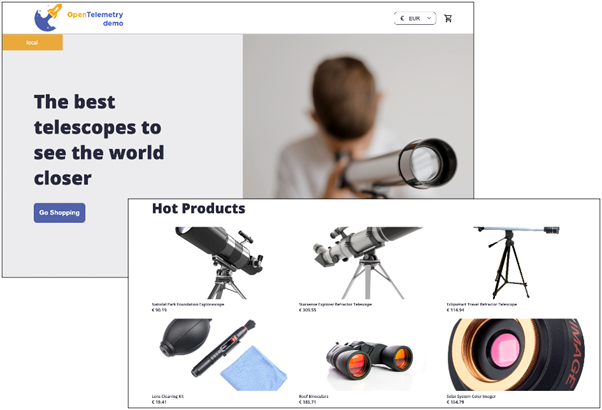
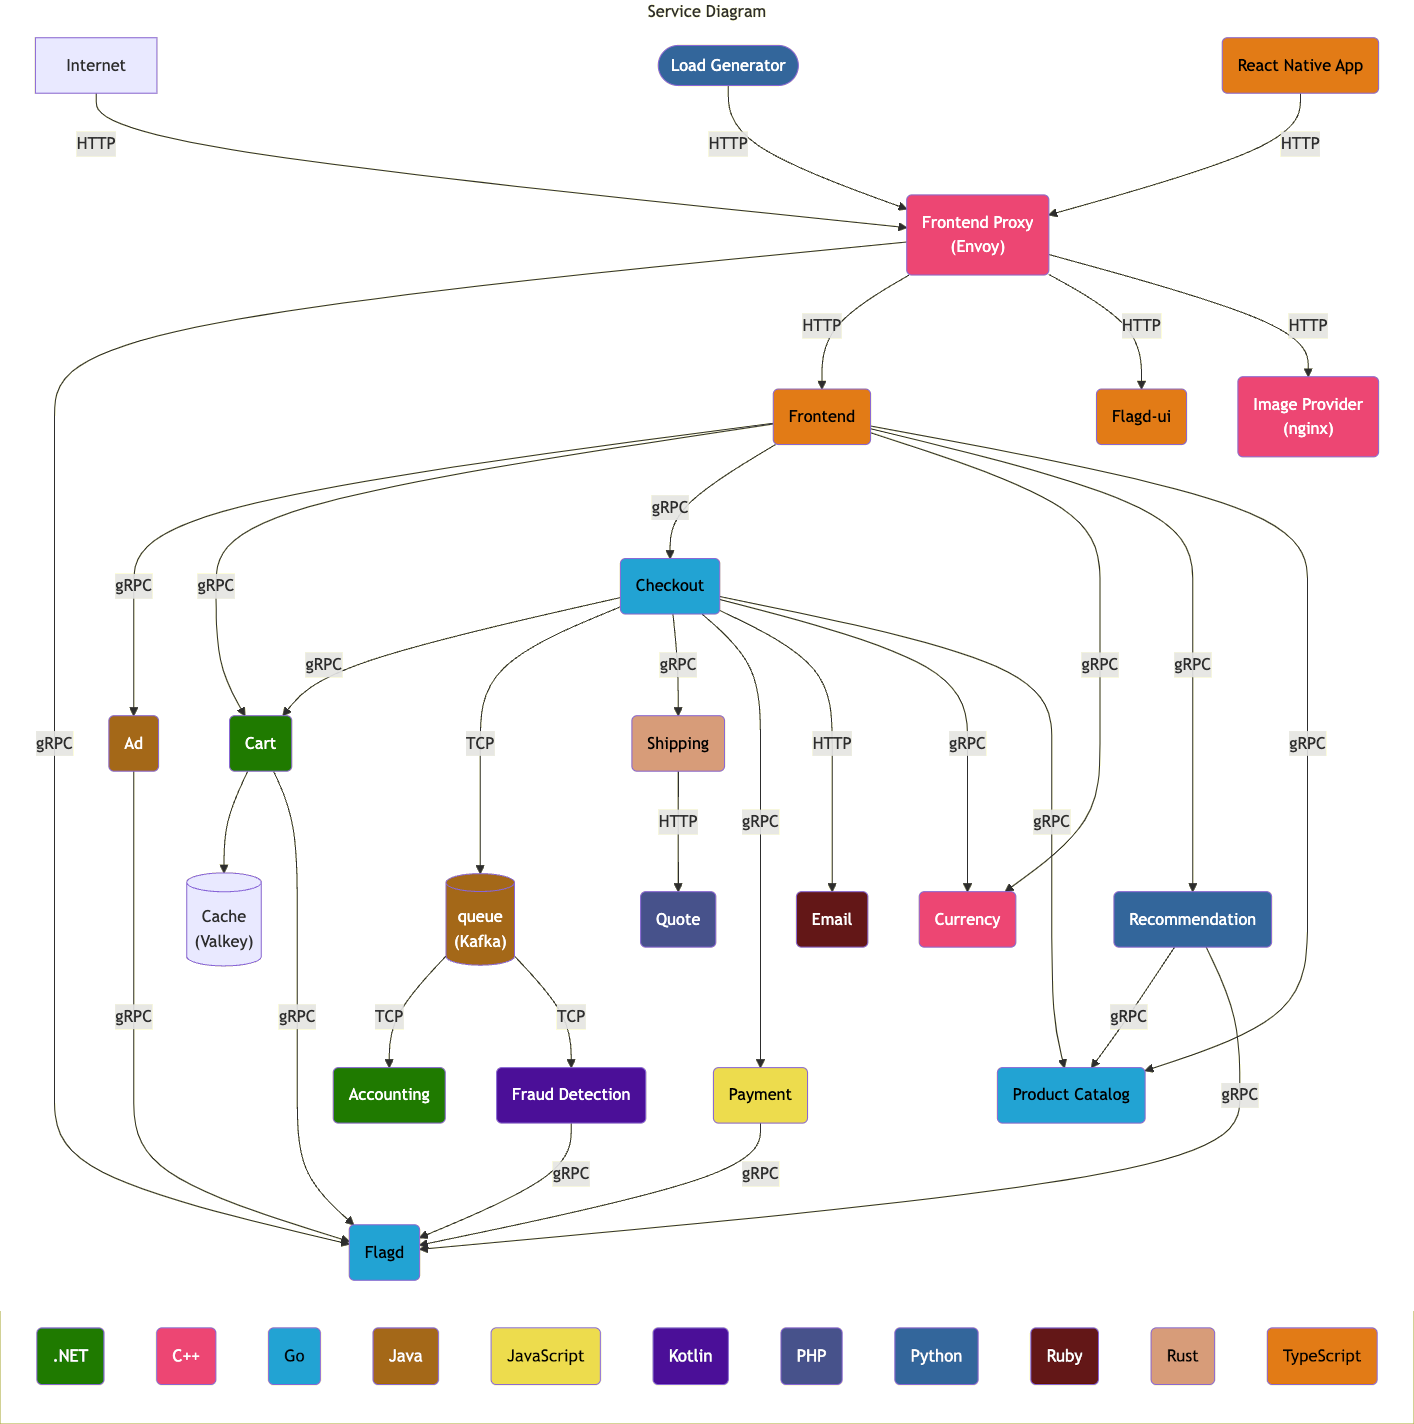
The OpenTelemetry demo application is a cloud-native e-commerce application made up of multiple microservices. Because it includes examples of 10 programming languages that OpenTelemetry supports with SDKs, the application makes a good reference for developers on how to use OpenTelemetry. You can also use it to test different OpenTelemetry features and evaluate how they appear on backends. Moreover, you can use it as a framework for further customization.
To run the demo, you’ll need either a Docker or Kubernetes environment. By default, the demo comes with Jaeger and Prometheus backends, but you can easily configure alternative backends. In this example, we’ll use Dynatrace.
Setting up the OpenTelemetry demo application with Dynatrace as backend
You can ingest OpenTelemetry data in two ways:
- Using Dynatrace OneAgent® technology
- Using OpenTelemetry Protocol (OTLP), which relies exclusively on open-source technology
Although both methods ingest data, Dynatrace OneAgent helps users automatically discover additional insights about their infrastructure, applications, processes, services, and databases. In this example, we’ll deploy the OpenTelemetry demo application to send telemetry directly to Dynatrace using OTLP so you can see how Dynatrace presents the OTel data without the additional context OneAgent provides.
To set up the demo using Docker, follow the steps below. You can find additional deployment options in the OpenTelemetry demo documentation.
Download and configure Astronomy Shop
- First, get and run the Astronomy Shop app from its GitHub repository.
git clone https://github.com/open-telemetry/opentelemetry-demo.git
cd opentelemetry-demo/
- Next, configure the demo application to send telemetry to Dynatrace. At the cloned repository’s root, create a new file called
docker-compose.override.ymland paste the following into the file:services: otel-collector: environment: - DT_ENDPOINT - DT_API_TOKEN
This ensures all necessary environment variables that we’ll create in Dynatrace are passed to all services, specifically:
DT_ENDPOINTis the OTLP endpoint that is used by the collector to export traces to Dynatrace.DT_API_TOKENis the token for your Dynatrace environment.
- Next, go to
src/otel-collector/otelcol-config-extras.yml. This file contains a configuration that will be merged with the Demo app Collector’s default configurator. Copy the following into the file:exporters: # otlp/http exporter to Dynatrace. otlphttp/dynatrace: endpoint: "${DT_ENDPOINT}" headers: Authorization: "Api-Token ${DT_API_TOKEN}" processors: cumulativetodelta: batch: service: pipelines: traces/dynatrace: receivers: [otlp] processors: [batch] exporters: [otlphttp/dynatrace] metrics/dynatrace: receivers: [otlp, spanmetrics] processors: [batch, cumulativetodelta] exporters: [otlphttp/dynatrace] logs/dynatrace: receivers: [otlp] processors: [batch] exporters: [otlphttp/dynatrace]
This configuration will export traces, metrics, and logs to Dynatrace using OTLP. The configuration also includes an optional span metrics connector, which generates Request, Error, and Duration (R.E.D.) metrics from span data. All the needed components are available out of the box in the OpenTelemetry collector contrib distribution, which is included in the demo application.
Set up Dynatrace as backend
In these steps, you’ll set up your Dynatrace account and environment variables.
- Create a Dynatrace account. If you don’t have one, you can use a trial account.
- Next, create an access token that includes scopes for the following. For details, see Dynatrace API – Tokens and authentication in the Dynatrace documentation.
- Ingest OpenTelemetry traces (
openTelemetryTrace.ingest) - Ingest metrics (
metrics.ingest) - Ingest logs (
logs.ingest)
- Ingest OpenTelemetry traces (
- Export the environment variables. Make sure to replace the placeholder values with your token and environment ID. This example illustrates how to pass the token most easily using the terminal. In a production environment, you would configure the token using Kubernetes secrets or other secure secret handling mechanisms.
export DT_ENDPOINT=https://{your-env-id}.live.dynatrace.com/api/v2/otlp
export DT_API_TOKEN=dt0c01.MY_SECRET_TOKEN
export OTEL_EXPORTER_OTLP_METRICS_TEMPORALITY_PREFERENCE=delta
Deploy the Astronomy Shop demo application
- When everything is prepared, deploy your demo application.
docker compose up --no-build
- If you use ARM architecture (for example, a MacBook with Apple silicon), remove the
--no-buildoption to build the images locally. - When running the demo for the first time, it takes a couple of minutes to download all the needed images. Afterward, the demo starts instantly, and the load generator automatically begins creating data.
- If you use ARM architecture (for example, a MacBook with Apple silicon), remove the
- Open the demo application UI to see the app in action:
http://localhost:8080/
Use Dynatrace to observe traces, metrics, logs, and services
Open your Dynatrace environment in the browser (using the link from creating your Dynatrace account). Once the application is running, you’ll see traces, metrics, and logs start to appear. Dynatrace also automatically detects the services shown in the new Services app.
Next, let’s explore the telemetry data using different Dynatrace apps.
View traces
- Using the navigation on the left, open the Distributed Tracing app. In this view, you can analyze traces using the new Distributed Tracing experience. For example, to get traces for the checkout service, you can enter checkout in the Filter requests field, as shown in the following image.
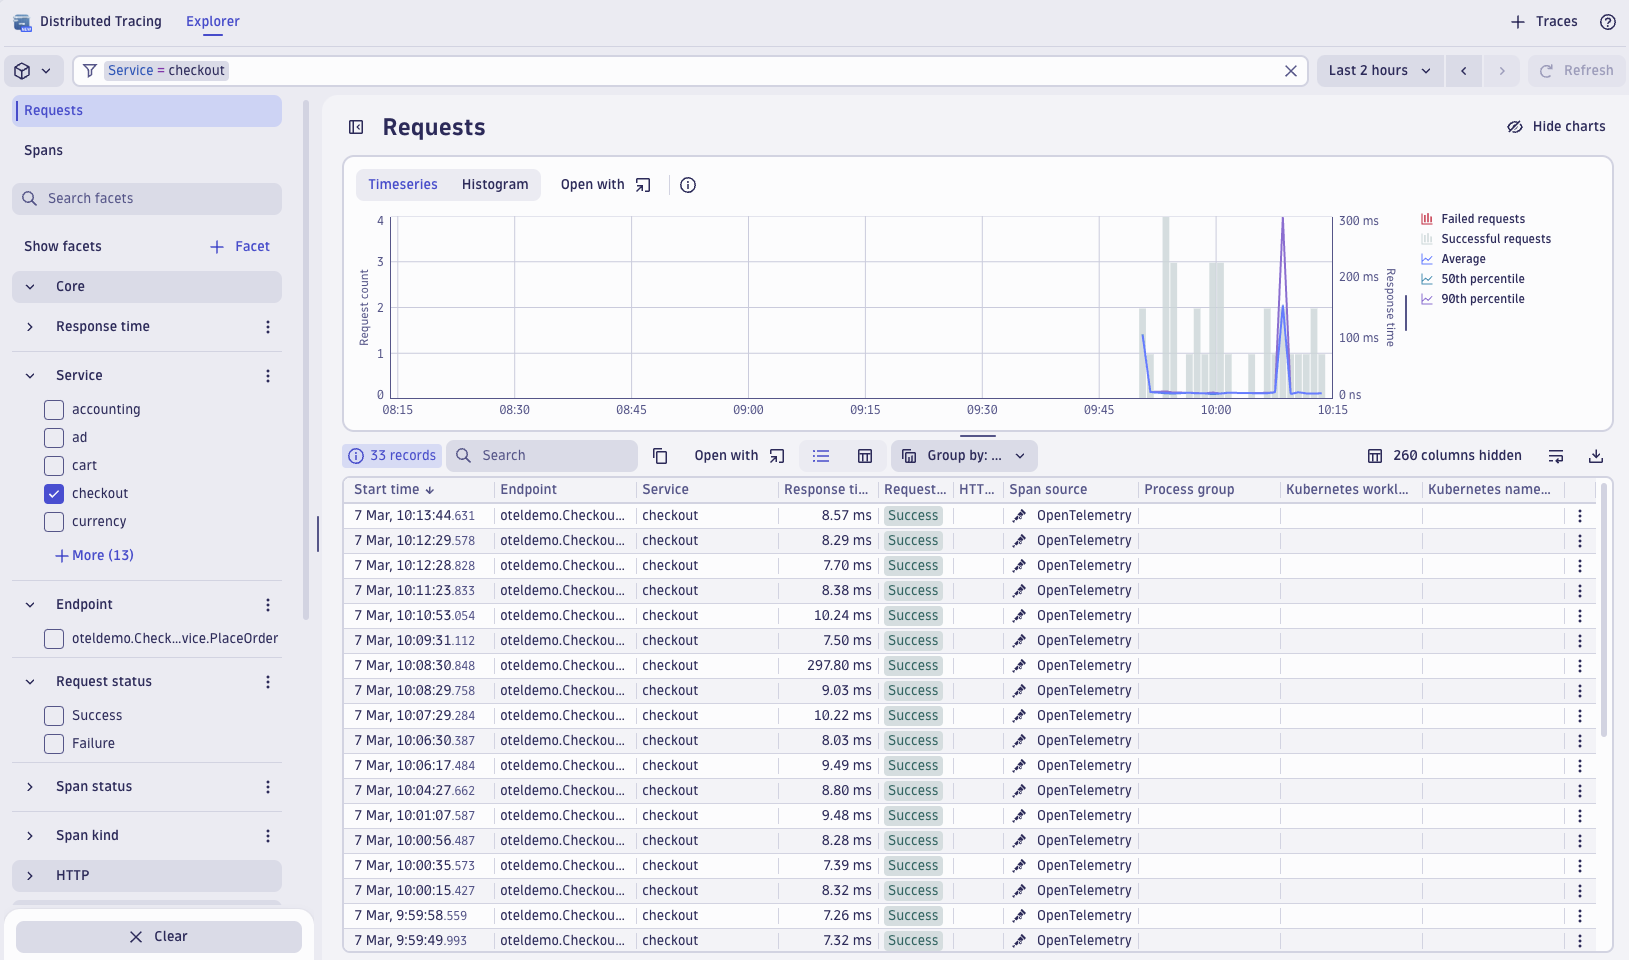
Figure 2. Analyze checkout traces in the Distributed Tracing app. - If you select one of the traces, you can see the different spans going through multiple services, as shown in the following image.
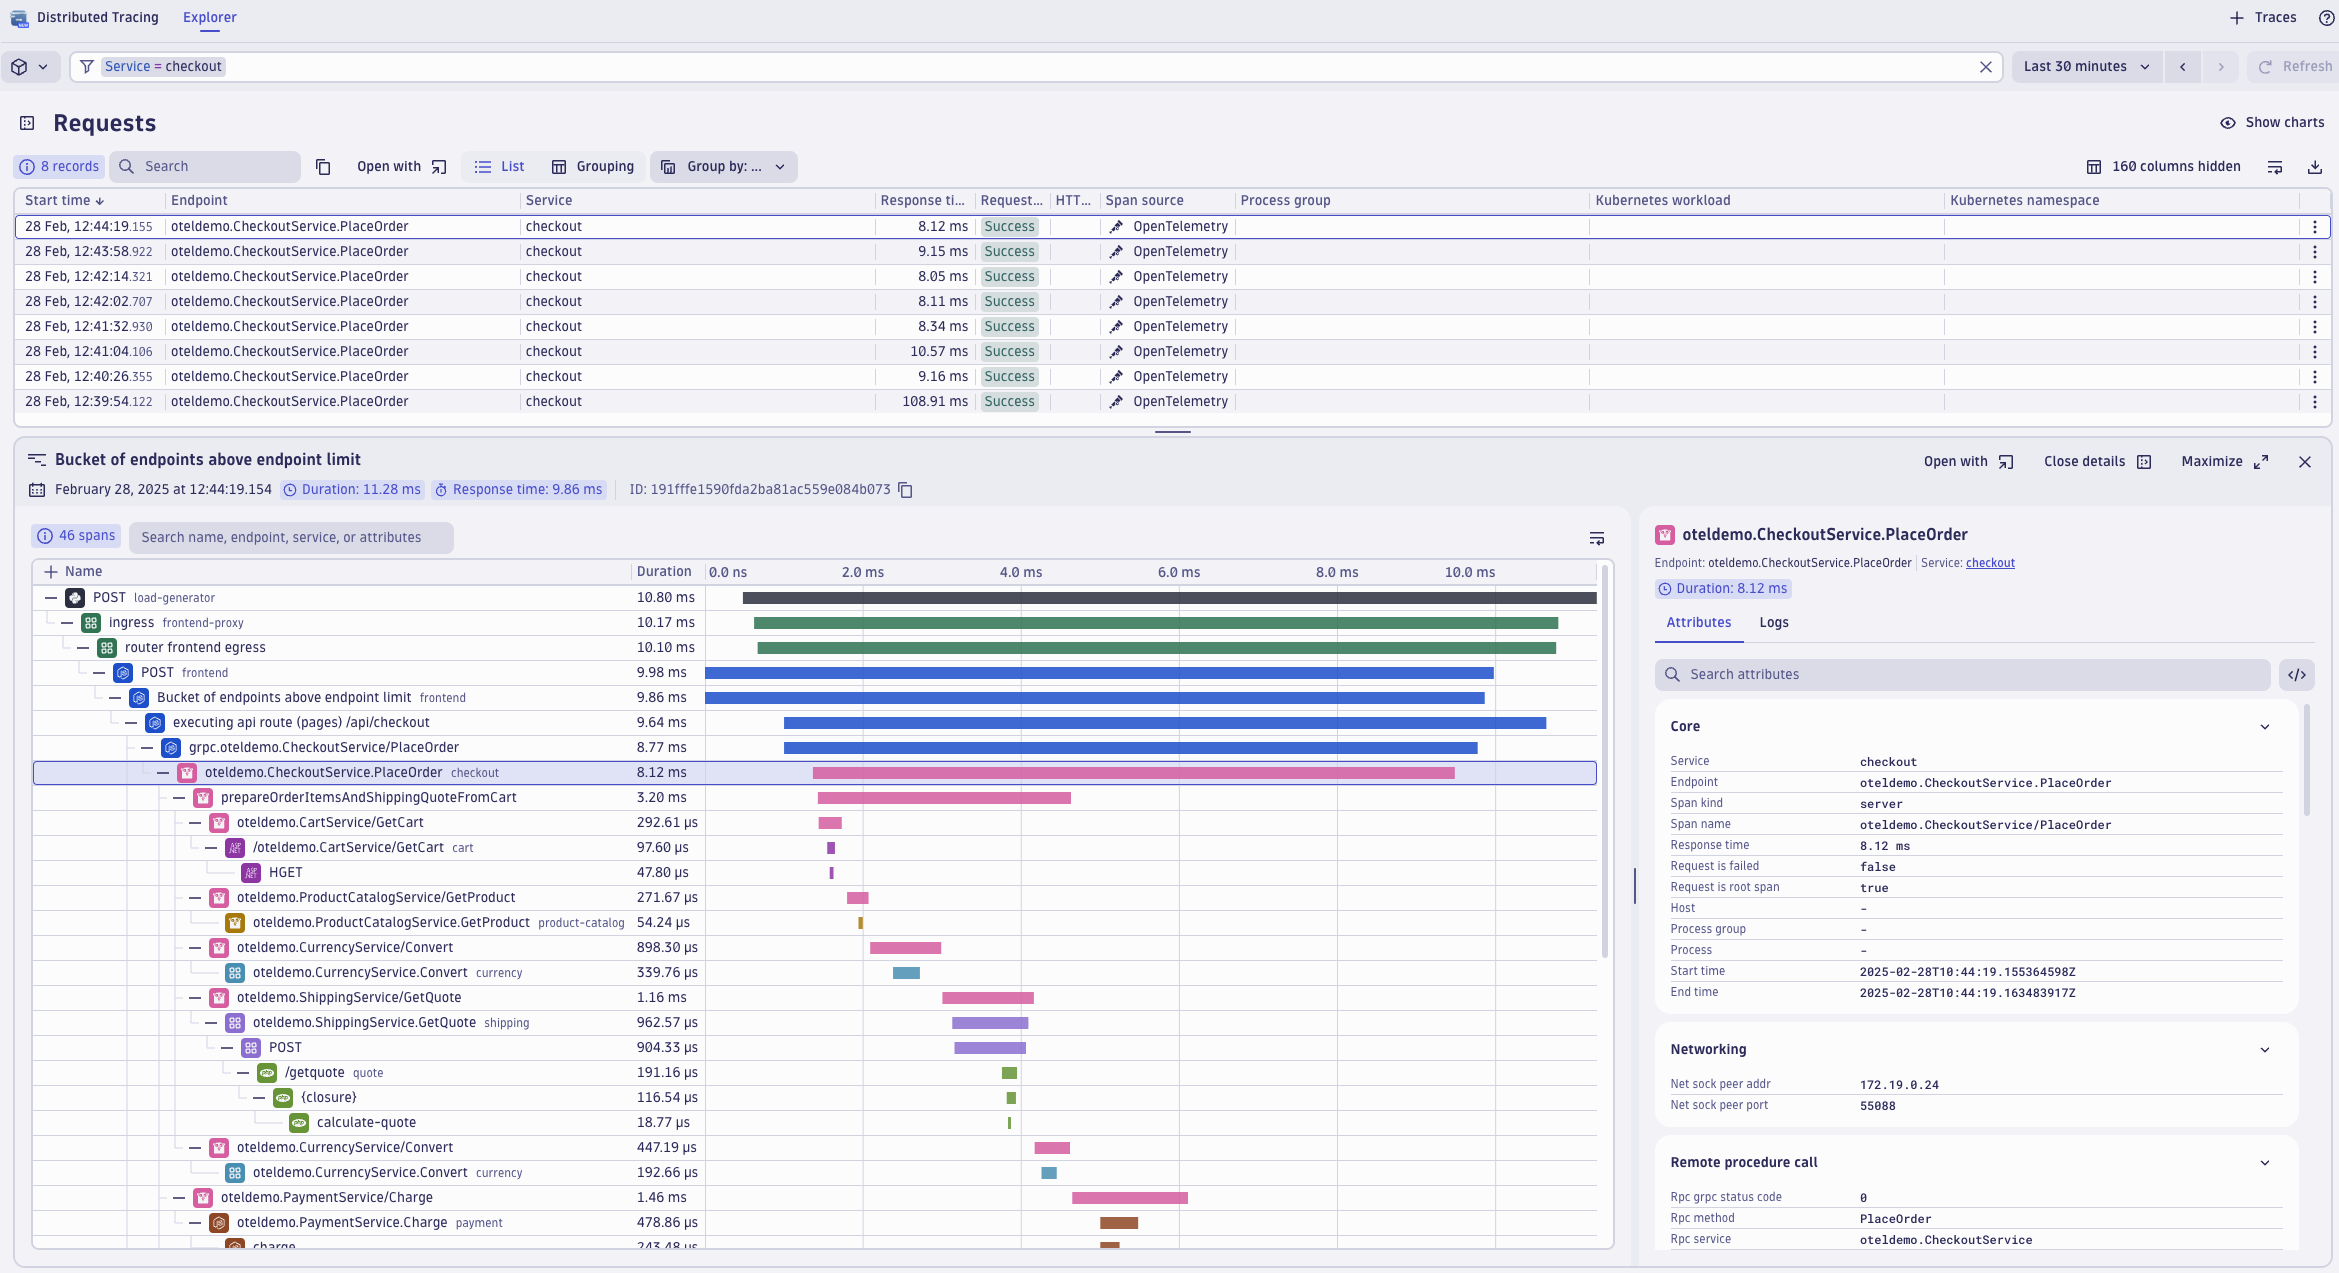
Figure 3. Explore spans of a given trace through various services.
View metrics
- Next, take a look at the received metrics by opening the Notebooks app in the left navigation. Select + then select Metrics from the drop-down. Filter metrics using
traces.span.metrics.callsto see the metric created by the OTel Collector’s Span Metrics connector.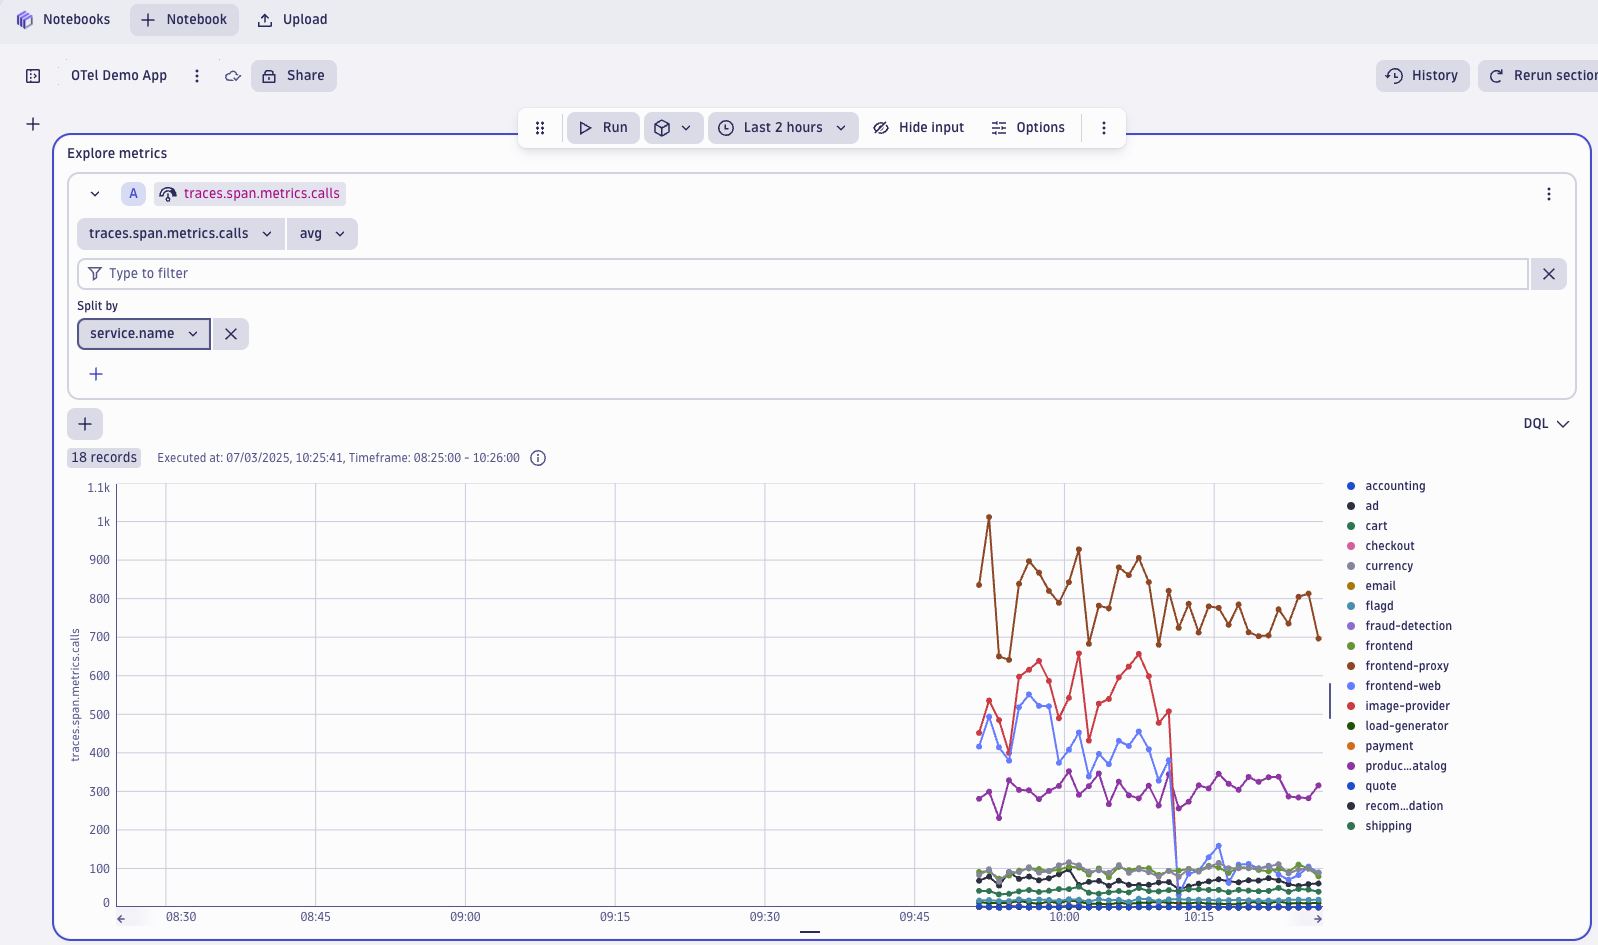
Figure 4. View metrics created by the OTel Span Metrics connector. - The Span Metrics connector counts the number of spans that each demo app service creates. Use the Split by field with the value
service.nameto separate the number of spans per service. You can see it’s the front-end proxy that creates the most spans.
View logs
- To access logs in Dynatrace, navigate to the Logs app and select Run query.
- Next, select one of the log lines to view the available attributes. Select Open trace to connect your log lines with traces and see which request (distributed trace) led to this log line. The magic of the log-trace correlation is the trace_id and span_id attributes that OpenTelemetry instrumentation libraries attach to each log message in an active span.
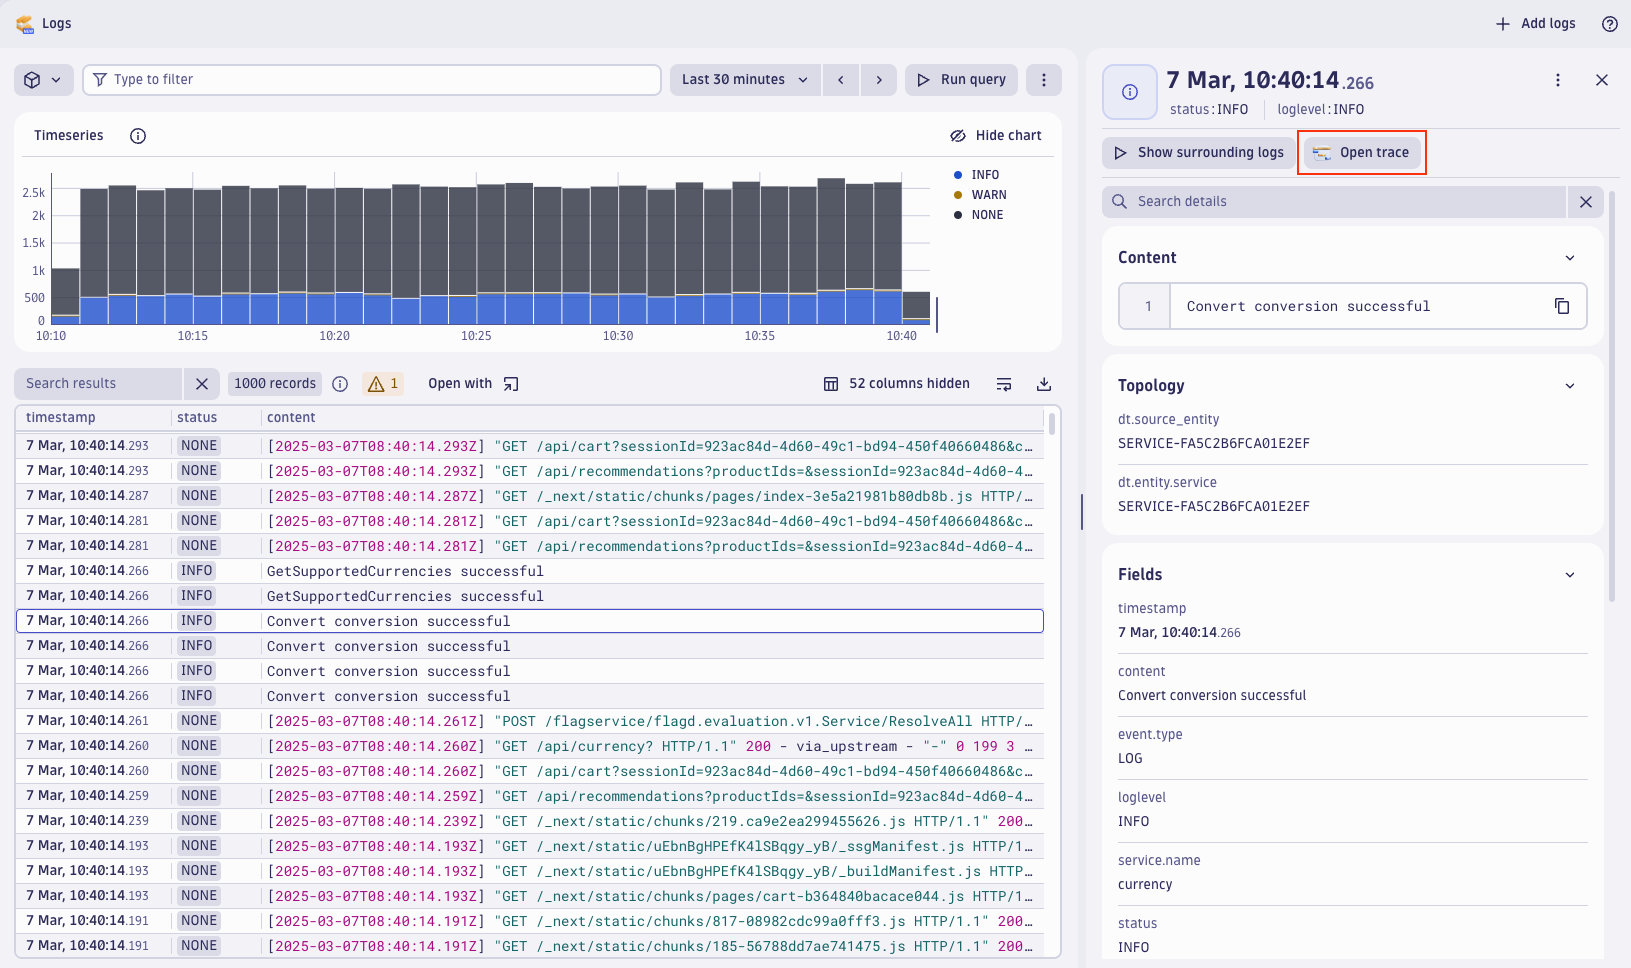
Figure 5. See details of log-trace correlation in an active span
View services
- The Services app gives you a high-level view of all your services. In the main view, you can compare the performance and health of each service and detect possible issues.
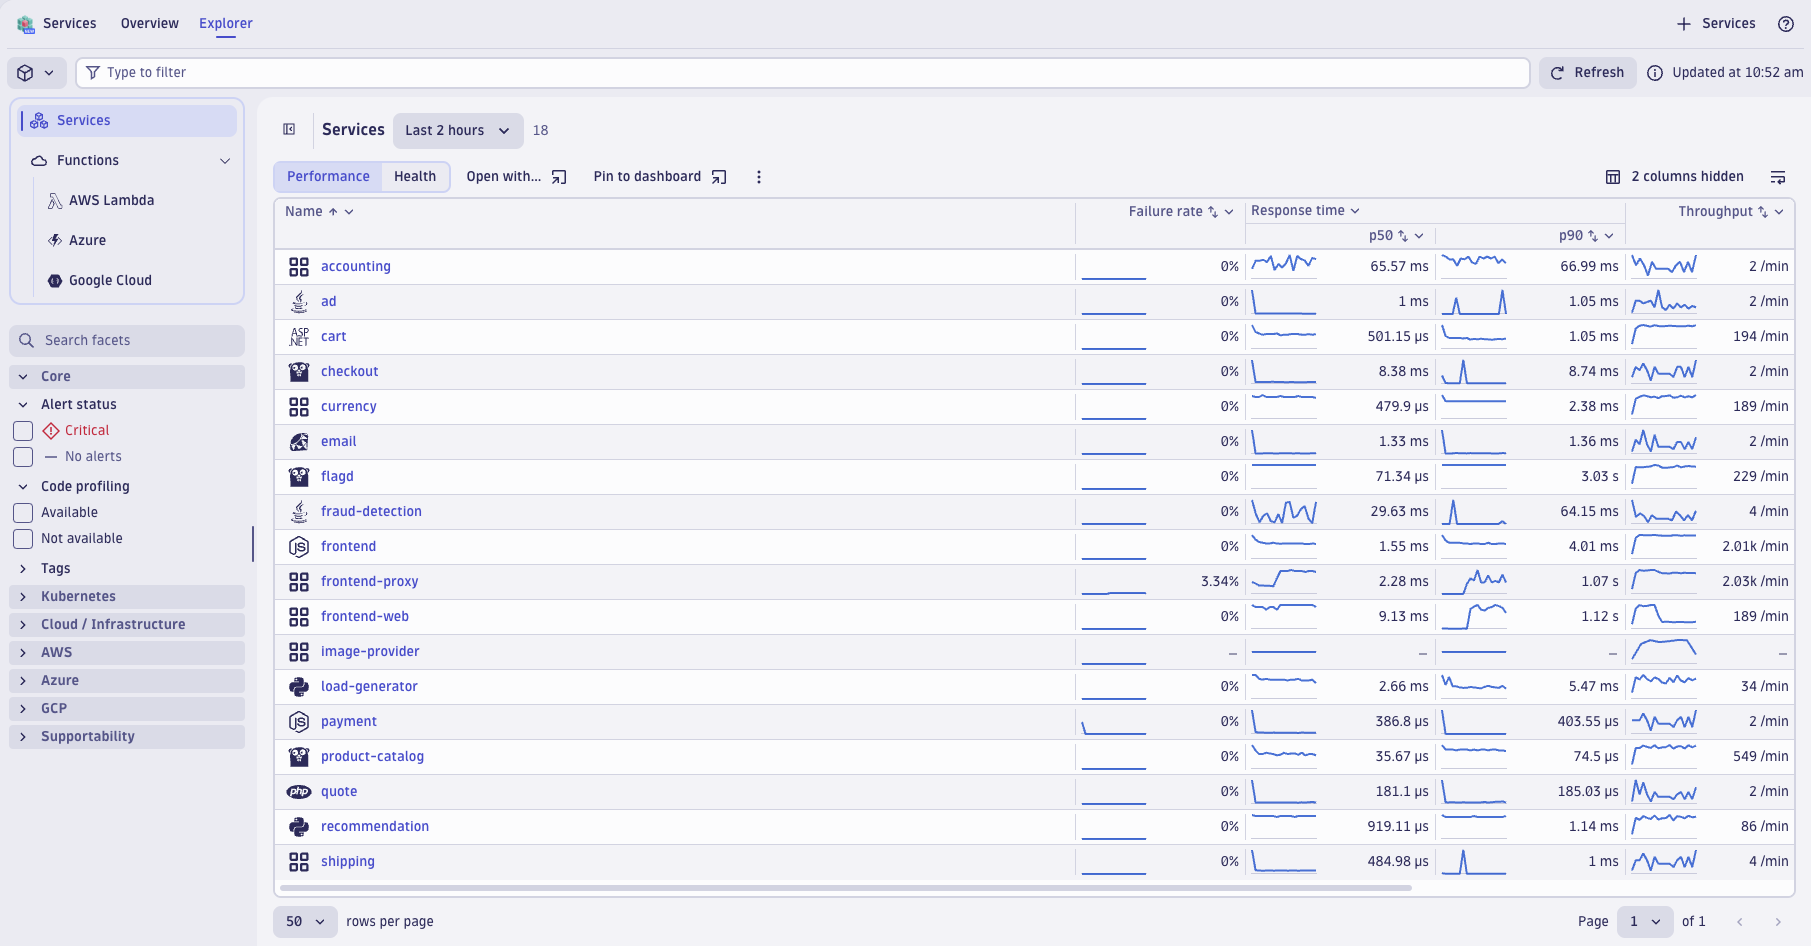
Figure 6. Compare the performance and health of each service in the Services app. - When you select one of the services from the list, you get a nice overview of the service and can access its traces, metrics, and logs from a single view.
Using feature flags: Simulating application failures use case
The OpenTelemetry Astronomy Shop demo application contains several built-in use cases that simulate application failures, which you can enable using a feature flag service.
- To try one out, go to the feature flag UI:
http://localhost:8080/feature - Find the feature flag called productCatalogFailure. Turn the feature flag On and select save.
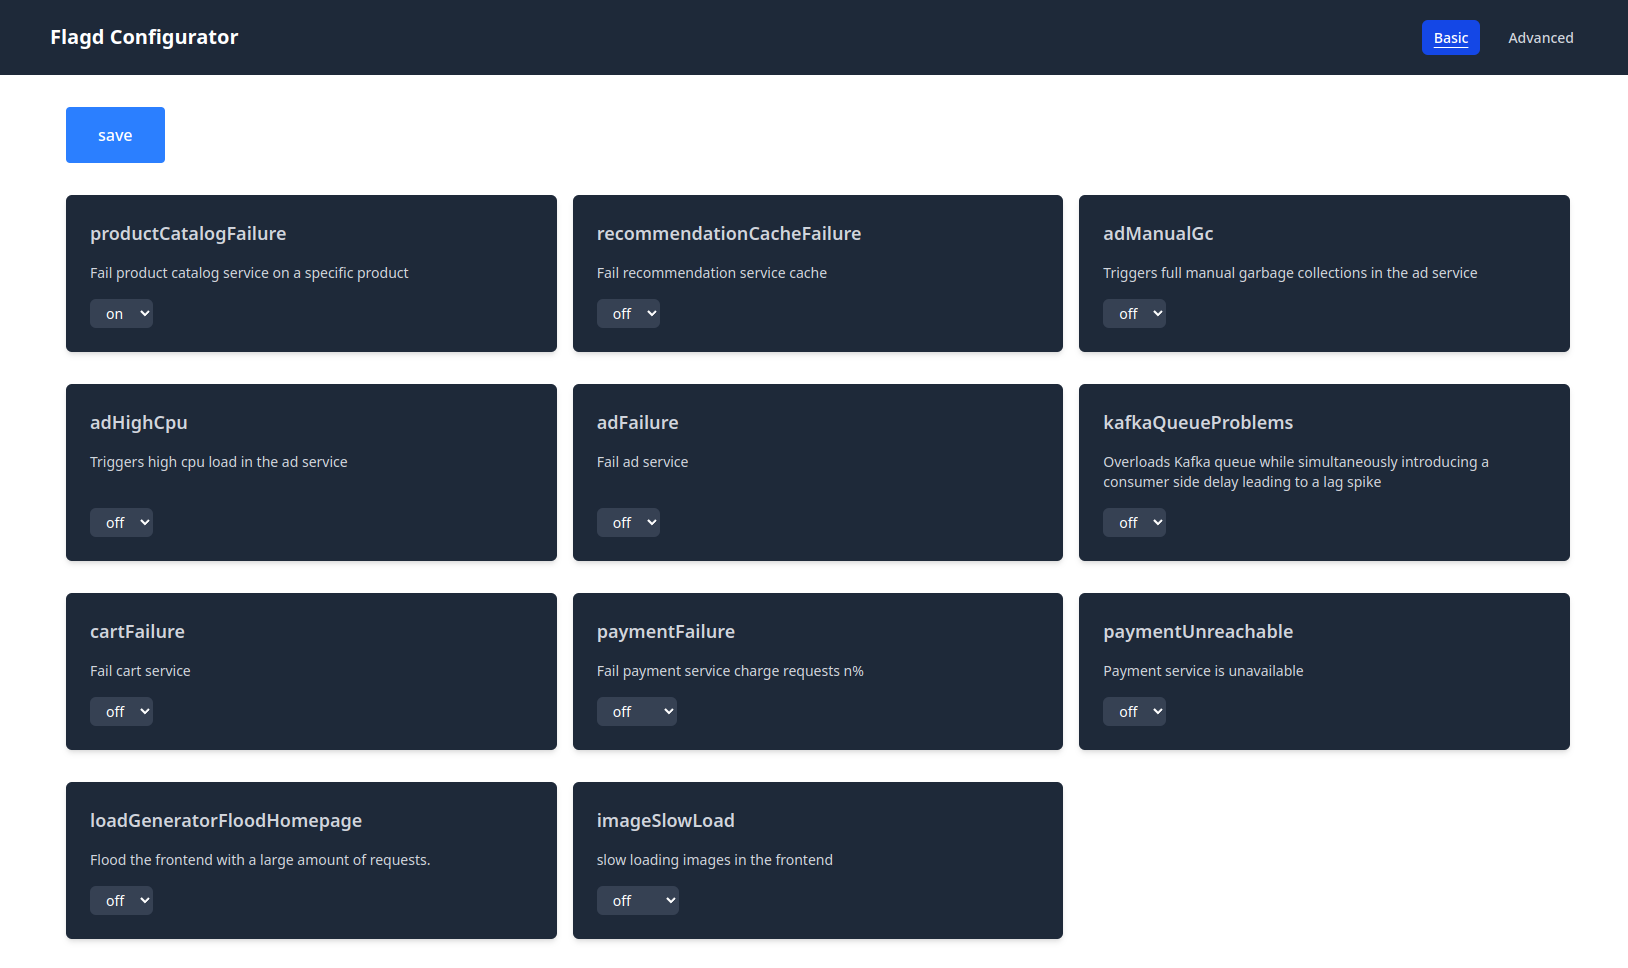
Figure 7. Investigate simulated errors using built-in feature flags. - When the product-catalog requests start failing, go to the Distributed Tracing app and select the
product-catalogservice. You should see some of the traces with Failure status (in red). - Open one of these traces to see more details. You can see that the
GetProductrequests are the root cause of these failures. If you select one of theGetProductspans, you can see the detailed span event showing the reason.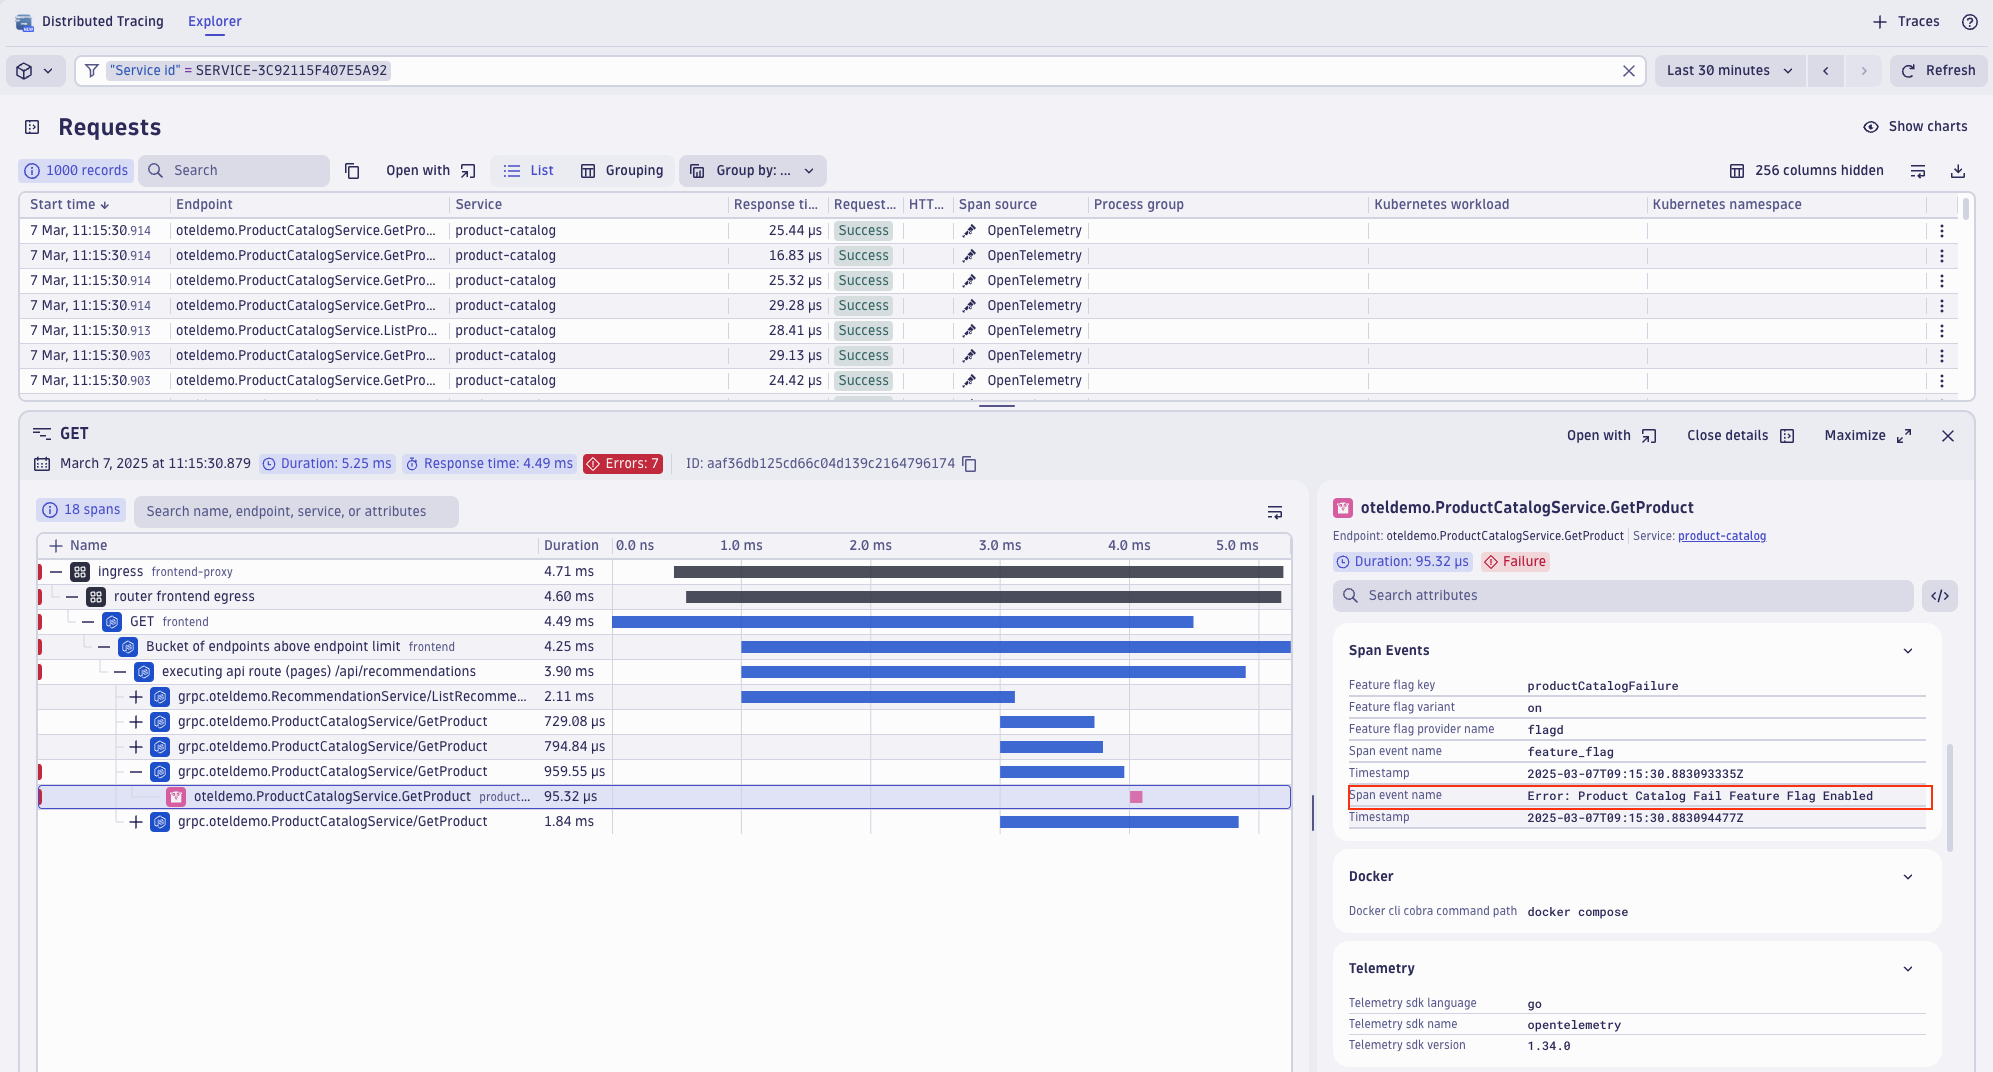
Figure 8. Investigate the root cause of a failed GetProduct request.
What’s next?
The OpenTelemetry community will continue to improve the demo application so it reflects the latest OpenTelemetry capabilities. Traces, metrics, and logs are already well covered, but interesting enhancements are being made frequently, so stay tuned.
As a top contributor to the OpenTelemetry project since 2020, Dynatrace continues to work with the community and other vendors to enrich the Astronomy Shop project’s capabilities.


Looking for answers?
Start a new discussion or ask for help in our Q&A forum.
Go to forum