
Large enterprises such as Western Union, Vodafone, and United Airlines are ditching legacy log solutions in favor of a single, unified observability platform that delivers real-time insights and scalability at the petabyte level, as you’ll hear firsthand from them at Perform 2026.
In this blog post, we’ll look back at the log-focused Dynatrace product releases of 2025, while keeping in mind the three benefits that customers love most about Dynatrace:
- Fast log onboarding with unified ingestion from any source
- It’s easy to get started, yet powerful for your daily work
- Productivity boosts with Davis AI
Boost productivity with Davis AI
The promise of “Logs in Context” is simple:
Find the right log line at the right time, automatically and powered by AI.
The magic of Dynatrace is not a single feature or hyped AI. It’s the sum of many Dynatrace capabilities that comprise the foundation of the Dynatrace platform: Grail®, Smartscape®, Davis® AI, OpenPipeline®, and many others, that come at no extra cost, providing the automation and assistance you need.

If you aren’t yet using Dynatrace for your logs, stop stitching together clues across tools and say goodbye to manual swivel chair ops:
- Logs in context: The right log lines appear automatically within the workflow or Dynatrace app you’re using. Whether that’s troubleshooting a service, reviewing Kubernetes node health, or investigating performance incidents of Infrastructure or cloud native apps.
- Free of charge: Every in-context query, including surrounding logs, is now zero-rated (non-billable) when you view logs inside these Dynatrace core apps: Clouds, Infrastructure & Operations, Services, and Distributed Traces. While these apps don’t generate query consumption, ingestion and retention consumption are billed individually. We’re delivering the logs you need to take action – instantly, efficiently, and automatically correlated.
- Leverage the power of Dynatrace Davis AI: With Dynatrace, features like “Explain logs” dramatically shorten time to action. Our customers report that their teams can more easily understand the possible causes and impacts of incidents without having to manually search for error codes in logs on Google.
- By leveraging Davis AI, Workflow Automation, and integrations such as our ServiceNow partnership, customers can dramatically reduce the number of incidents; one of our customers reported reducing MTTI by 90%.
AI summaries are available across the Dynatrace platform and MCP server.

With Dynatrace, observability is not limited to cloud native apps. These features work seamlessly across cloud native, on-premises, hybrid, and traditional IT stacks. So, whether you’re on Kubernetes, a Mainframe, or an AWS Lambda function, the experience is the same.
Effortless for everyone, powerful for experts
Once your logs are ingested, you need to be able to understand them. This is where our Logs app shines for both new and expert Dynatrace users.
Pre-defined and admin-curated views boost productivity
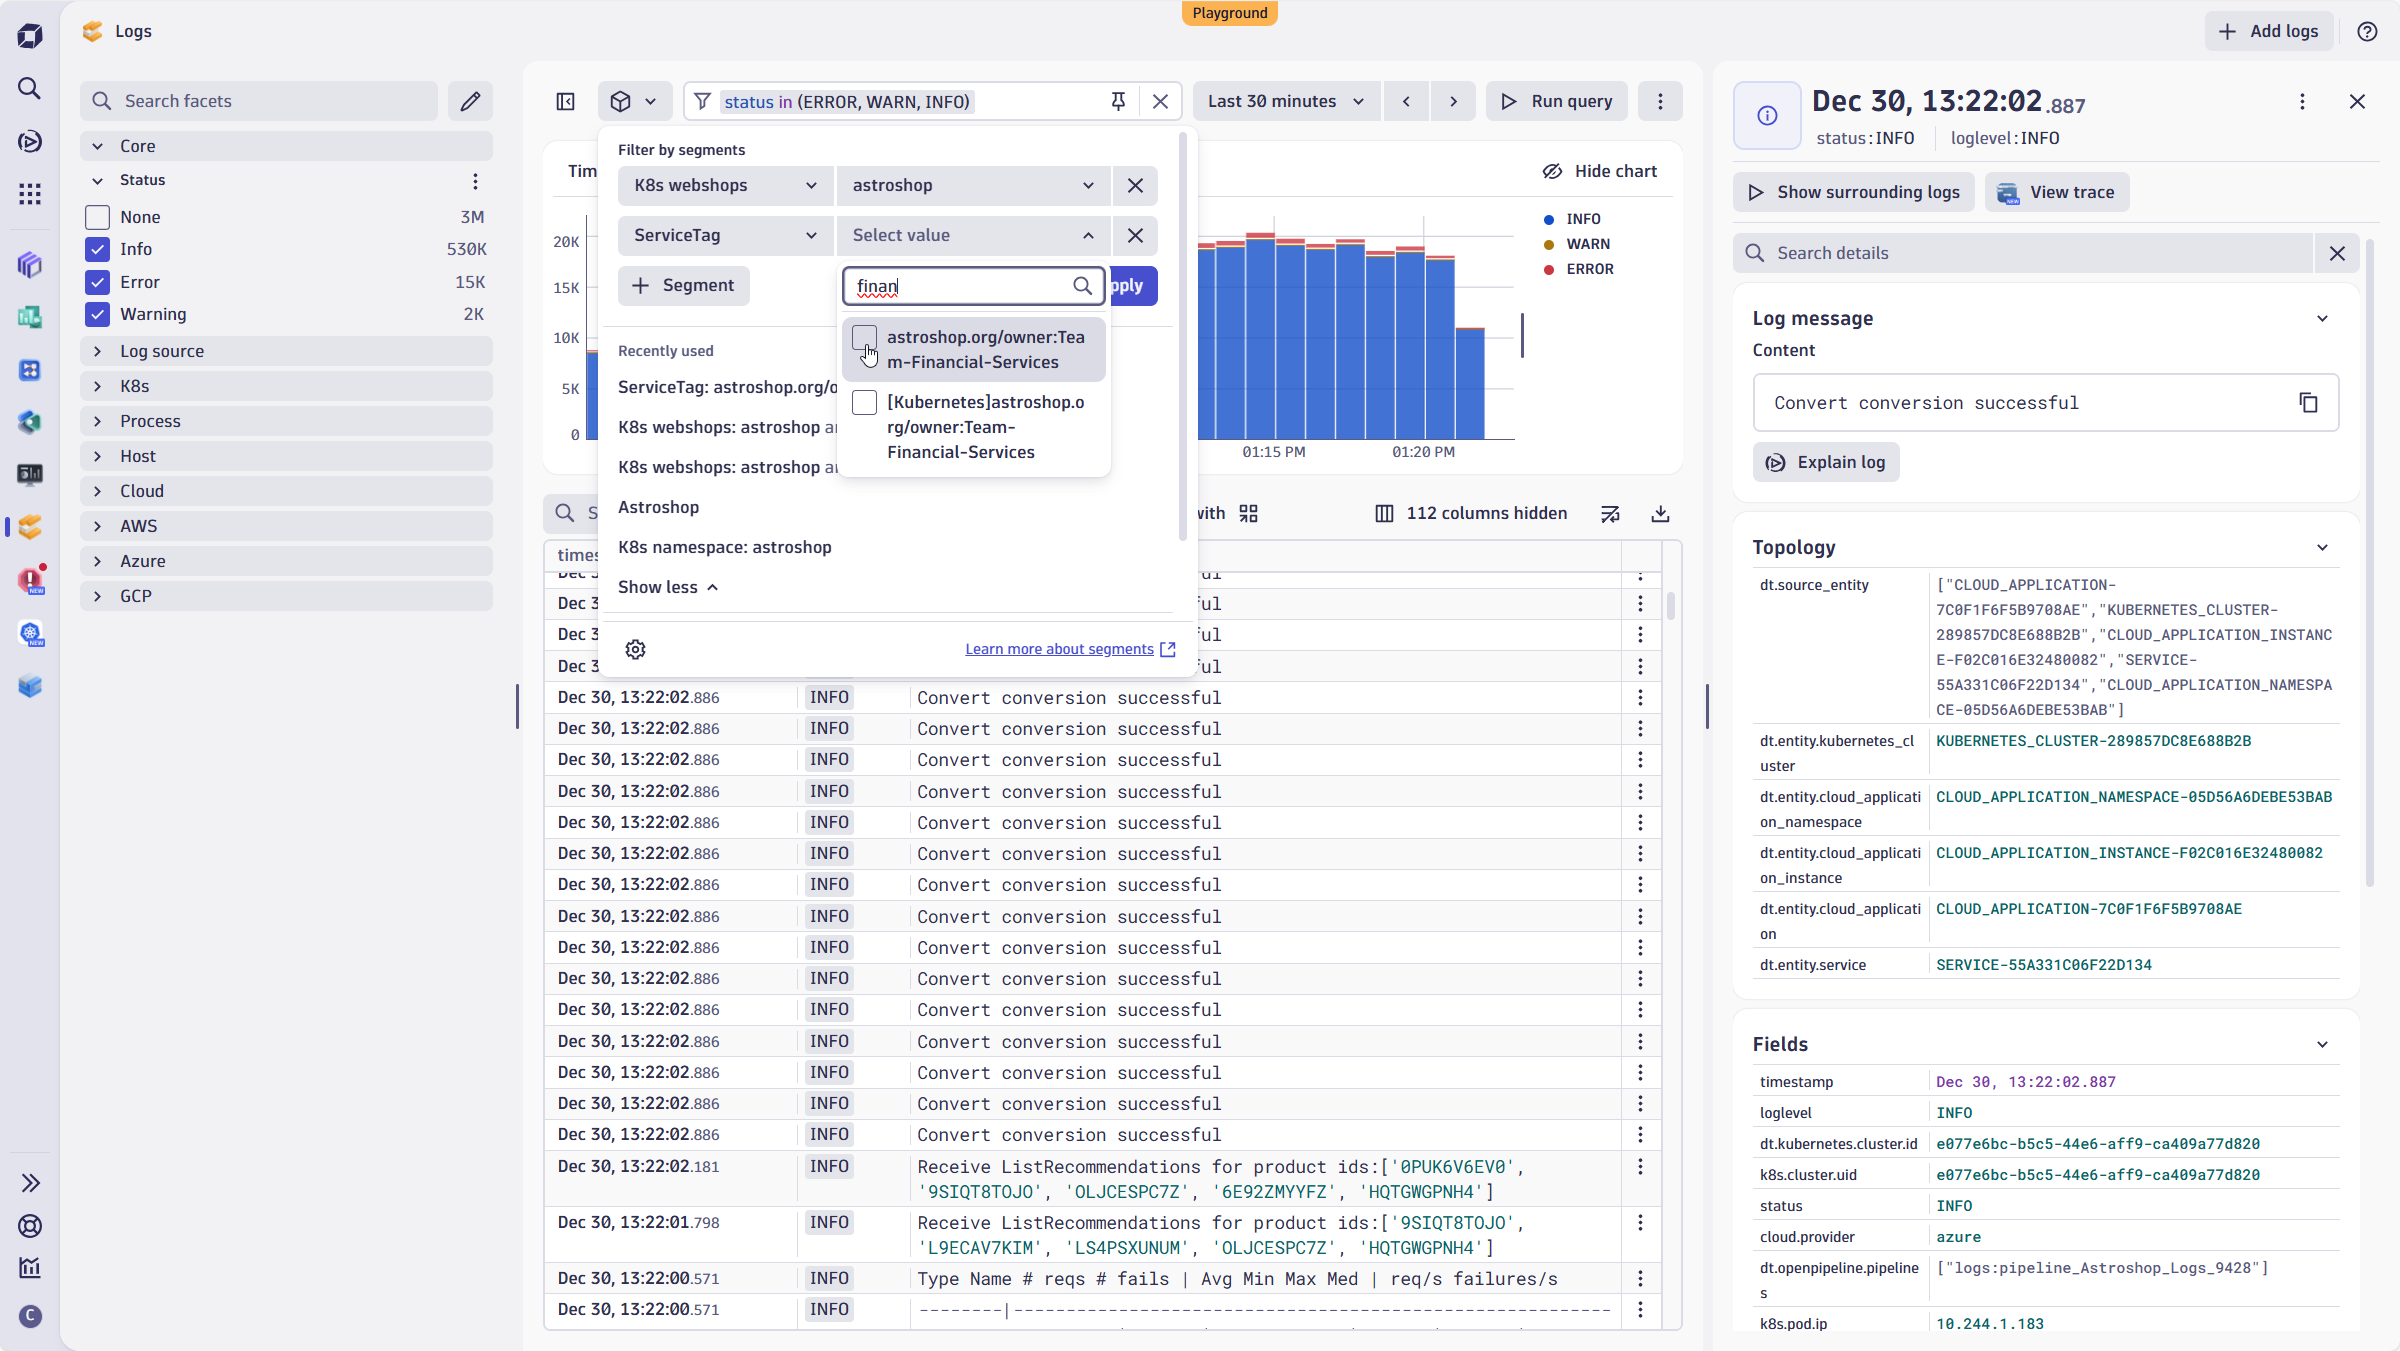
Earlier this year, we improved the simplicity of applying complex and advanced queries with new data segmentation and advanced filters.
Using segments, admins and power-users can provide reusable and pre-scoped filters. When paired with dynamic variables, users can easily modify filter conditions.
Simultaneously, we continued enhancing the Logs app to provide advanced click-to-filter capabilities in various areas, like pinning frequent queries and filters:
- Filter field: Suggest attributes, operators, and entities
- Facets: Gain a quick understanding of patterns and groups, or build queries
- Advanced filtering: Intuitive click-to-filter side pane, including JSON-structure log support with nesting
JSON‑structured log handling
Log messages aren’t always clean. A field might be hidden inside a nested message attribute or buried three levels deep in nested JSON.
Dynatrace log handling:
- Detects and normalizes JSON.
- Exposes nested fields in the UI without manual mapping.
- Provides human-readable log messages in the results across all apps that use logs.
This way, you and your users can focus on analysis, not plumbing and normalizing logs.

Correlation at scale
With Traces on Grail, your traces are automatically correlated in context with surfaced logs within the Distributed Tracing app, including associated exceptions.
The value you and your teams gain
If you’re accustomed to working with traces, you can continue using your troubleshooting routine and easily navigate from traces to logs and error exception messages. If you prefer to start your work by focusing on logs, you can achieve the same outcome.
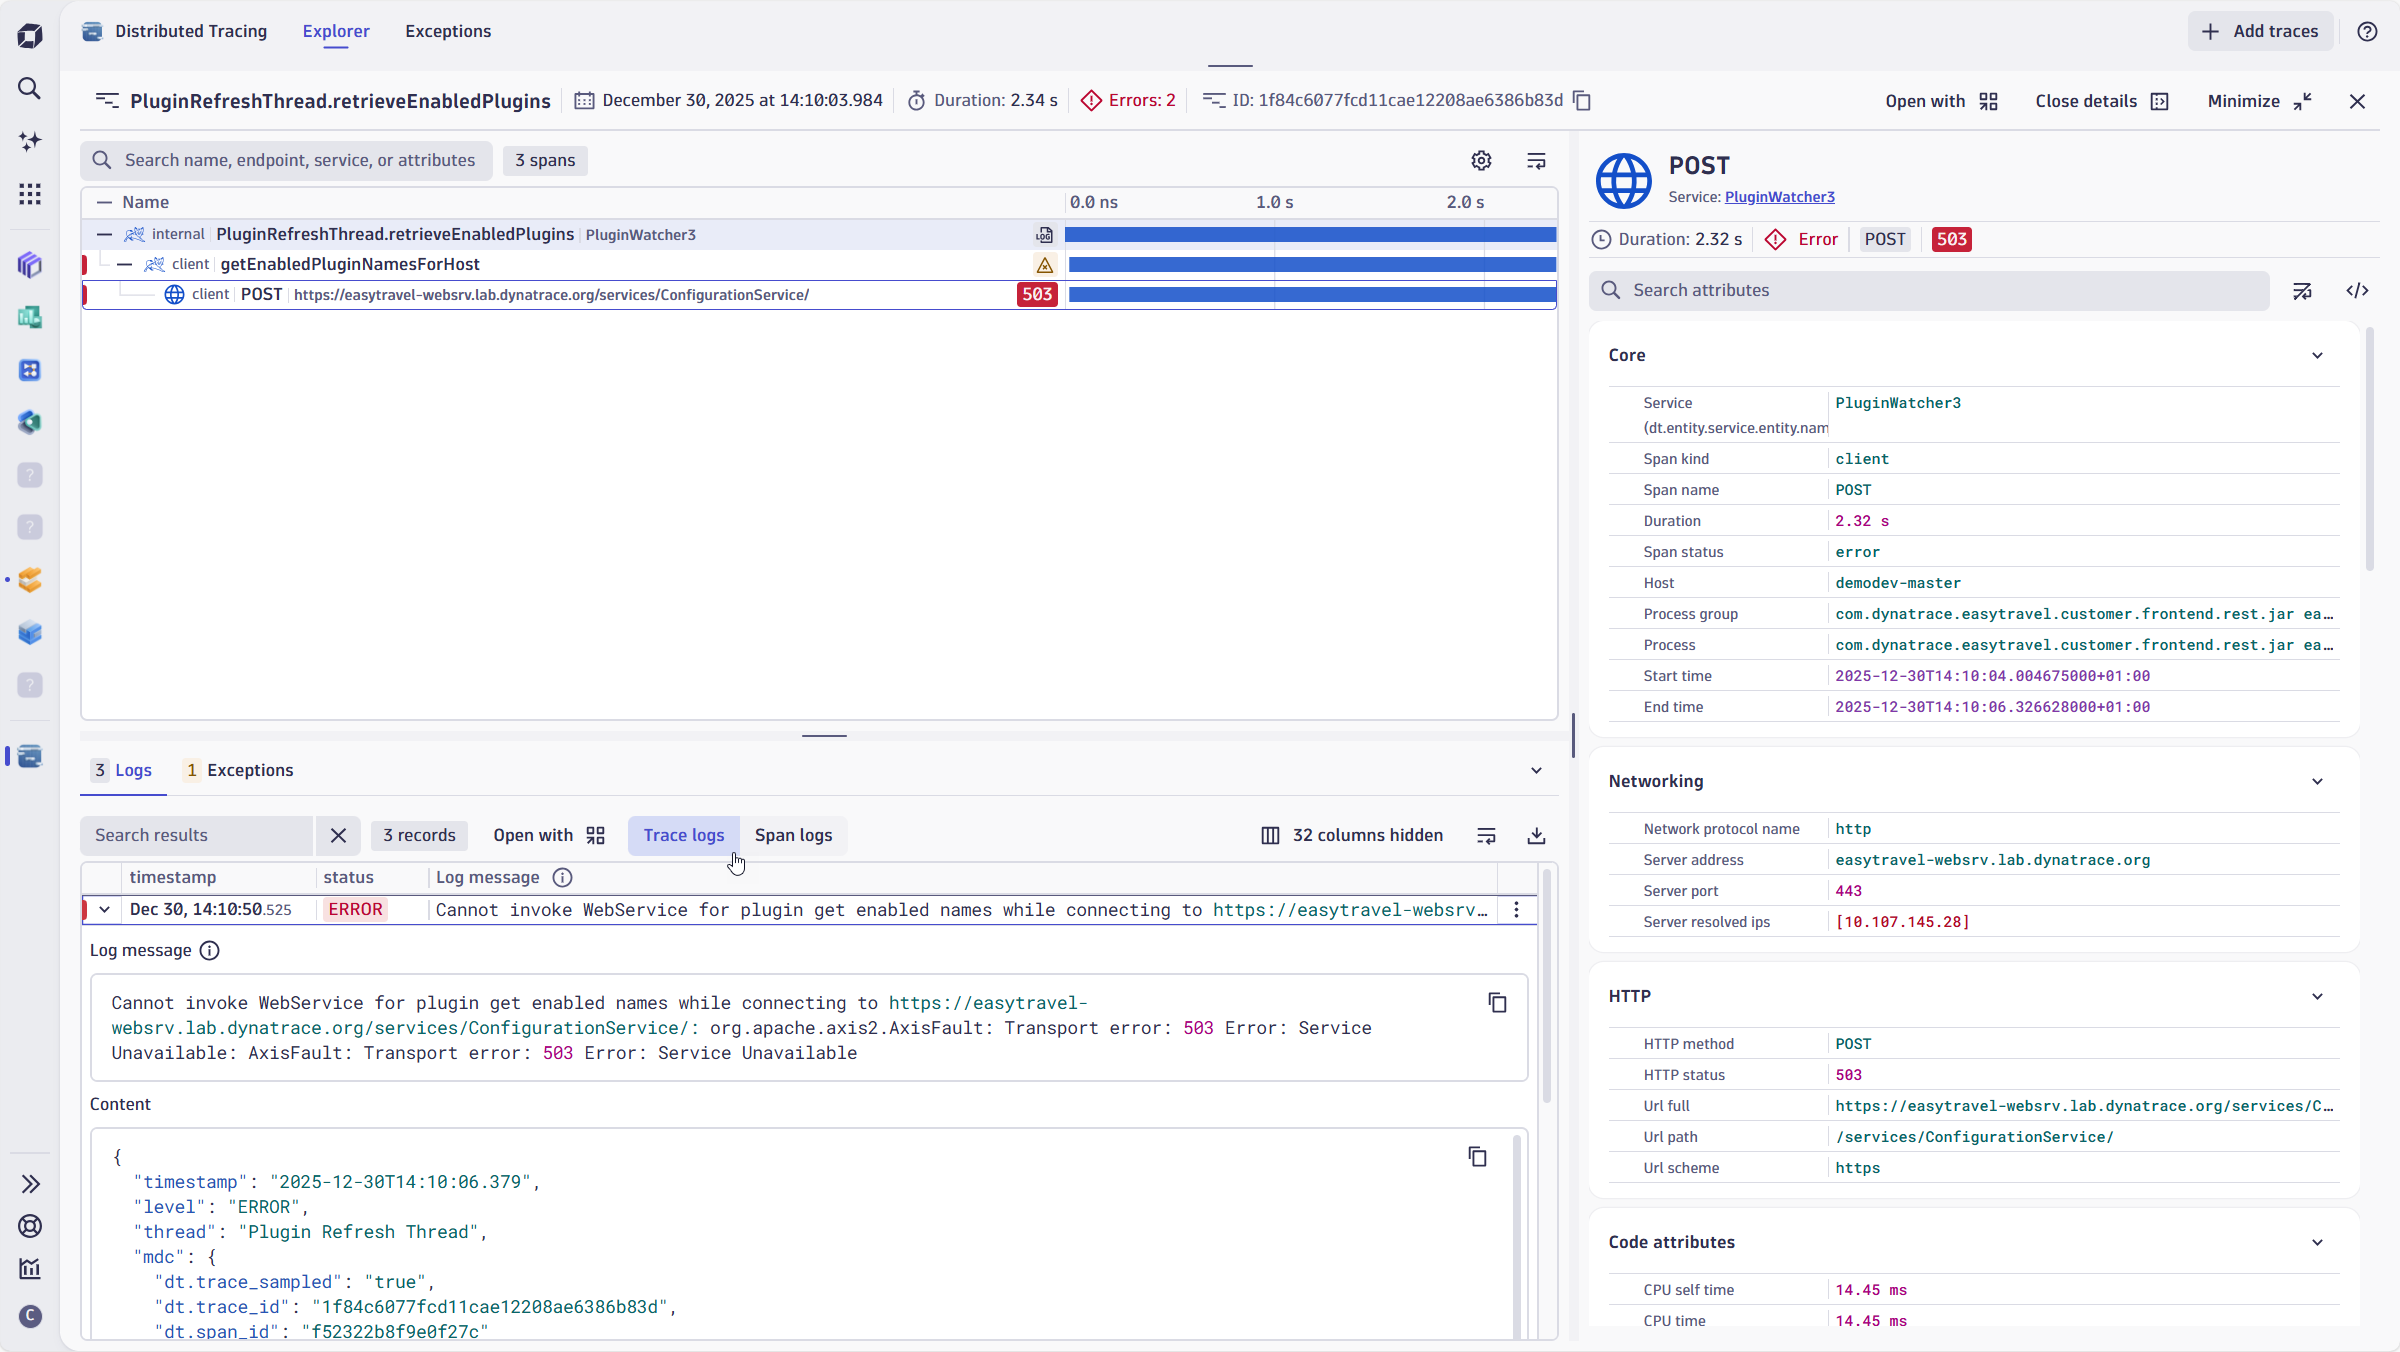
Remember, Logs in context are free with the Distributed Tracing app!
Fast log onboarding with unified ingestion from any source
You want all your logs, and you want them fast. You don’t want to wrestle with YAML files, forward scripts, or configure custom collectors.
Centralized configuration, self-service management, and enabling teams with granular permissions to collect and ingest logs—these are what customers asked for:
- OneAgent + Journald – Enhanced capabilities for automatically capturing logs on Linux machines with a single, centralized, configured agent: Dynatrace OneAgent®. Just deploy and watch the logs magically appear in your tenant.
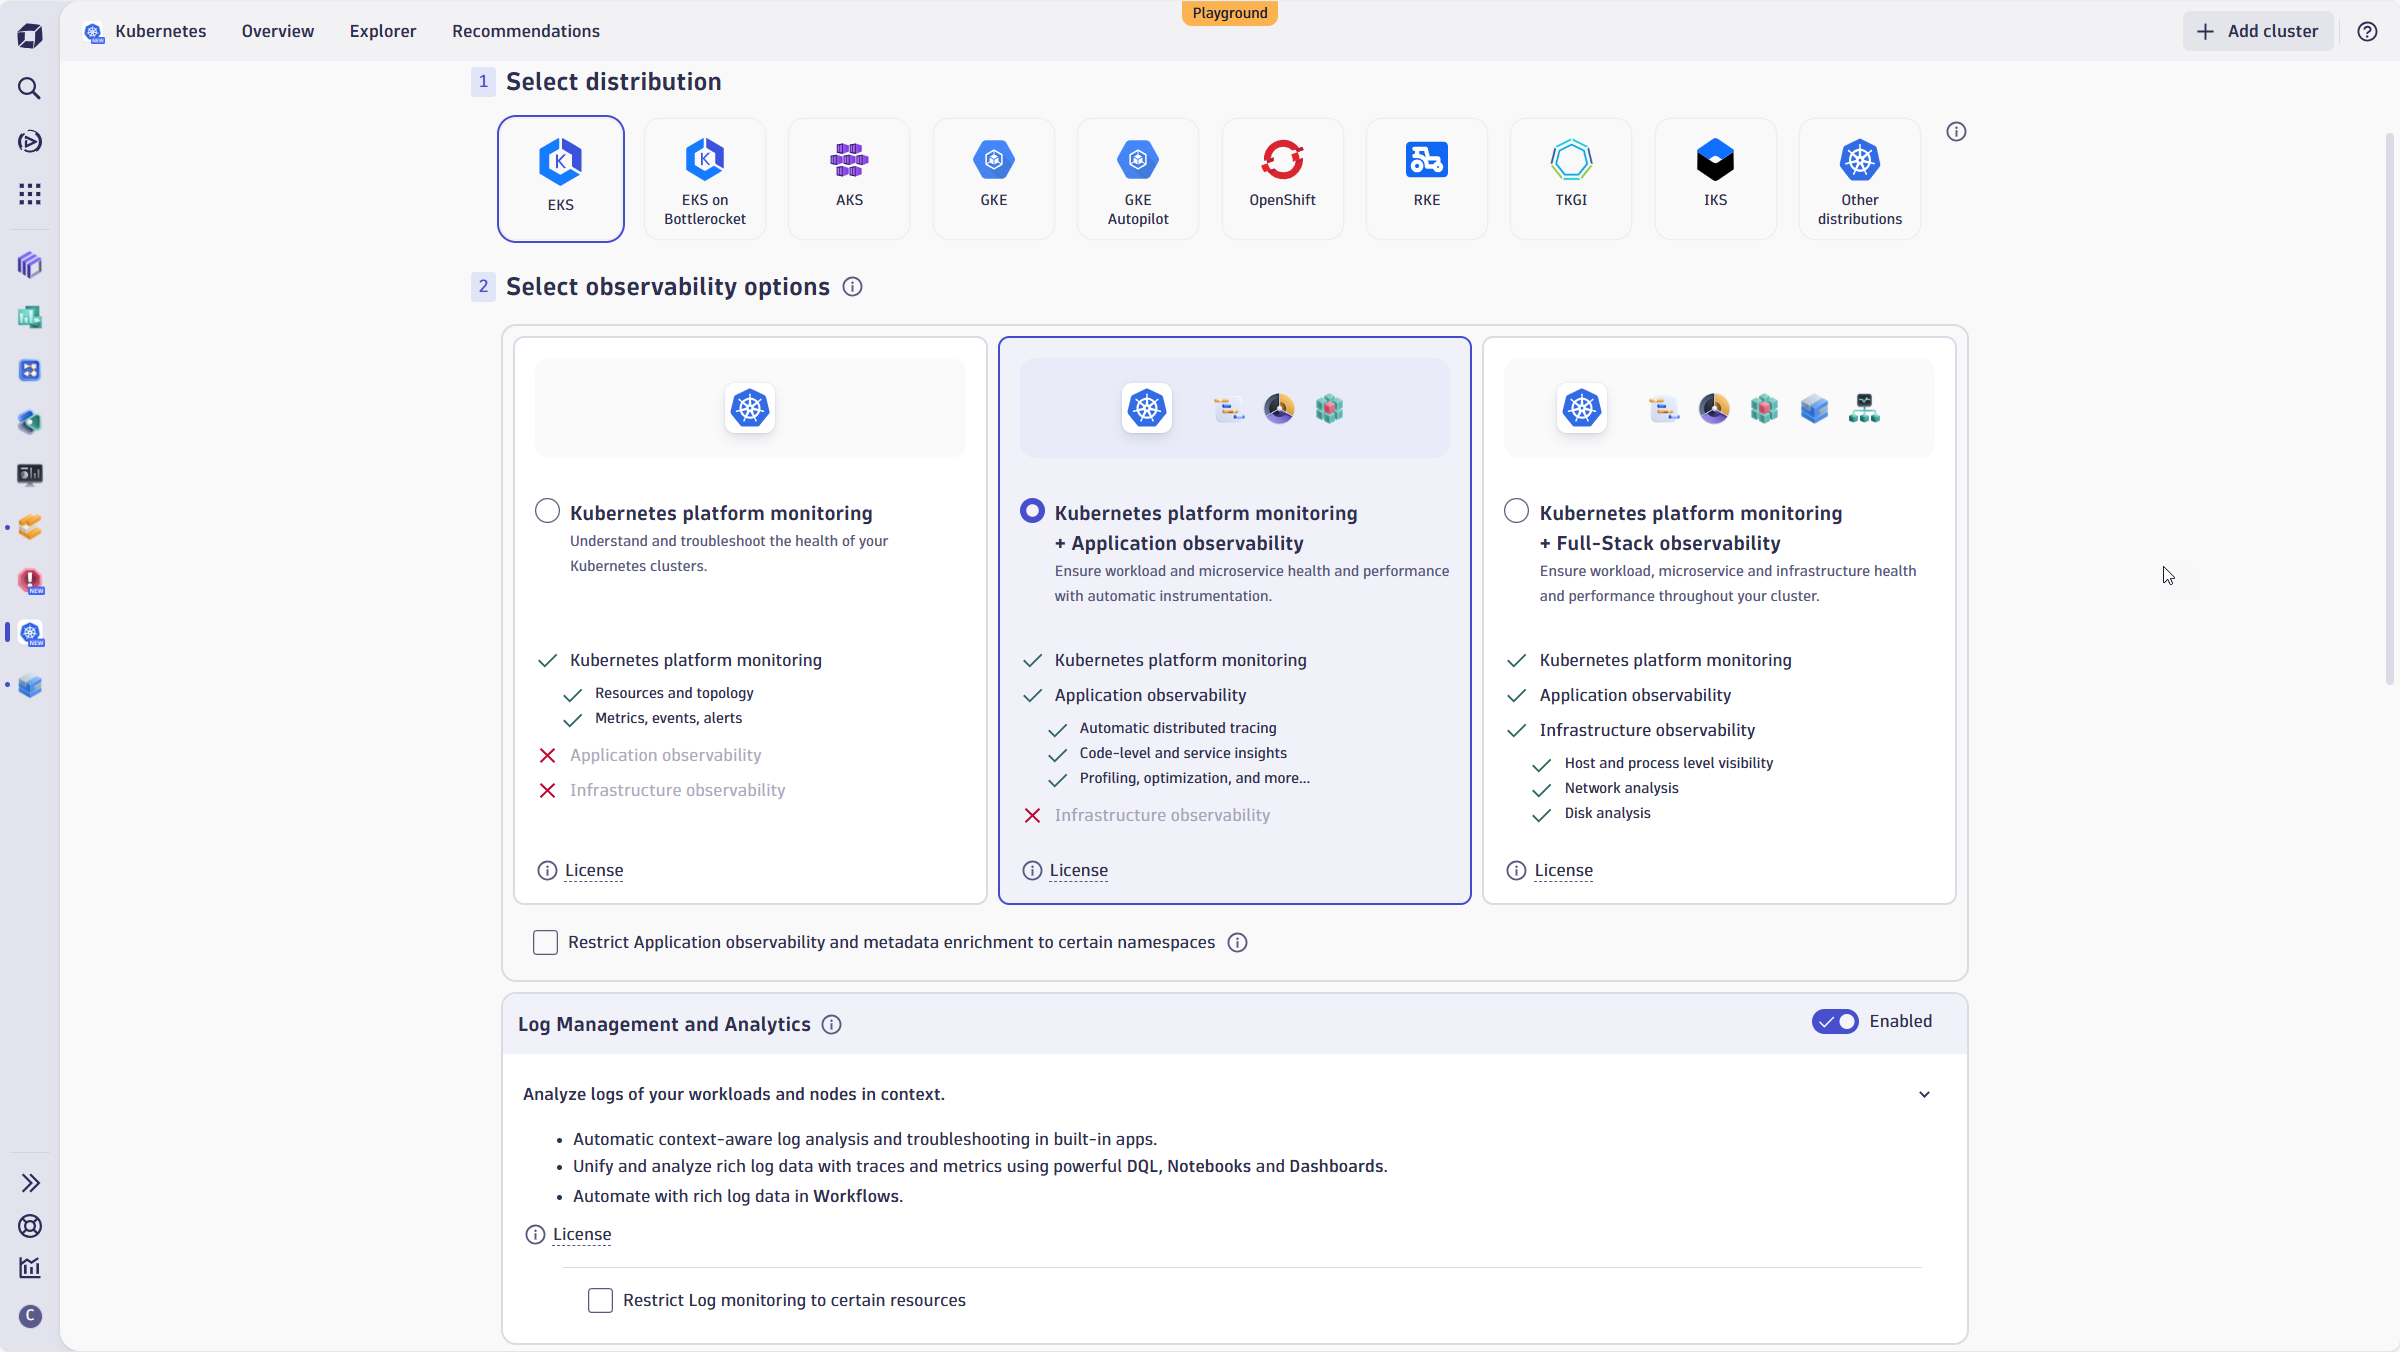
Kubernetes logging made easy – The Dynatrace Kubernetes Logs Module gives you complete visibility without requiring OneAgent to operate in Full-Stack mode or to configure OTel manually.
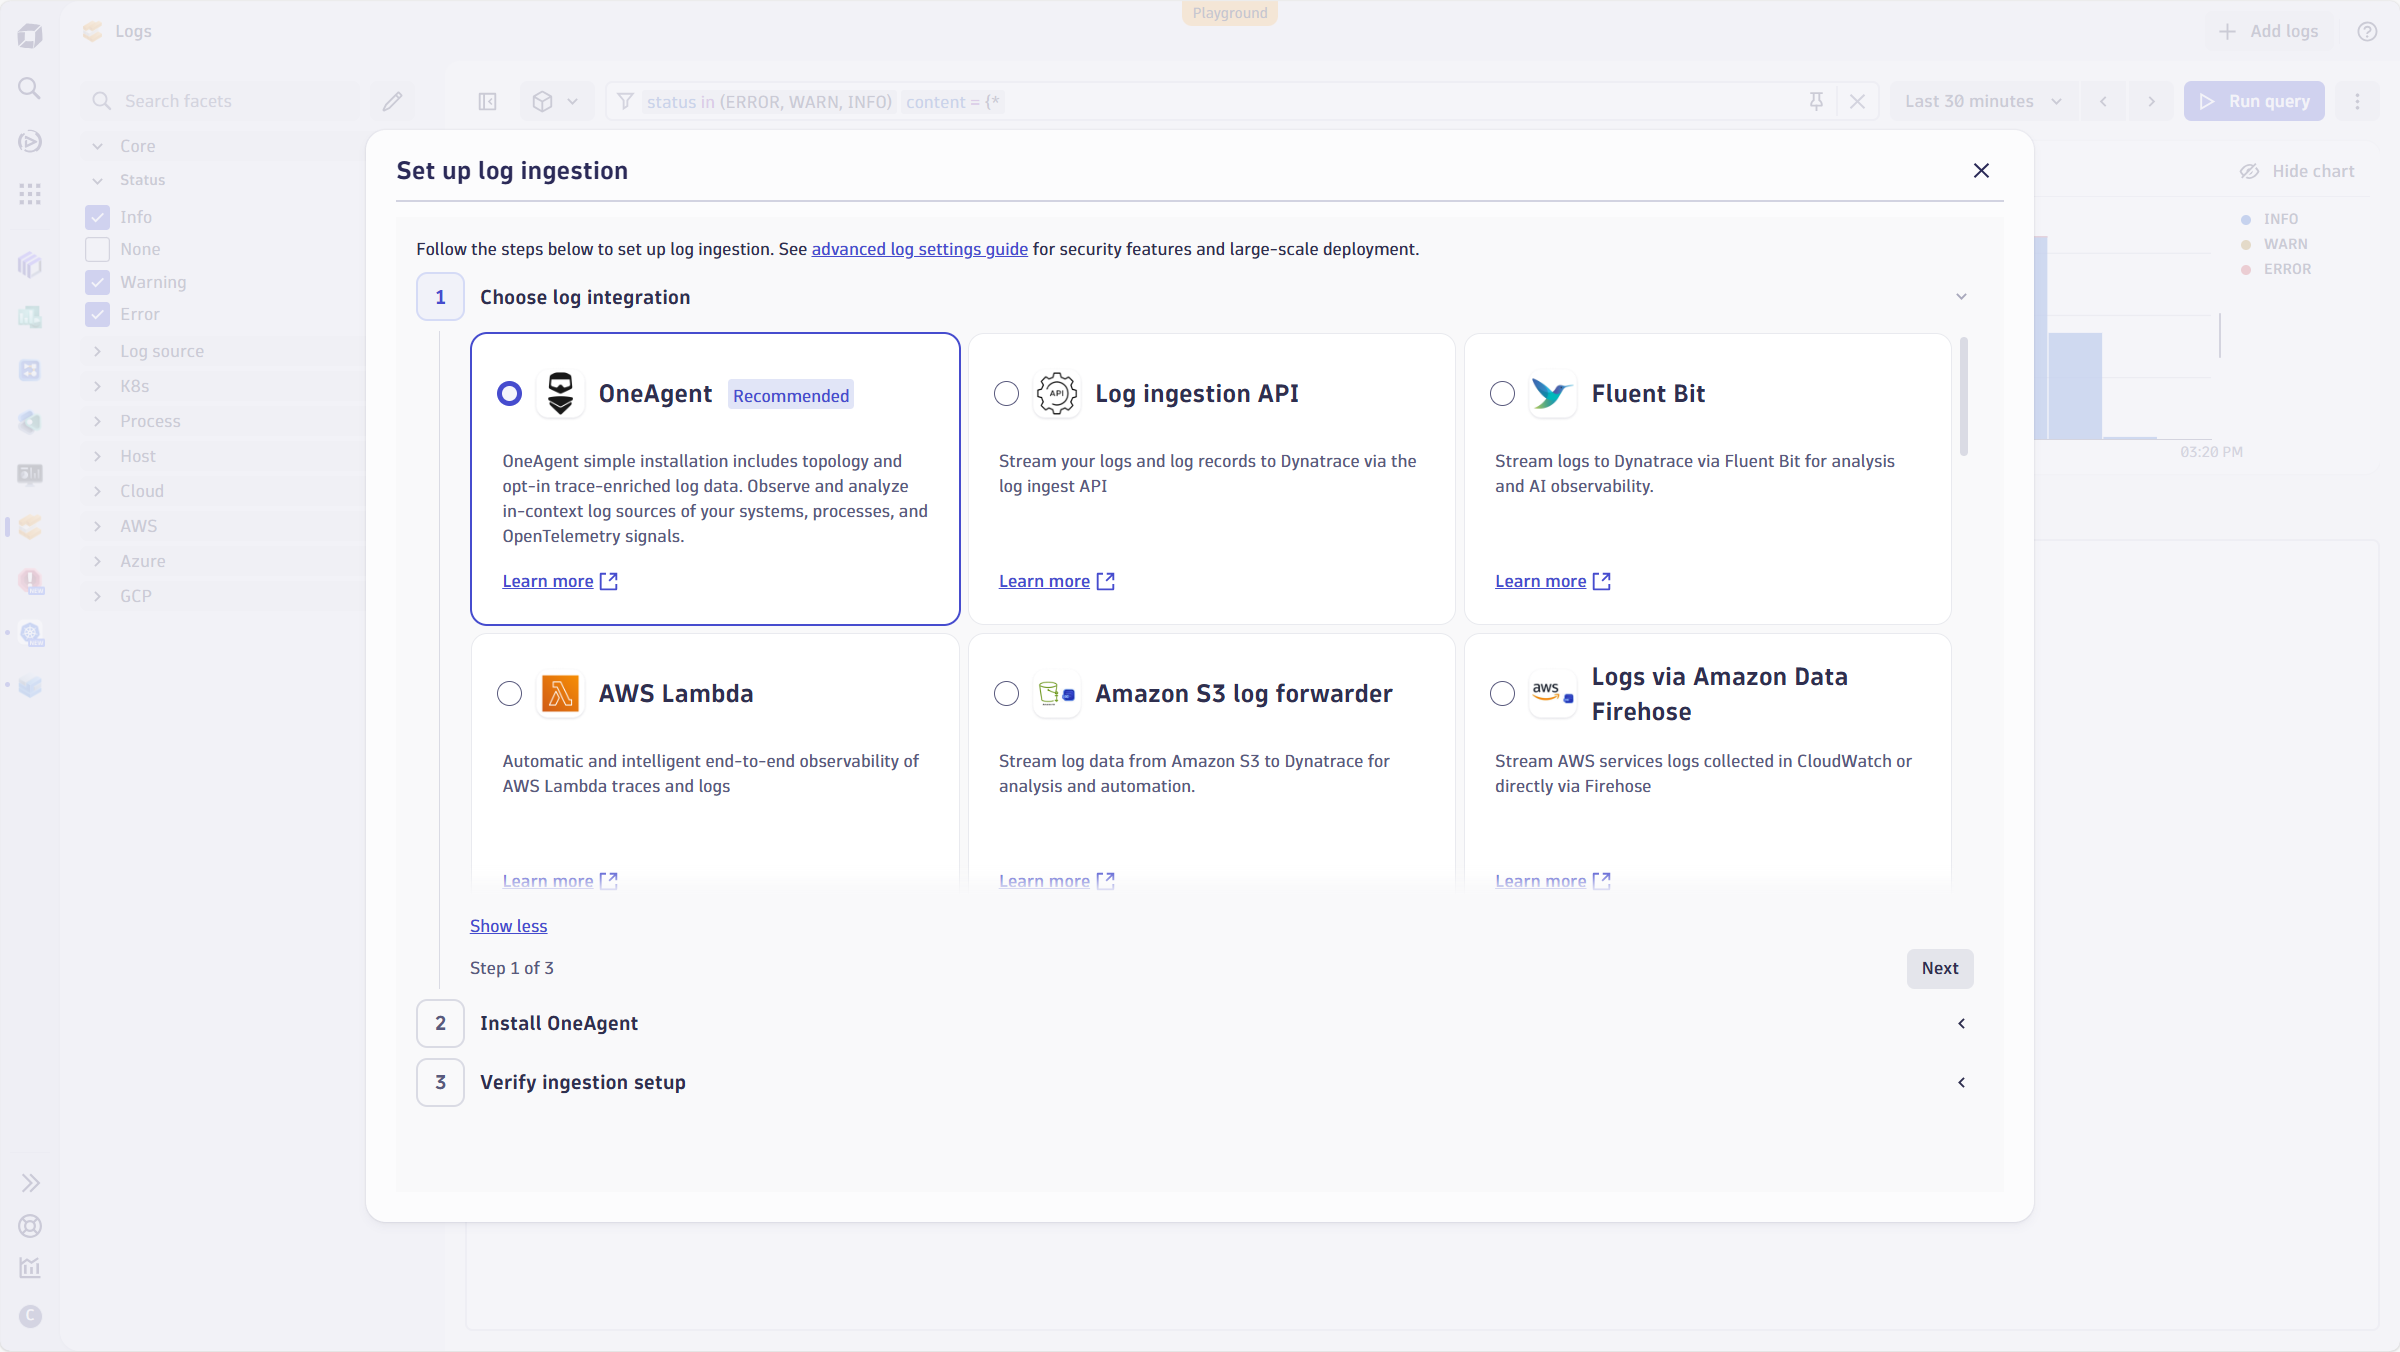
- Log Onboarding Wizard – To further simplify the onboarding experience, we’ve introduced a new wizard across several apps. When logs are missing, or you manually launch the wizard, it provides guided steps to onboard your logs, including creating an API key.
Scale that never breaks
You can ingest up to 1 PB of logs per day per tenant, which should eliminate most sizing or scaling headaches. This bandwidth is part of the Dynatrace SaaS magic: Dynatrace Grail stores and processes everything in an indexless manner and using schema on-read. At the same time, OpenPipeline® routes the telemetry according to your rules and requirements defined in the pipelines.
- Thousands of pipelines and self-service: Every pipeline has fine-grained permissions, so teams can create isolated pipelines and self-service onboarding, processing, and routing to buckets for retention.
- 120+ parsing processors – From JSON normalization to custom field extraction, you can assign a processor to a pipeline and let OneAgent do the matching magic for you. Are you using OpenTelemetry or Cribl? Matching conditions or technology attribution offers you the same experience, regardless of the log source.
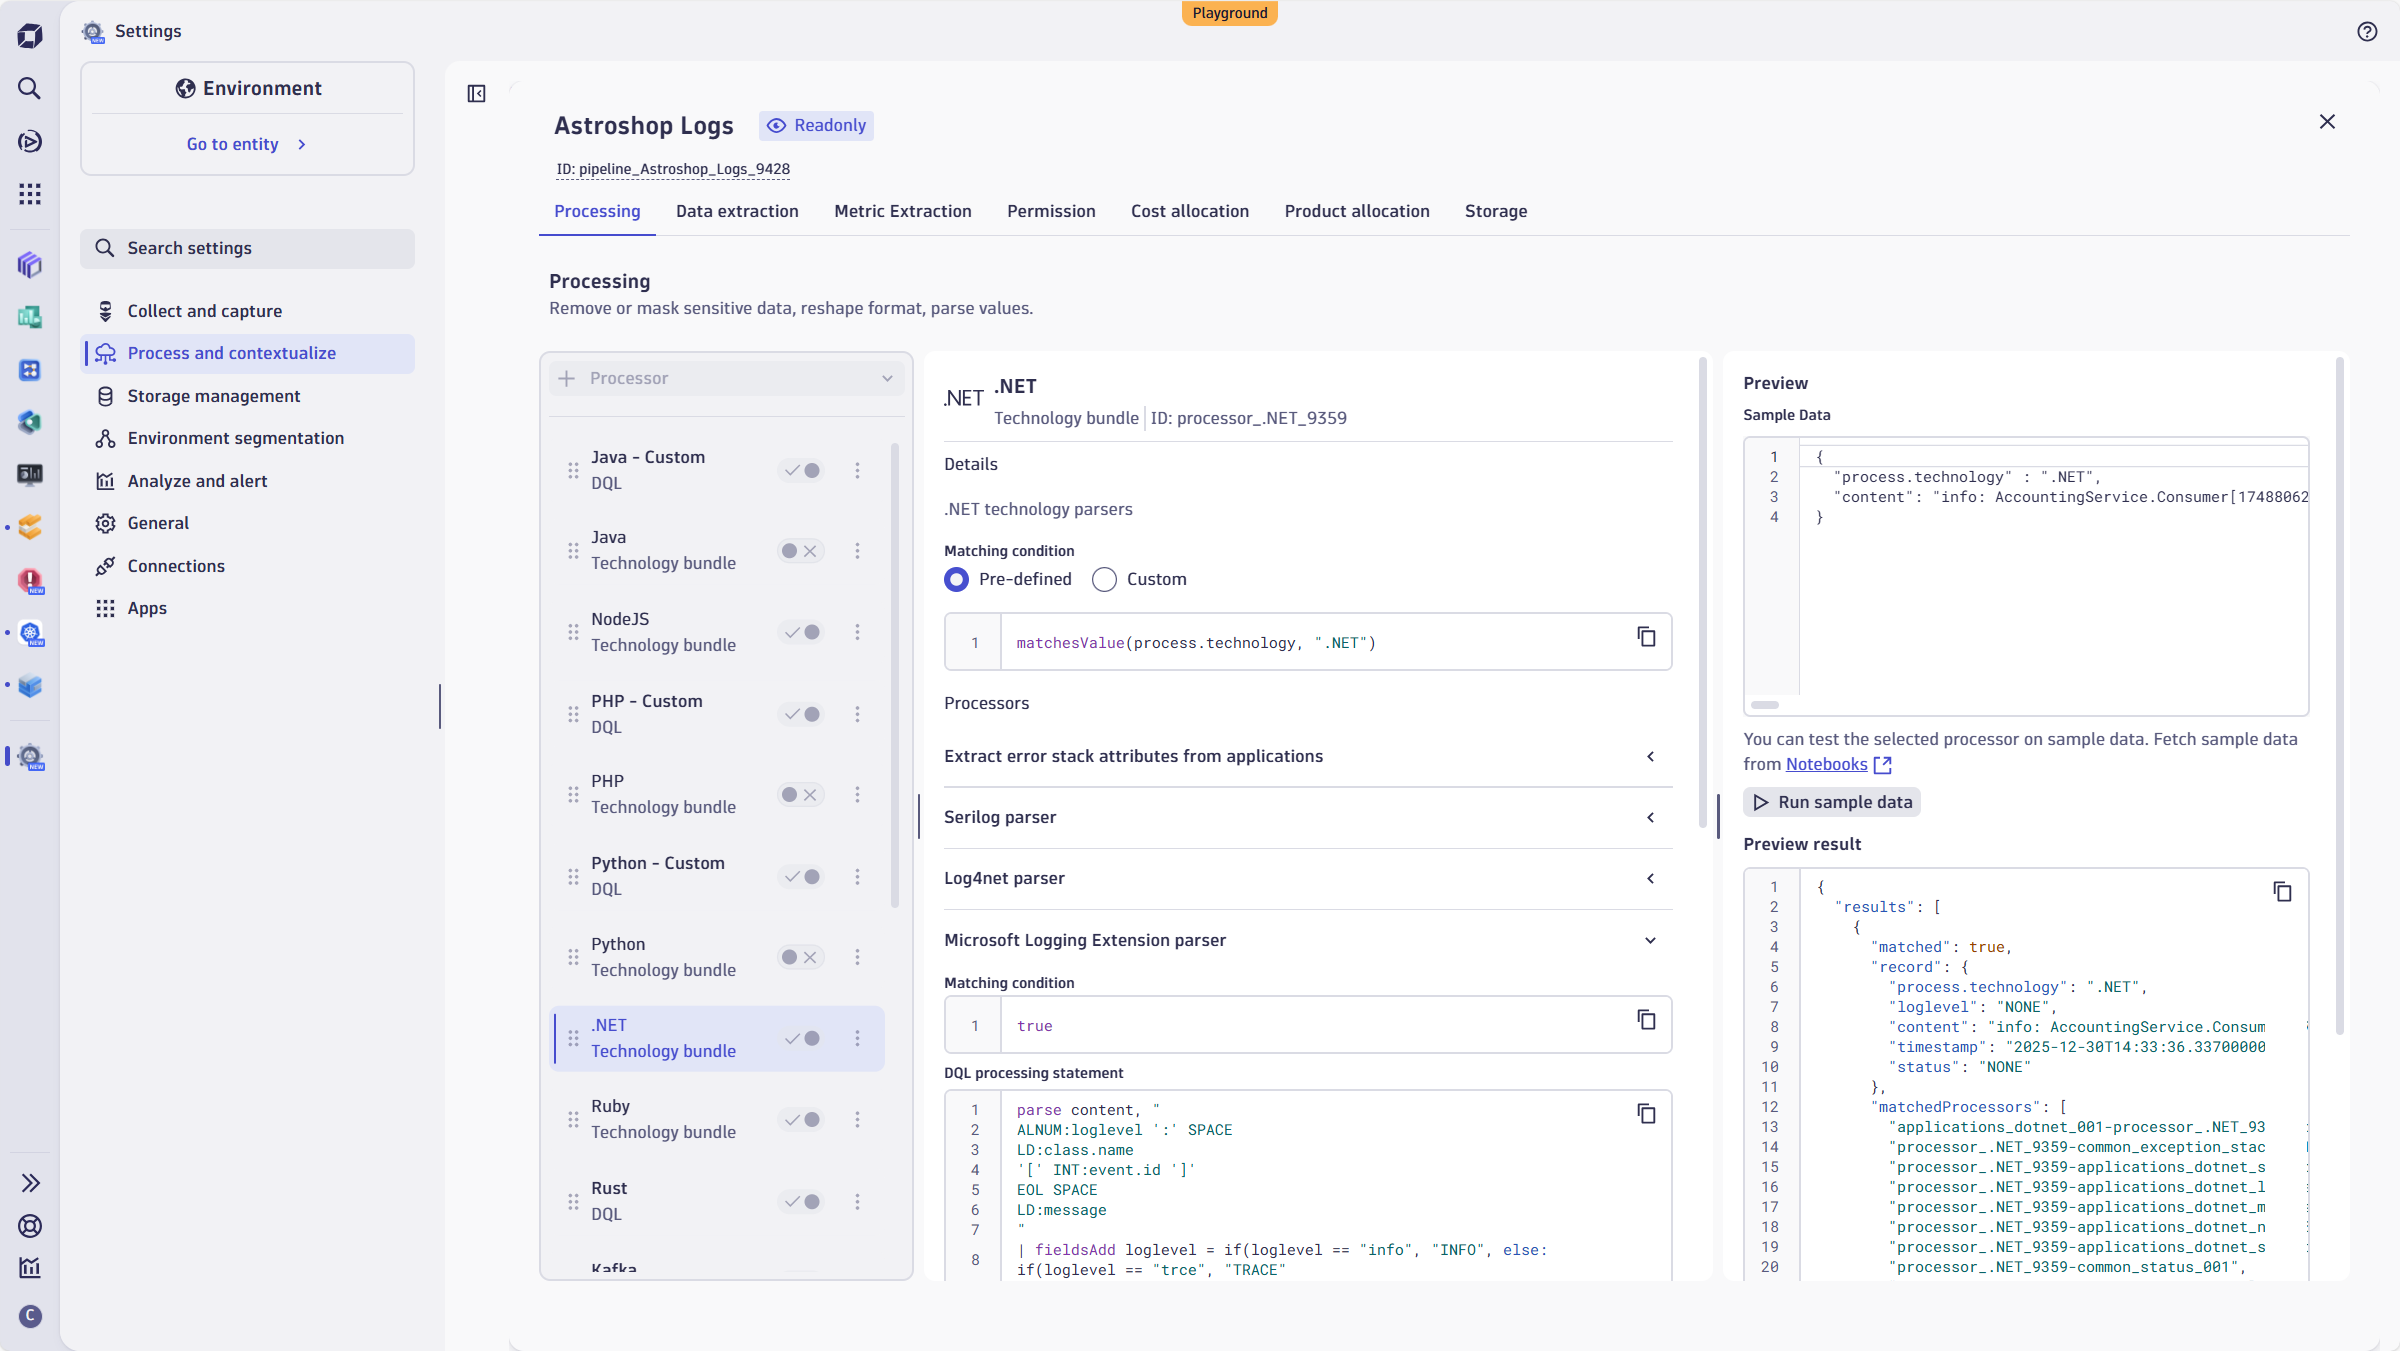
Figure 8. 10 MB log records – In our Go big with Dynatrace blog post, we discussed why large log records aren’t an anomaly and how customers benefit from out-of-the-box support for large log records.
With Dynatrace, your log ingestion stays ahead of your growth curve, no matter how many new sources you add.
Keep your costs predictable
Large enterprises often need to charge back to internal business units. We’ve introduced increased flexibility for existing features related to chargebacks:
- Retain with Included Queries: Configurable on the individual bucket level, and seamlessly combinable with the established usage-based IRQ model.
- Cost Allocation: Attribute your logs, metrics, and traces with business‑unit and product labels. This supports your FinOps efforts, as recently discussed in our blog post, Cost Allocation for Logs.
Best Practices: Not everything we delivered in 2025 was a product enhancement. We’ve also delivered a new best practices section in our product documentation, based on field feedback from pre-sales, post-sales, and support teams.
If you prefer to watch a webinar recording instead of reading, we recorded a video that walks you through all the best practices detailed in this blog post.
Dynatrace YouTube Series | Optimize your logs: Save money and boost performance
Ready to get started?
Let’s make observability effortless, not overwhelming.
Your team can spend less time chasing logs and more time delivering value. Dive in today and experience the power of an observability platform that was built for the future of IT.
If you’re using Dynatrace SaaS with a DPS contract, all the features mentioned in this blog post are available to you. If you’re not, why not start a free trial today and experience the value yourself?
Resources
Dynatrace University – Free training that covers everything from basic log ingestion to advanced analytics.
Dynatrace Playground – Our free sandbox tenant with sample log files, ready to explore log


Looking for answers?
Start a new discussion or ask for help in our Q&A forum.
Go to forum