Update: Dynatrace is pleased to announce another industry first: automatic, end-to-end observability for AWS Lambda functions in Node.js and Python via traces. By leveraging the AWS Lambda Extensions API, Dynatrace brings the unique value of its Davis AI-engine for fully automatic root cause analysis to AWS Lambda. This means you don’t need to change even a single line of code in the serverless functions themselves.
Application workloads that are based on serverless functions—especially AWS Lambda, Azure Functions, and Google Cloud Functions—are a key trend in cloud-first application development and operations. With a serverless approach, you can build and run applications and services without thinking about servers. There are many benefits to this approach: reduced operational costs, reduced complexity, reduced engineering lead time, greener hosting and computing, and many more.
To better understand real-world use cases and pain points, we have:
- Launched a Preview release of AWS Lambda monitoring.
- Delivered product capabilities like Dynatrace Davis® Assistant via AWS Lambda.
- Worked with over 200 customers over the last two years, among other enterprise customers, to explore how new features work in high-load production environments. This has led to improvements such as adding a special Lambda mode that sends data off quickly by integrating with our serverless framework.
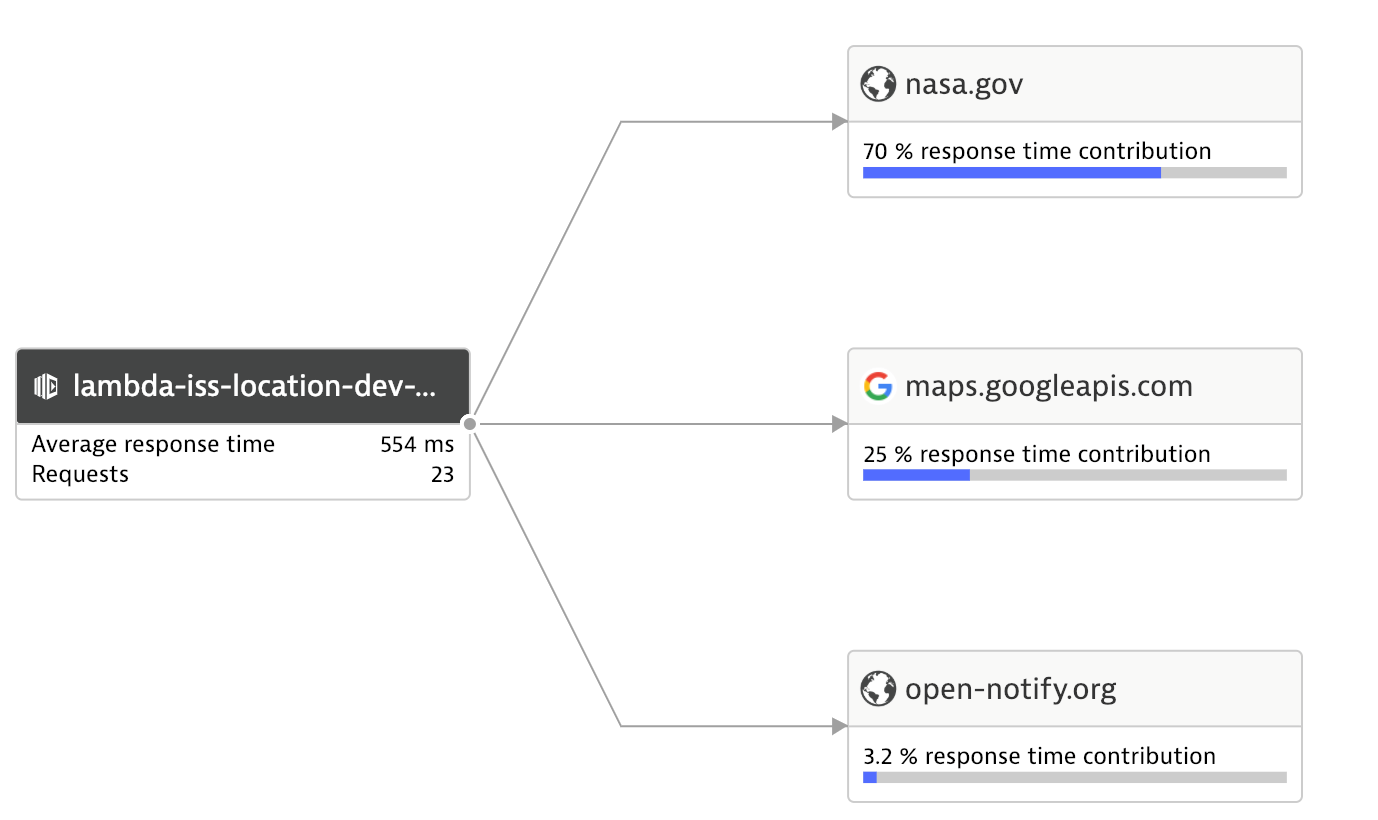
The image below shows the Dynatrace service flow of a Lambda function calling several third-party APIs.
Taking Dynatrace AI-based serverless monitoring to the next level
Our roadmap for serverless function monitoring is based on three main pillars:
Monitor every language and see user experience in one unified view
Serverless functions are implemented in different languages and on a variety of platforms. We’ve come across applications that use Node, Python, and Java hosted on AWS, Azure, and GCP, all at the same time. Monitoring user experience in such circumstances can be very cumbersome. What you need is a single, unified view of how your users experience your applications, without the need to understand the ins and outs of each platform.
In the future, you’ll be able to integrate Dynatrace for every language and analyze user experience regardless of the platform on which your monitored application runs. This will be closely tied into our polyglot platform integrations, as is already the case for AWS.
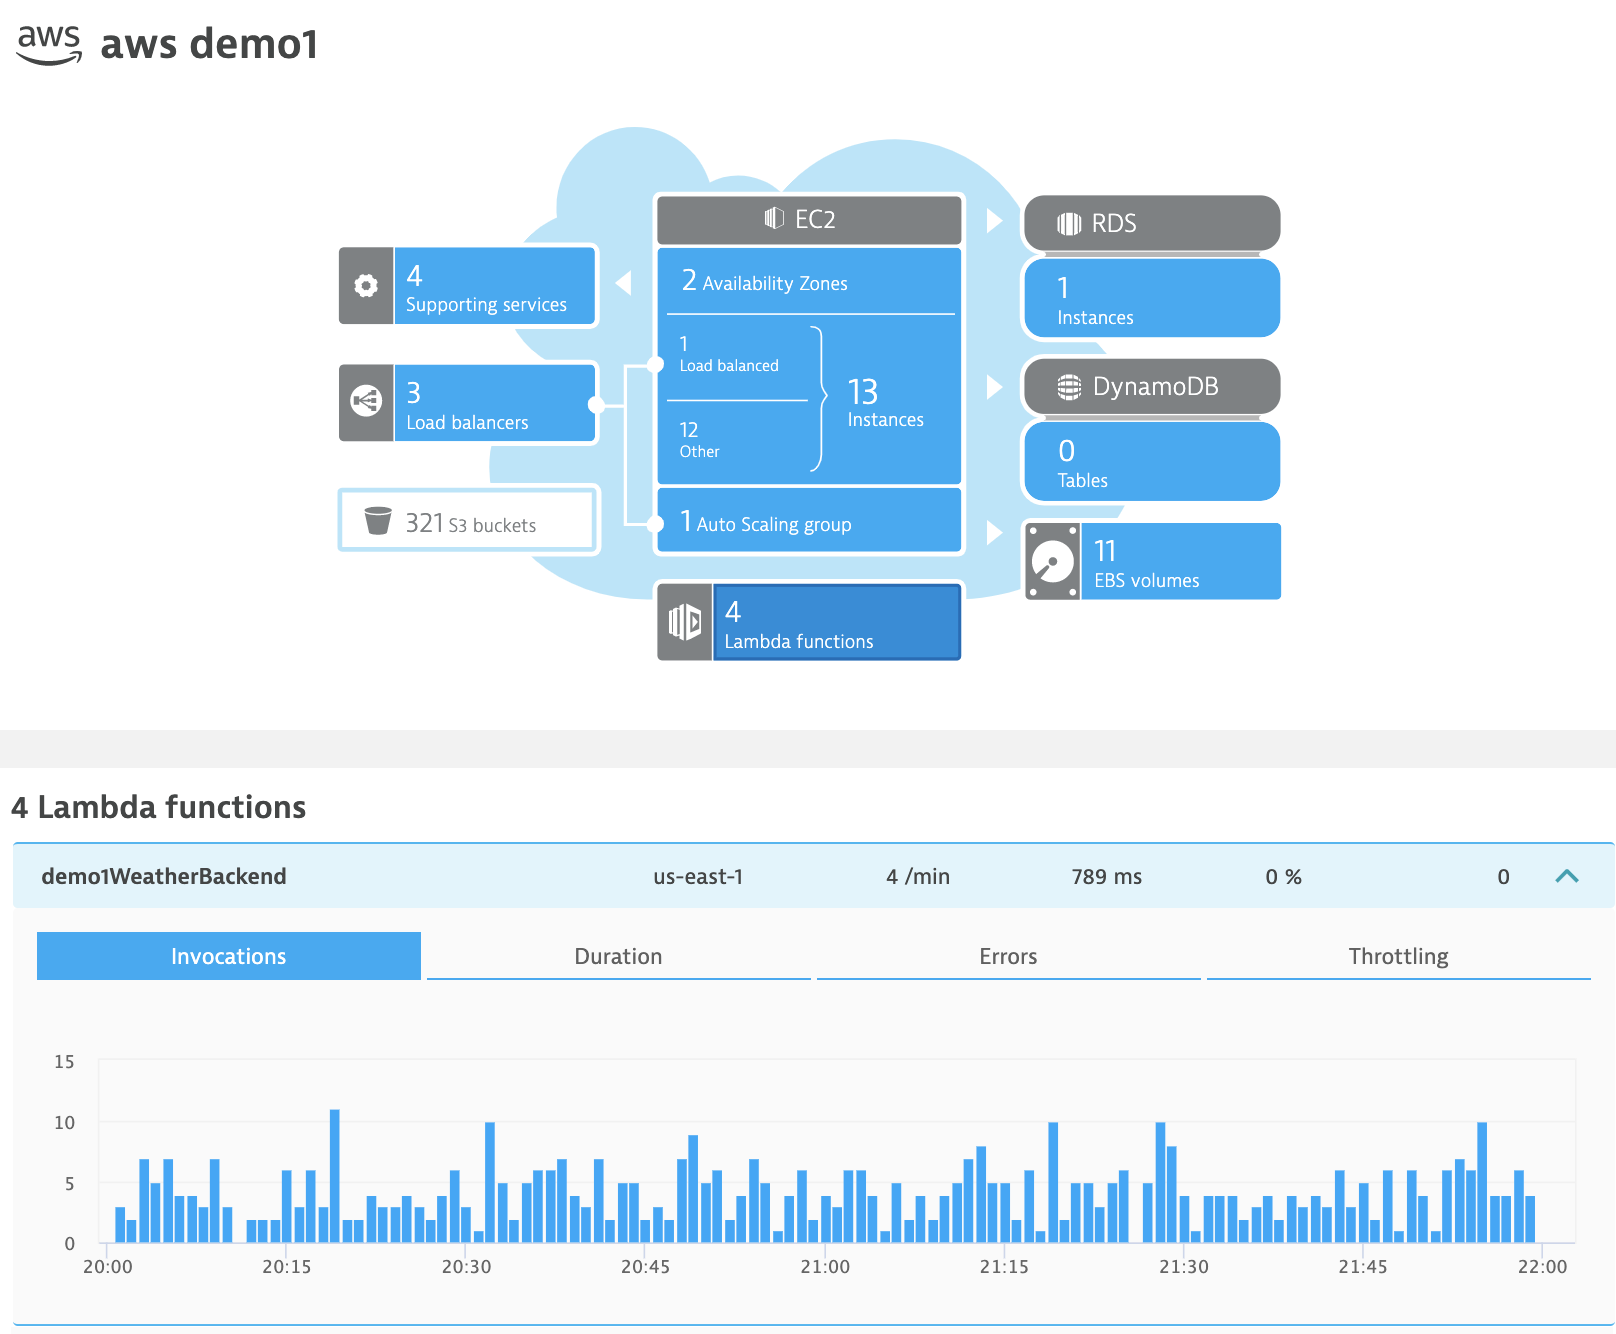
The image below shows Dynatrace AWS Lambda integration.
Find problems faster with end-to-end tracing
Serverless functions are rarely standalone but are part of complex applications that may be multi-cloud or even hybrid. A transaction that begins on-premises, runs into AWS Lambda, calls an Azure Function, and then calls back to the back end on-premises should be traceable with no gaps.
As a software intelligence platform, Dynatrace supports your multi- and hybrid-cloud deployments. Moreover, with our end-to-end-tracing, we provide you with the tangible data you need to find problems quickly in your serverless stack.
Focus on data that matters (noise vs. signal)>
In autoscaling systems with hundreds or even thousands of small functions, individual instances of a function don’t matter. However, aggregated metrics, traces, and topology information do matter. This information feeds our Davis AI causation engine with the right breadth of data so it can provide proactive and precise answers.
With Dynatrace, you can focus on collecting actionable information. This reduces the amount of data and the processing time needed to send it off to the back end.
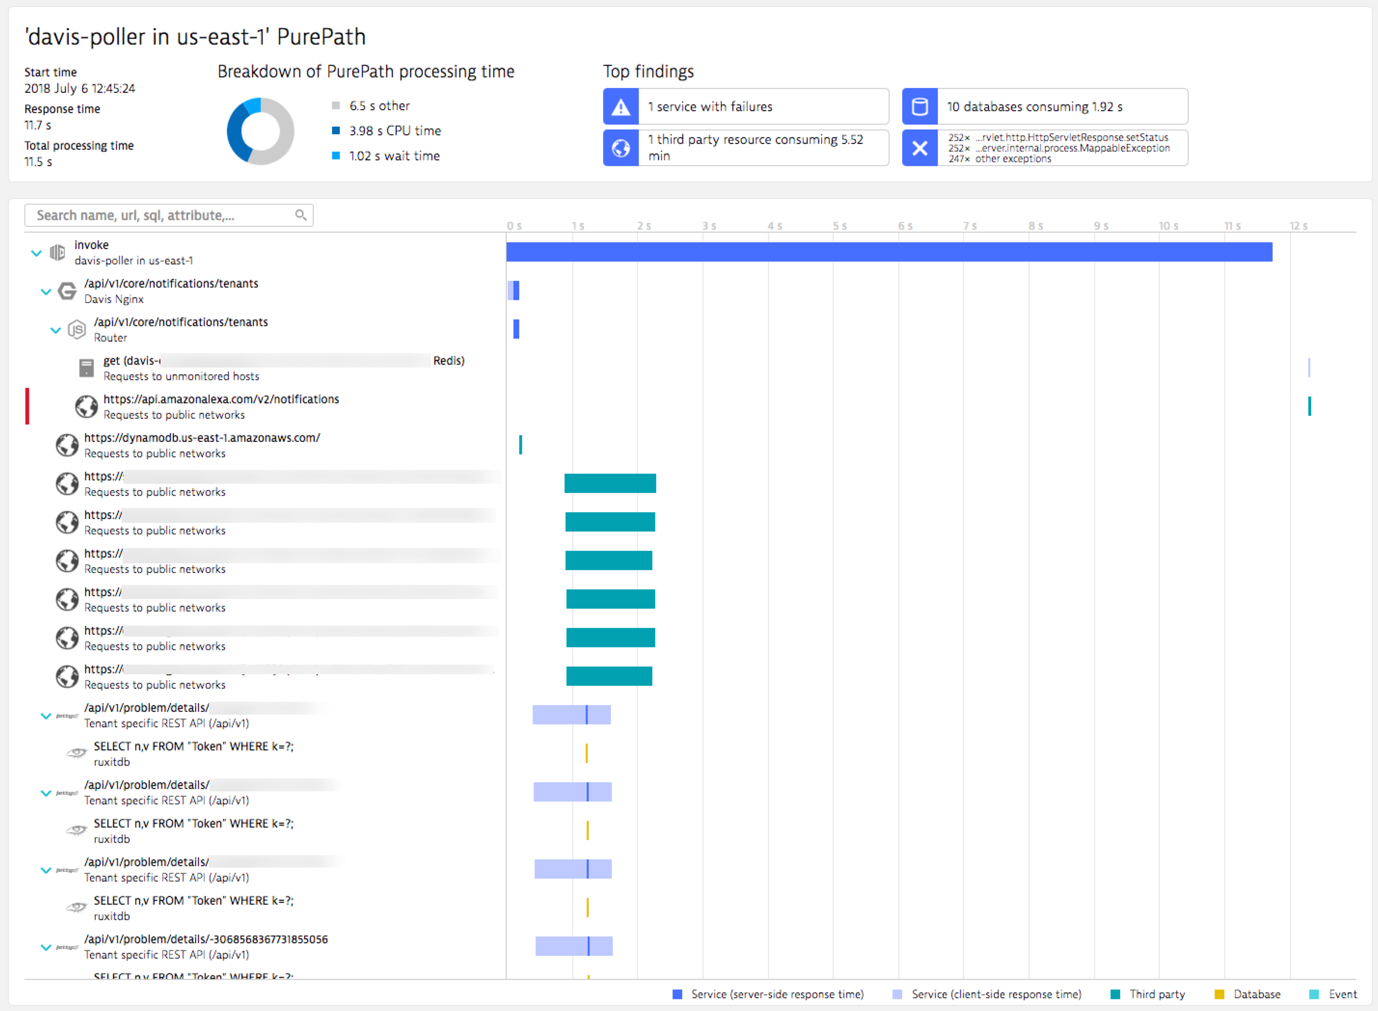
The image below shows the Dynatrace PurePath through AWS Lambda taken from Davis Assistant.
Dynatrace, an integral part of the OpenTelemetry project
OpenTelemetry agents don’t provide the same depth of insights as Dynatrace OneAgent, however, as mentioned above, this higher-level approach can be beneficial for serverless functions where it’s more about tracing and metrics and not about deep, code-level visibility down to the CPU level.
Our goal is to make data collection in serverless functions a commodity while providing enterprise-grade stability, fixes, and support to our customers.
What’s next?
OpenTelemetry is currently under development, and we expect a GA release in the first half of 2020. We’ll continue our investment into this project and we plan to release our new serverless monitoring offering around that time as well.
Is the current Preview still available?
Yes! While we work on the next generation of our FaaS monitoring, we’ll continue to accept applications for our Preview. We’ll be selective in our choice of use cases to make sure that the Preview provides value to our customers as well as new insights for us.



Looking for answers?
Start a new discussion or ask for help in our Q&A forum.
Go to forum