
Dynatrace end-to-end visibility, as well as proven code-level analysis from cloud to the mainframe, gives enterprises a huge competitive advantage–they can significantly eliminate inefficiencies and innovate at a faster rate.
IBM Z power billions of transactions each day and are used by most Fortune 500 companies. Over the years however, classic mainframe environments have been transformed, with their services frequently linked to distributed systems or a cloud. For many organizations, these back-end technology layers reveal blind spots in their current approach to monitoring. Spotty monitoring coverage makes it hard to identify, analyze, and resolve performance problems, which can endanger key business transactions and impact users. A lack of visibility can also result in runaway MSU usage costs that can reach into the hundreds of thousands of dollars when inefficiencies and errors that go unseen.
Unlike other solutions that attempt to connect disparate tools to stitch together a business transaction, the Dynatrace software intelligence platform provides end-to-end transaction visibility by automatically discovering and mapping each transaction with our AI-powered solution. This real-time visibility, as well as proven code-level analysis from cloud to the mainframe, gives enterprises a huge competitive advantage—they can eliminate inefficiencies and consequently, innovate at a faster rate.
With the release of Dynatrace 1.194, we’ve added CPU related infrastructure metrics for LPARs (host metrics) and regions (process metrics) and expanded our multidimensional analysis to IBM Z, including CICS, IMS, and the CICS transaction gateway.
Easily achieve a cost-effective IBM Z configuration by monitoring relevant infrastructure metrics
IBM Z are equipped with a variety of configuration options including different processor types for special purposes. The most important processor types nowadays are the general processor and the system z integrated information processor (zIIP). While a general processor can handle any workload, a zIIP can process only certain workloads like DB2, Java, or XML.
Identifying such workloads currently running on general processors and migrating them to less expensive zIIPs is key for our mainframe customers to realize savings, simply because then they aren’t subject to license costs and maintenance fees. Dynatrace provides you with the required infrastructure metrics for uncovering these cost reduction areas out of the box.
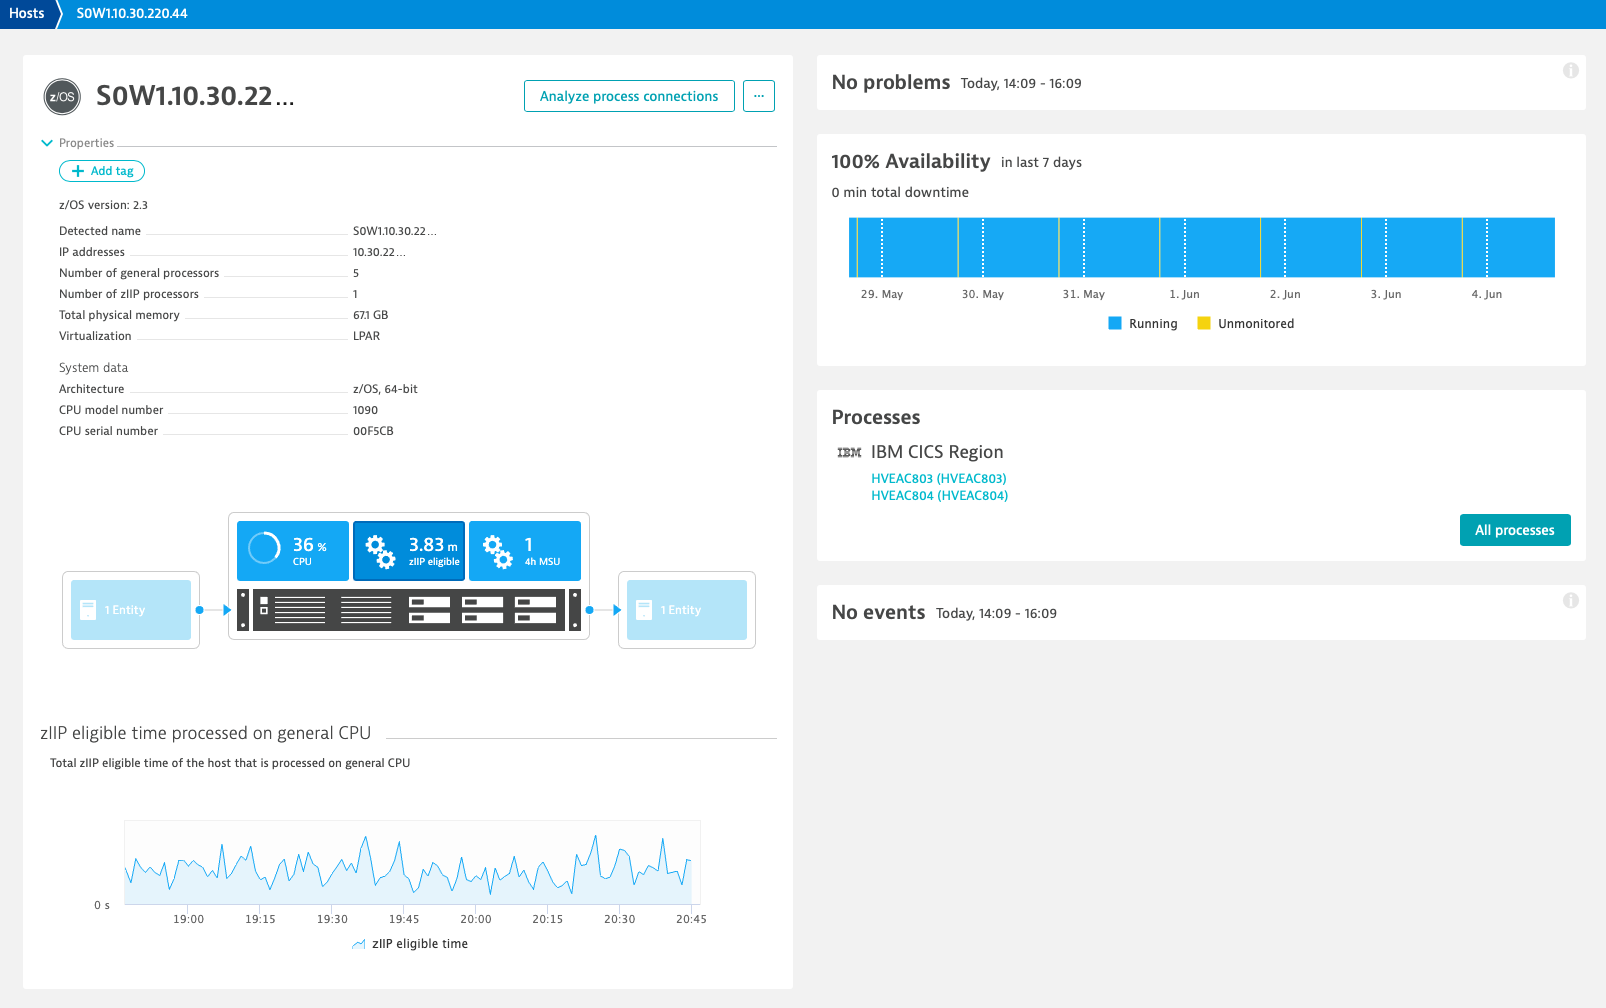
On the host level, Dynatrace provides you the following metrics:
- General CPU usage
This metric allows you to understand if the general CPUs are running at full capacity or are capped. Thereby, CPU capping means that the CPUs could have processed more workload, but were limited to a certain capacity to control license costs.
- zIIP eligible time processed on general CPU
If zIIP eligible time is available, it indicates that workload could be offloaded to less expensive zIIPs, but currently they don’t have enough resources. In such a case, you can change your system configuration and add more zIIPs to reduce costs.
- Rolling 4-hour MSU (million service units) average in relation to total MSU
This metric helps you to understand your current workload. The peak 4-hour rolling MSU average determines the chargeable MSU. Therefore, you should try to balance and distribute the processing time as much as possible.
In addition to that, Dynatrace provides you with system data like CPU model number, CPU serial number, number of general processors, number of zIIPs, and total physical memory. The processor numbers provide you an overview of the current CPU configuration, while the CPU model and serial number help you to identify the correct “replacement part” when something got broken.
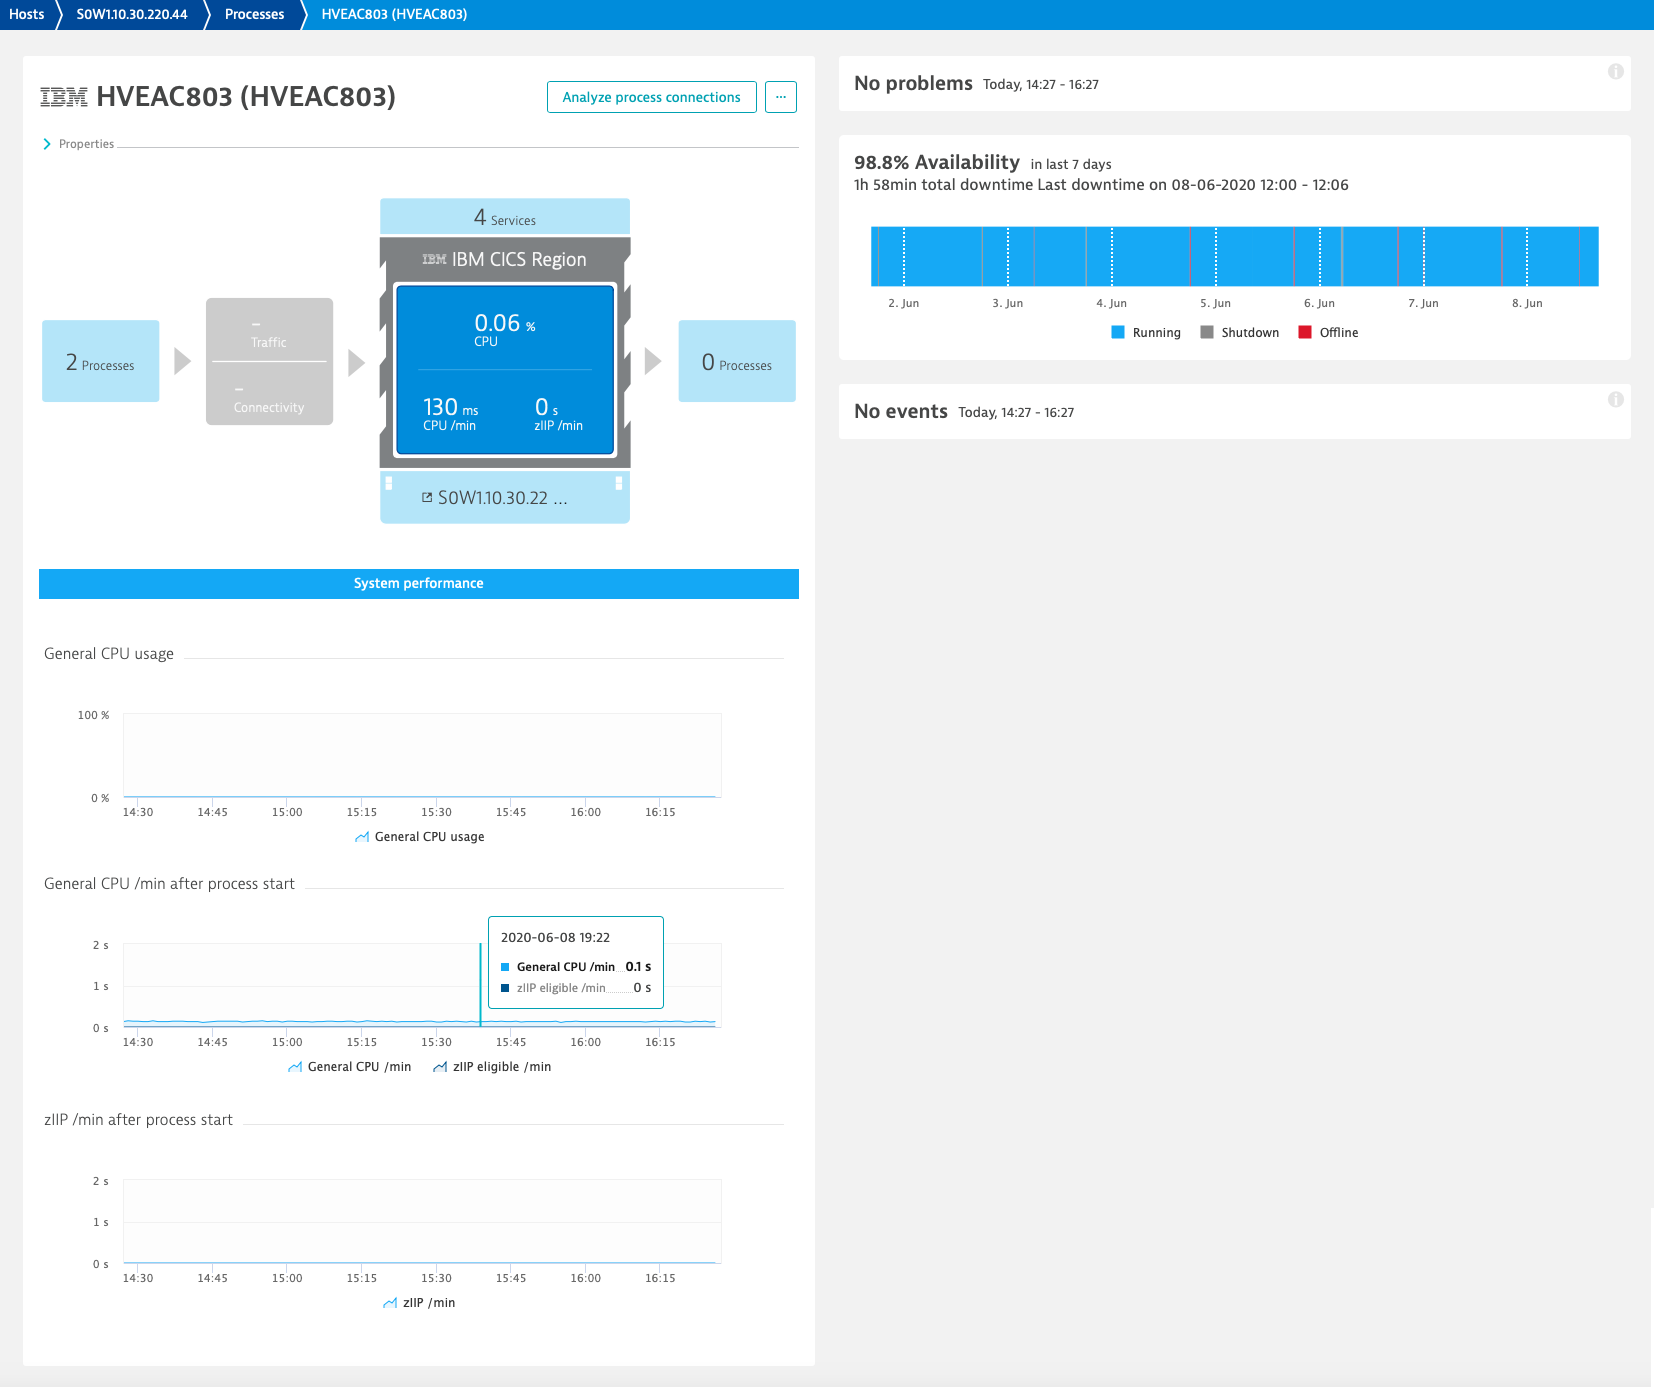
On the process level, Dynatrace provides you with the following metrics:
- General CPU usage
- General CPU time per minute consumed after process start
It also shows the zIIP eligible time that could be offloaded from a general processor to a less expensive zIIP.
- zIIP time per minute consumed after process start
This metric indicates how much workload already runs on the zIIP.
Identify CPU time anomalies in business transactions by charting them in context across multiple dimensions
A further Dynatrace capability for revealing savings is the multidimensional analysis of CPU time related anomalies. In the example below, let’s say you want to identify CPU time anomalies in your IBM Z based transactions in the context of executive programs and request counts. In the chart, you can see that transactions executed on the same program have a discrepancy in their request count, which could indicate that a distributed service is calling a specific transaction too often. You could use this insight a starting point for refactoring the code of the distributed service. In that way, you could try to cache requests so that not every request hits the mainframe.
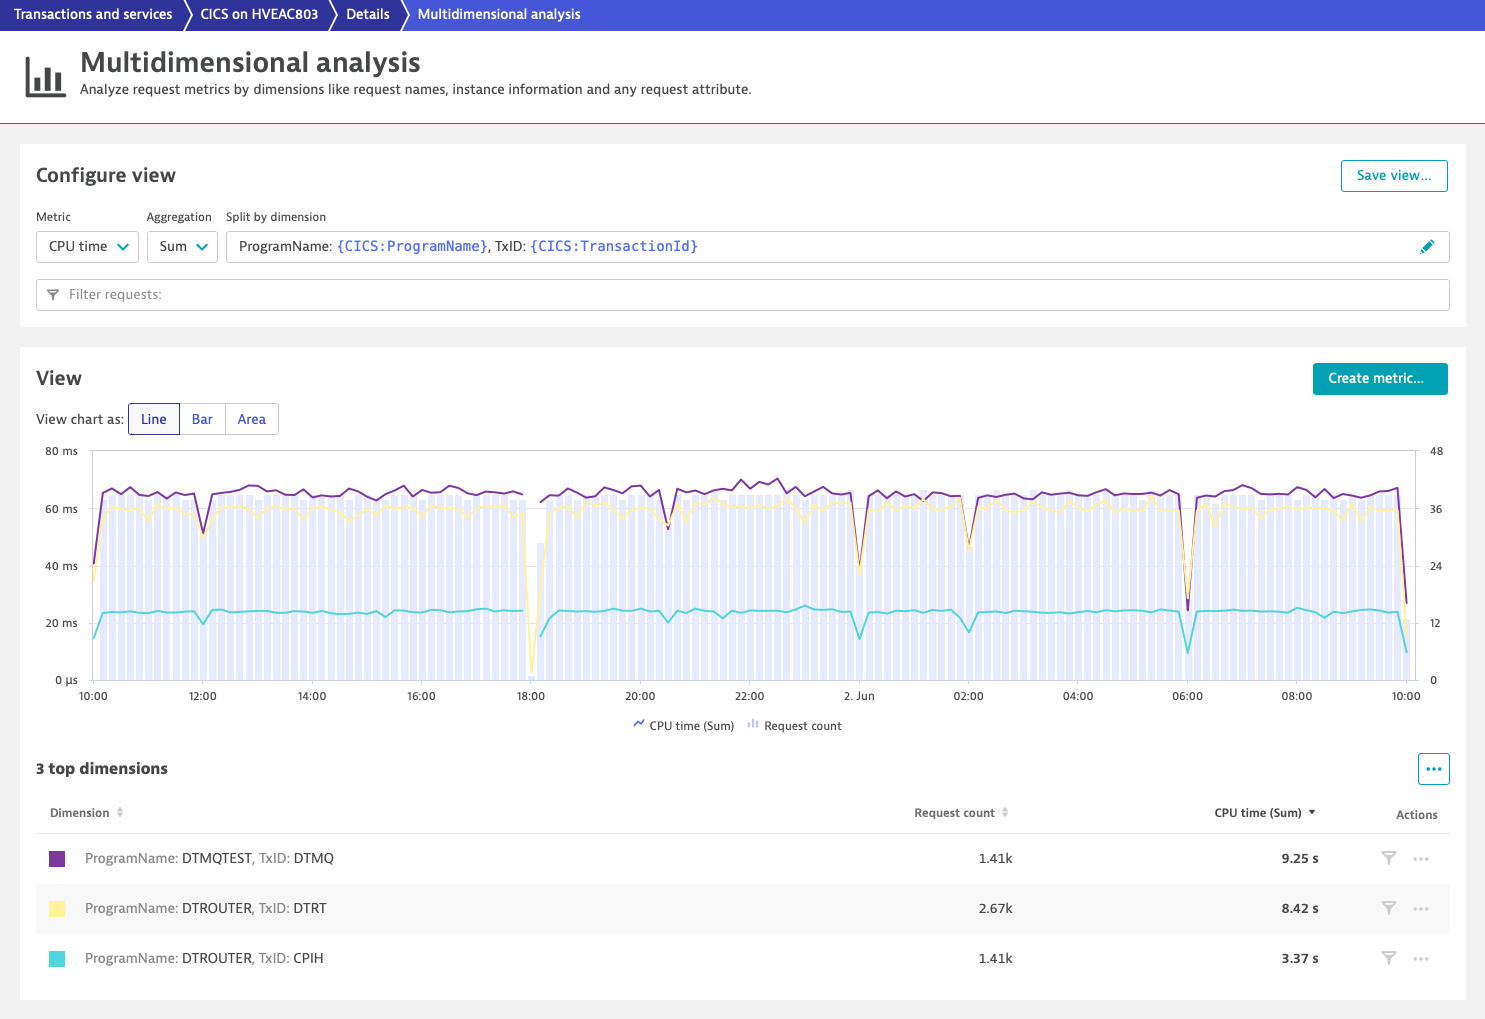
Once you have completed the multidimensional analysis, you’ll of course want to monitor key metrics on a dashboard, detect trends, and get alerts when anomalies are discovered. Dynatrace can automatically detect trends in calculated metrics and use Davis® AI for root-cause analysis of anomalies. Via the Dynatrace API, you can further integrate calculated metrics into your business processes to promptly react to alerts. Creating a calculated metric is simple, just click on the Create metric button in multidimensional analysis view.
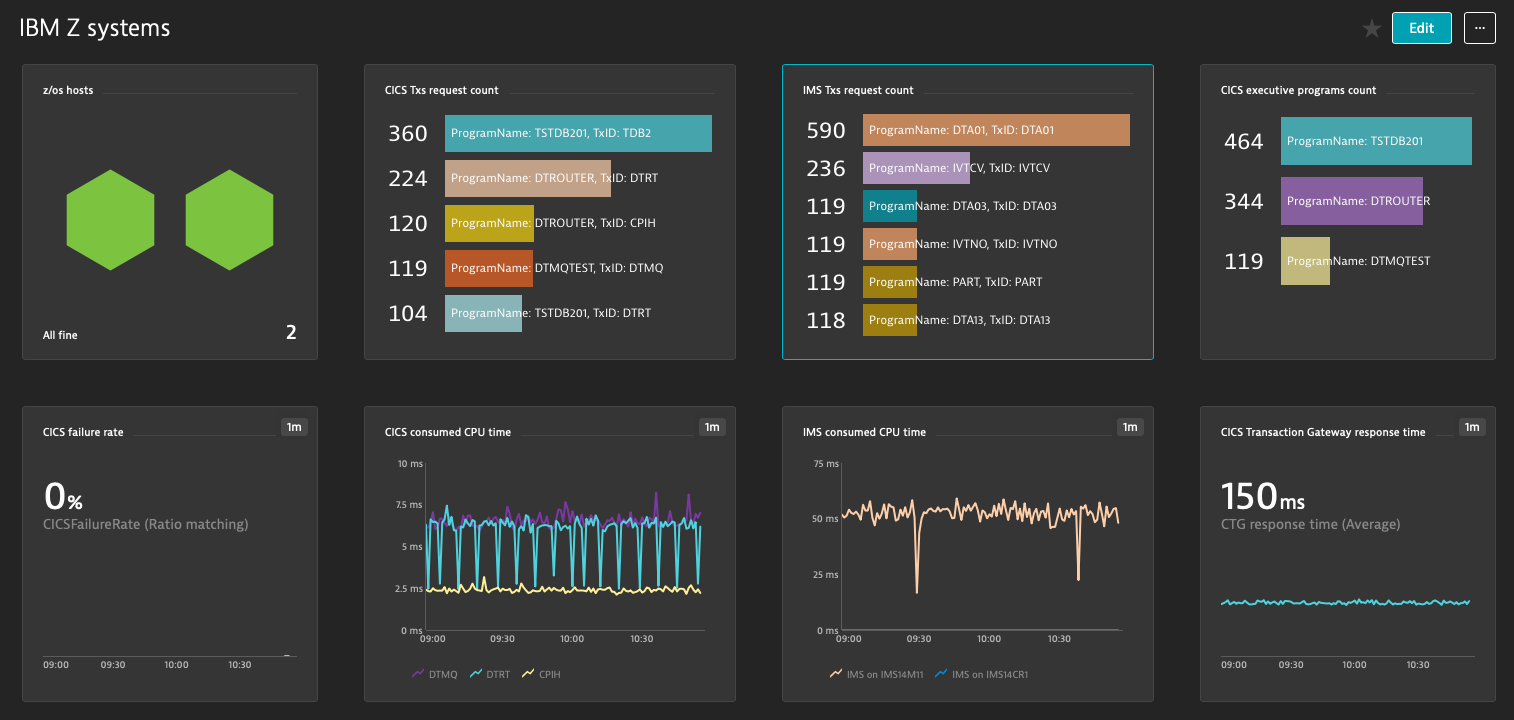
The dashboard example below illustrates how powerful calculated metrics are, and how they can be used to create a holistic view over IBM Z based transactions.
Prerequisites
Infrastructure metrics are provided out-of-the-box when the the following versions are installed:
- OneAgent on z/OS with patch DTP036A (it enables the metrics on zDC).
- ActiveGate with zRemote version 1.193.
- Dynatrace version 1.194.
Multidimensional analysis has been available for IBM Z since Dynatrace version 1.193.
Even easier installation and maintenance of OneAgent on z/OS
We have also simplified the installation and maintenance of OneAgent on z/OS. Starting with OneAgent version 1.195, you can install OneAgent on z/OS using a PAX file instead of the SMP/E installation.
For each OneAgent release, we will generate a new PAX file, which is a complete overlay of all updates, to simplify the process of installing updates. You can find the release notes for OneAgent on z/OS in the OneAgent release notes.
Feedback
If you have questions or comments, please reach out to us via Dynatrace Community, directly within the product via Dynatrace ONE chat, or via your Dynatrace Account Manager.


Looking for answers?
Start a new discussion or ask for help in our Q&A forum.
Go to forum