
What is distributed tracing, and why is it important?
Last updated: April 23, 2026
Cloud computing, microservices, open source tools, and container-based delivery have made applications more distributed across an increasingly complex landscape. As a result, distributed tracing has become crucial to responding quickly to issues.
But what is distributed tracing, exactly? We’ll answer that question and examine how teams can gain adequate observability into a highly distributed, cloud-native architecture to effectively trace transactions and analyze their significance in real time.
What is distributed tracing?
Distributed tracing is a method of observing requests as they propagate through distributed cloud environments. It follows an interaction and tags it with a unique identifier. This identifier stays with the transaction as it interacts with microservices, containers, and infrastructure. In turn, this identifier offers real-time visibility into user experience, from the top of the stack to the application layer and the infrastructure beneath.
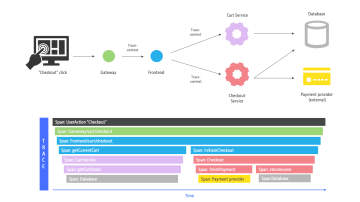
As monolithic applications give way to more nimble and portable services, the tools once used to monitor their performance can no longer serve the complex cloud-native architectures that now host them. This complexity makes distributed tracing critical to attaining observability in these modern environments
The evolution of distributed tracing
Previously, when businesses primarily built monolithic applications, it was relatively straightforward to see what transpired within them. With the rise of service-oriented architectures, however, it became harder to understand how specific transactions travelled through the various tiers of an application. This, in turn, made it difficult to pinpoint the root causes of latency and delays in execution time.
This complexity also created internal collaboration challenges. If an organization was unable to identify the affected microservice, then it could not determine which team was responsible for addressing the issue. With so little visibility into activity in the environment, it was easy for troubleshooting sessions to devolve into war rooms where teams blamed one another.
While the need for better observability into application environments is obvious, creating a solution from scratch using internal development resources can be too costly and time-consuming. Additionally, it could slow the pace of innovation. Distributed tracing meets this need, enabling companies to better understand the performance issues affecting their microservices environments.
Breaking down the different types of tracing
Organizations may use different types of distributed tracing, including the following:
- Code tracing. With this method, a developer manually interprets the results of each line of code within an application. Code tracing tracks the variable values as they change during execution to determine the output of the code. This process works particularly well with smaller blocks of code, enabling teams to analyze them without having to run the entire application. Code tracing is considered a foundational skill that leads to better code writing.
- Data tracing. Developers use data tracing to perform data accuracy and quality checks on critical data elements (CDEs) that are essential from a business perspective. They also use this method to trace those prioritized CDEs back to their source systems for proactive monitoring.
- Program trace. This command delivers an index of the instructions that have been executed, as well as the data that has been referenced while an application has been running. Debuggers and other code analysis tools often use program trace to improve code as part of the software development process.
The benefits of distributed tracing
Distributed tracing offers teams and organizations multiple potential benefits, including better application performance, improved compliance with service-level agreements (SLAs), and faster time to market. Some of the most valuable benefits of distributed tracing include the following:
- Reduced mean time to detect (MTTD) and mean time to repair (MTTR). Distributed tracing enables teams to get to the bottom of application performance issues faster, often before users notice anything wrong. Upon discovering an issue, they can rapidly identify the root cause and address it. Observability also provides teams with early warnings when microservices are in poor health and can highlight performance bottlenecks anywhere in the software stack, as well as code that should be optimized.
- Improved compliance with SLAs. The organization can also maintain a high-quality user experience and improve its compliance with SLAs.
- Protected bottom-line growth. This minimizes potential effects to the bottom line and helps the organization maintain a steady flow of revenue.
- Faster time to market. As a result, organizations can get to market with new products and services much more quickly, gaining a competitive advantage.
- Improved internal collaboration. Because distributed tracing pinpoints the exact areas where issues lie, it also helps to boost collaboration and communication across teams. This improves the working relationships that are crucial for both timely troubleshooting and delivering innovations that grow the business.
The challenges of distributed tracing
Although distributed tracing offers organizations many advantages, it can also present some challenges and limitations. They include the following:
- Manual instrumentation. Although distributed tracing is meant to save teams time, some tools require developers to manually instrument or adjust their code before allowing them to configure distributed tracing requests. This requirement can be time-consuming and can accidentally result in code errors. Some teams may apply standardized processes to this task, potentially causing them to overlook some traces.
- Limited to backend coverage. Some tools that don’t take an end-to-end approach to distributed tracing only generate a trace ID for a request when it reaches the first back-end service, obscuring the corresponding user session on the frontend. This makes it unnecessarily difficult to identify the root cause of a problematic request and determine whether the backend or frontend team should address it.
- Head-based sampling. If a tracing tool simply samples traces randomly at the start of each request, some traces may fall through the cracks. As a result, certain traces may be missing or incomplete. This means organizations can’t always sample high-priority traces, such as high-value transactions or requests from specific customers. An advanced observability solution can encompass all an organization’s traces, orienting itself toward tail-based decisions instead of taking a head-based sampling approach. This way, the organization can capture complete traces that are tagged with specific priority characteristics.
The inner workings of distributed tracing and why we need it
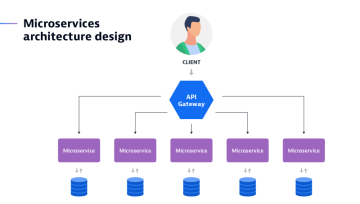
Distributed tracing is essential to monitoring, debugging, and optimizing distributed software architecture, such as microservices — especially in dynamic microservices architectures. It tracks a single request by collecting and analyzing data on every interaction with every service the request touches.
Each activity — called a segment or span — that is triggered by a request is recorded as it moves both through and across services. Information collected includes a name, start and end timestamps, and other metadata. When one activity — a “parent” span — is completed, the next activity passes to its “child” span. The distributed trace places these spans in their correct order.
Businesses need distributed tracing to help streamline the complexity of their modern application environments. With distributed applications, there are more potential points of failure across the entire application stack. This means it can take far more time to identify root causes when issues arise. The resulting complexity directly affects a company’s ability to maintain its SLAs and provide a stellar user experience.
Distributed tracing helps teams understand more quickly how each microservice is performing. This understanding helps them resolve issues more rapidly, increase customer satisfaction, promote steady revenue, and preserve time for teams to innovate. This way, businesses can take full advantage of the benefits modern application environments offer while minimizing the challenges that their inherent complexity can create.
When do you use distributed tracing?
When multiple microservices are linked to a request, it becomes more challenging to understand the relationships between them and determine how they work together to fulfill that request. In microservices or serverless architectures especially, distributed tracing is essential for quickly getting answers to specific questions.
DevOps, operations teams, and site reliability engineers (SREs) all find distributed tracing useful for the following situations:
- understanding the current health of microservices within a distributed system;
- rapidly identifying the root cause of errors in the same setting; and
- spotting performance bottlenecks that either currently affect or potentially affect the user experience.
Distributed tracing can also be a strategic asset for proactively optimizing problematic or inefficient code within certain microservices
How is distributed tracing different from logging?
Log files contain valuable details that are a crucial part of distributed tracing, but logging and distributed tracing are not the same. Writing log files is as much an art as it is a science. Logs must contain enough information to trigger the appropriate but action but be lightweight enough to not bog down system resources. To understand the difference, it’s helpful to first be aware of two types of logging:
- centralized logging
- distributed logging
What is centralized logging?
Centralized logging is a method of recording activity wherein a team transports and stores the logs generated by a service or component in a single location. This enables teams to centrally track error reporting and related data. In a microservices environment, teams do this by aggregating the logs from multiple microservices into a central location so they can reference and analyze them more easily. The focus of this type of logging is specifically to identify errors that occur within the application and to locate the microservice from which they originated. This becomes more challenging in distributed environments in which many thousands of microservices generate their logging data.
Although more convenient for developers, centralized logging requires that systems transport logs from their origin to a single location. This practice can consume a considerable amount of network resources. As a result, this may sometimes lead to network performance issues that affect other applications and services.
What is distributed logging?
In contrast, distributed logging is a method of recording activity in logs that are located throughout the computing environment, often across multiple clouds. Organizations may choose this approach instead of centralized logging to reduce the burden of constantly transporting and storing logs in a single location.
Some log storage solutions are also finicky, requiring closer proximity to the device that generates the logs. Large-scale applications, such as those composed of multiple microservices, tend to continually generate large quantities of logs. In these cases, teams may prefer to use a distributed logging approach.
Teams can use logging and distributed tracing in parallel. Organizations often begin with logging and may add distributed tracing as their application environment becomes more complex, for example, when they use microservices.
The impact of tracing through distributed systems
Distributed tracing can easily follow a request through hundreds of separate system components, and it does more than just record the end-to-end journey of a request. It can also provide real-time insight into system health. This enables IT, DevSecOps, and SRE teams to:
- Report on the health of applications and microservices to identify degraded states before a failure occurs.
- Detect unforeseen behavior that results from automated scaling, making it easier to prevent and recover from failures.
- Analyze how end users experience the system in terms of average response times, error rates, and other digital experience metrics.
- Monitor key performance metrics with interactive visual dashboards.
- Debug systems, isolate bottlenecks, and resolve code-level performance issues.
- Identify and troubleshoot the root cause of unseen problems.
Where traditional monitoring methods struggle
To achieve its goal of enabling data-driven decision-making, distributed tracing relies on observability data from across all environments. Traditional software monitoring platforms collect observability data in three main formats, which are often referred to as the three pillars of observability:
- Logs. Timestamped records of an event or events.
- Metrics. Numeric representation of data measured over a set period.
- Traces. A record of events that occur along the path of a single request.
In the past, platforms made good use of this data, such as following a request through a single application domain. Before the advent of containers, Kubernetes, or microservices, gaining visibility into monolithic systems was simple. But in today’s vastly more complex and distributed environments, such data offers no overarching view of system health.
Log aggregation, the practice of combining logs from many different services, is a good example. It may provide a snapshot of the activity within a collection of individual services. Still, the logs lack contextual metadata to provide the full picture of a request as it travels downstream through possibly millions of application dependencies. On its own, this method simply isn’t sufficient for troubleshooting in distributed systems. This is where observability and, specifically, distributed tracing come in.
As opposed to traditional monitoring, observability is the standard for understanding and gaining visibility into apps and services. It helps to explore the properties and patterns within an environment that are not defined in advance. Distributed tracing is one of several capabilities vital to achieving the observability that modern enterprises demand.
Cloud intelligence for the distributed world
Distributed tracing gives organizations crucial insight into application performance by uncovering the complete journey of a request as it travels throughout the application stack. Now that organizations are increasingly relying on modern cloud native applications to transform faster, they must be able to gain comprehensive observability into the application environment. Distributed tracing allows teams to quickly identify the root causes of application performance issues — often before users notice them — and support a high-quality user experience.
Answering distributed tracing FAQs
How does distributed tracing benefit modern microservices architectures?
Distributed tracing is crucial for navigating the complexity of modern cloud-native applications built on microservices, providing end-to-end visibility into how requests traverse these intricate systems. It enables teams to quickly identify performance bottlenecks, errors, and dependencies across numerous independent services. This capability significantly enhances troubleshooting, reduces downtime, and improves overall operational efficiency in highly distributed environments.
What are the fundamental components of a distributed trace?
A distributed trace represents the entire execution path of a single request as it moves through various services and systems, identified by a unique trace ID. This trace is composed of individual units of work known as spans, each representing a specific operation within a service, such as an API call or database query. Spans contain important metadata, including start and end times, and are linked together in a hierarchical parent-child relationship to illustrate the flow of the request
How does distributed tracing differ from traditional logging?
While both distributed tracing and logging are vital for monitoring and debugging, they serve distinct purposes. Logging focuses on recording discrete events and messages from individual components, providing granular details but often lacking context across services. Distributed tracing, conversely, tracks the complete journey of a request across multiple services, providing a holistic view of interactions and pinpointing where delays or failures occur within the entire transaction flow.
What common challenges can arise when implementing distributed tracing?
Implementing distributed tracing can present several challenges, including the need for careful instrumentation, which may require manual code adjustments for different languages or frameworks. Some tracing solutions might offer limited visibility, only covering backend services and obscuring issues originating from the frontend. Additionally, managing and analyzing the vast volume of trace data generated in high-throughput systems, and implementing effective sampling strategies, can be complex.
Keep reading
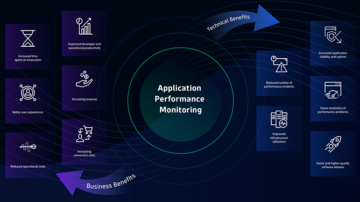 Blog postRead our blog post, to find out what Application Performance Management means for Dynatrace.
 Blog postWhat is OpenTelemetry? An open-source standard for logs, metrics, and traces
 App SpotlightDistributed Tracing with Dynatrace
Discover effortlessly distributed tracing with Dynatrace: intuitive filtering, visualization, and analysis for faster issue resolution.