
- Update: August 24 – 2016 Post-Games Analysis
- Update: August 19 – Social Media Showdown
- Update: August 18 – A View From Down Under
- Update: August 16 – View of Top Global Brands
- Update: August 15 – Carrier/ISP Performance Update
- Update: August 11 – All Eyes on South America and Italy
- Update: August 10 – Consumer Favorites From Around the Globe
- Update: August 9 – Taking a Deep Dive Into Sports Sites
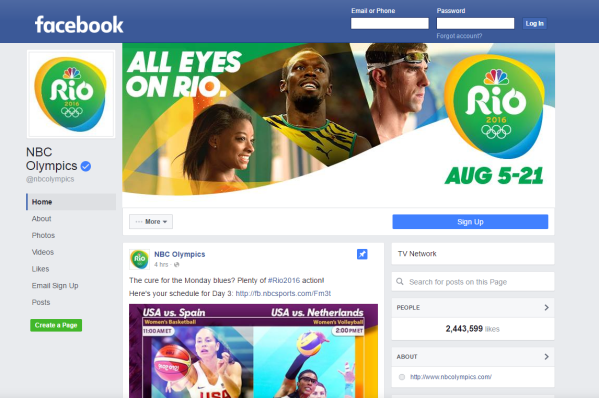
- Update: August 8 – All Eyes on Facebook’s Winning Digital Performance
- Update: August 6 – NBC Takes the Gold for Digital Performance
- Update: August 3 – Starting point to being Digitally Prepared
Update: 12:30pm August 24th, 2016 by Andre’ Chagnon & David Jones
The Rio Olympics wrapped up on Sunday and the team here at Dynatrace has been poring over the data we’ve collected during the games. During the games we collected over 500,000 page views worth of data and our network made over 50,000,000 network requests.
A couple of months ago we asked if Brazil was digitally prepared for the Olympics, as there had been some concerns leading into the games about the state of the country’s networks. Now that the games have concluded we can determine whether or not Brazil was in fact digitally prepared.
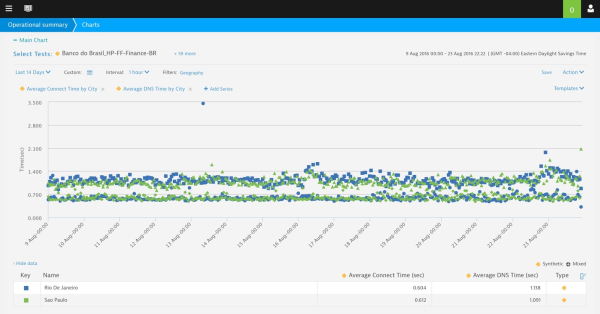
Below is a view over the past two weeks of DNS and Network Latency times based on observations from Rio and Sao Paulo. Over 50 different sites were included in this analysis. While there were some variations, there were no widespread performance issues or outages.
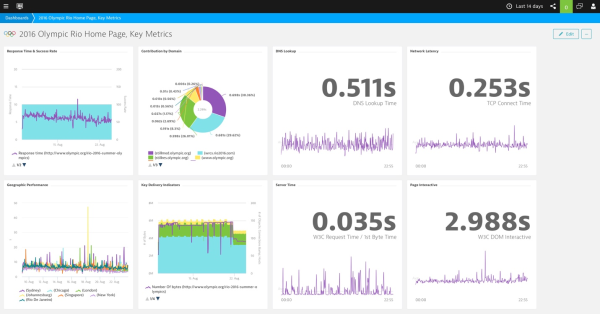
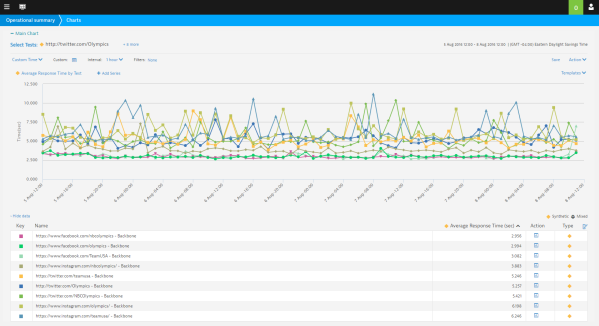
When we look at key sites like the official Rio 2016 homepage, it also performed very well for the duration of the games. Below is an example of a Key Metrics dashboard which allowed our team to monitor response times, success rates, contributing domains, geographic performance, page complexity, DNS, network latency, server responsiveness and page render or interactive times.
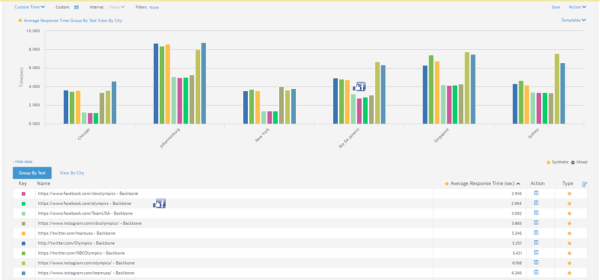
In addition to the dashboards (above) our team also tracked the different groupings/categories for the hundreds of tests that we ran. Below is an example of a dashboard used to aggregate tests into categories. Based on our observations, the social media category gets a gold medal for performance during the Olympics.
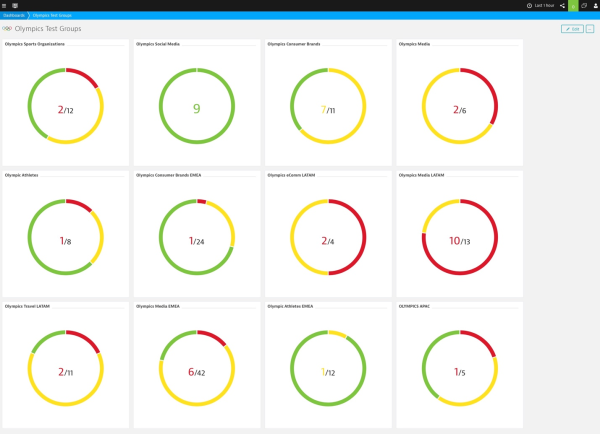
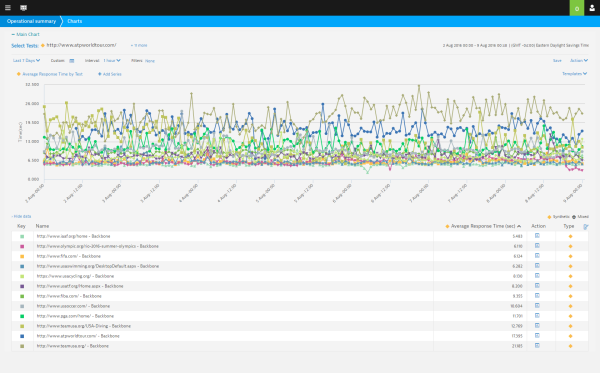
LATAM based media sites tended to have the most issues during the Olympics. When we look at the details for one of these categories (below) we can see the performance of individual tests. For example, for the Olympics Sports Organizations category IAAF.org was the top performer and TeamUSA.org was the bottom performer.
The reason we look at the performance for these sites is that performance can impact end-user outcomes. That could be anything from a user requesting a page to executing a transaction. Pages that perform slower tend to have fewer conversions – an industry term for tracking goals. Pages with slower performance tend to also have higher bounce rates (which describes when user leaves a site without doing anything).
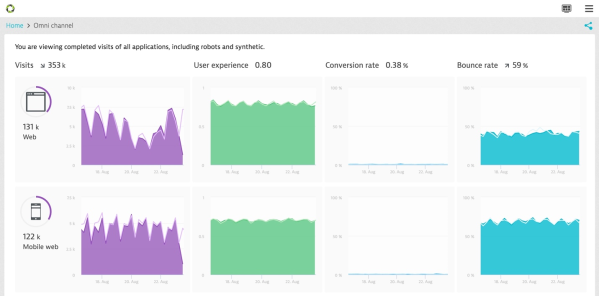
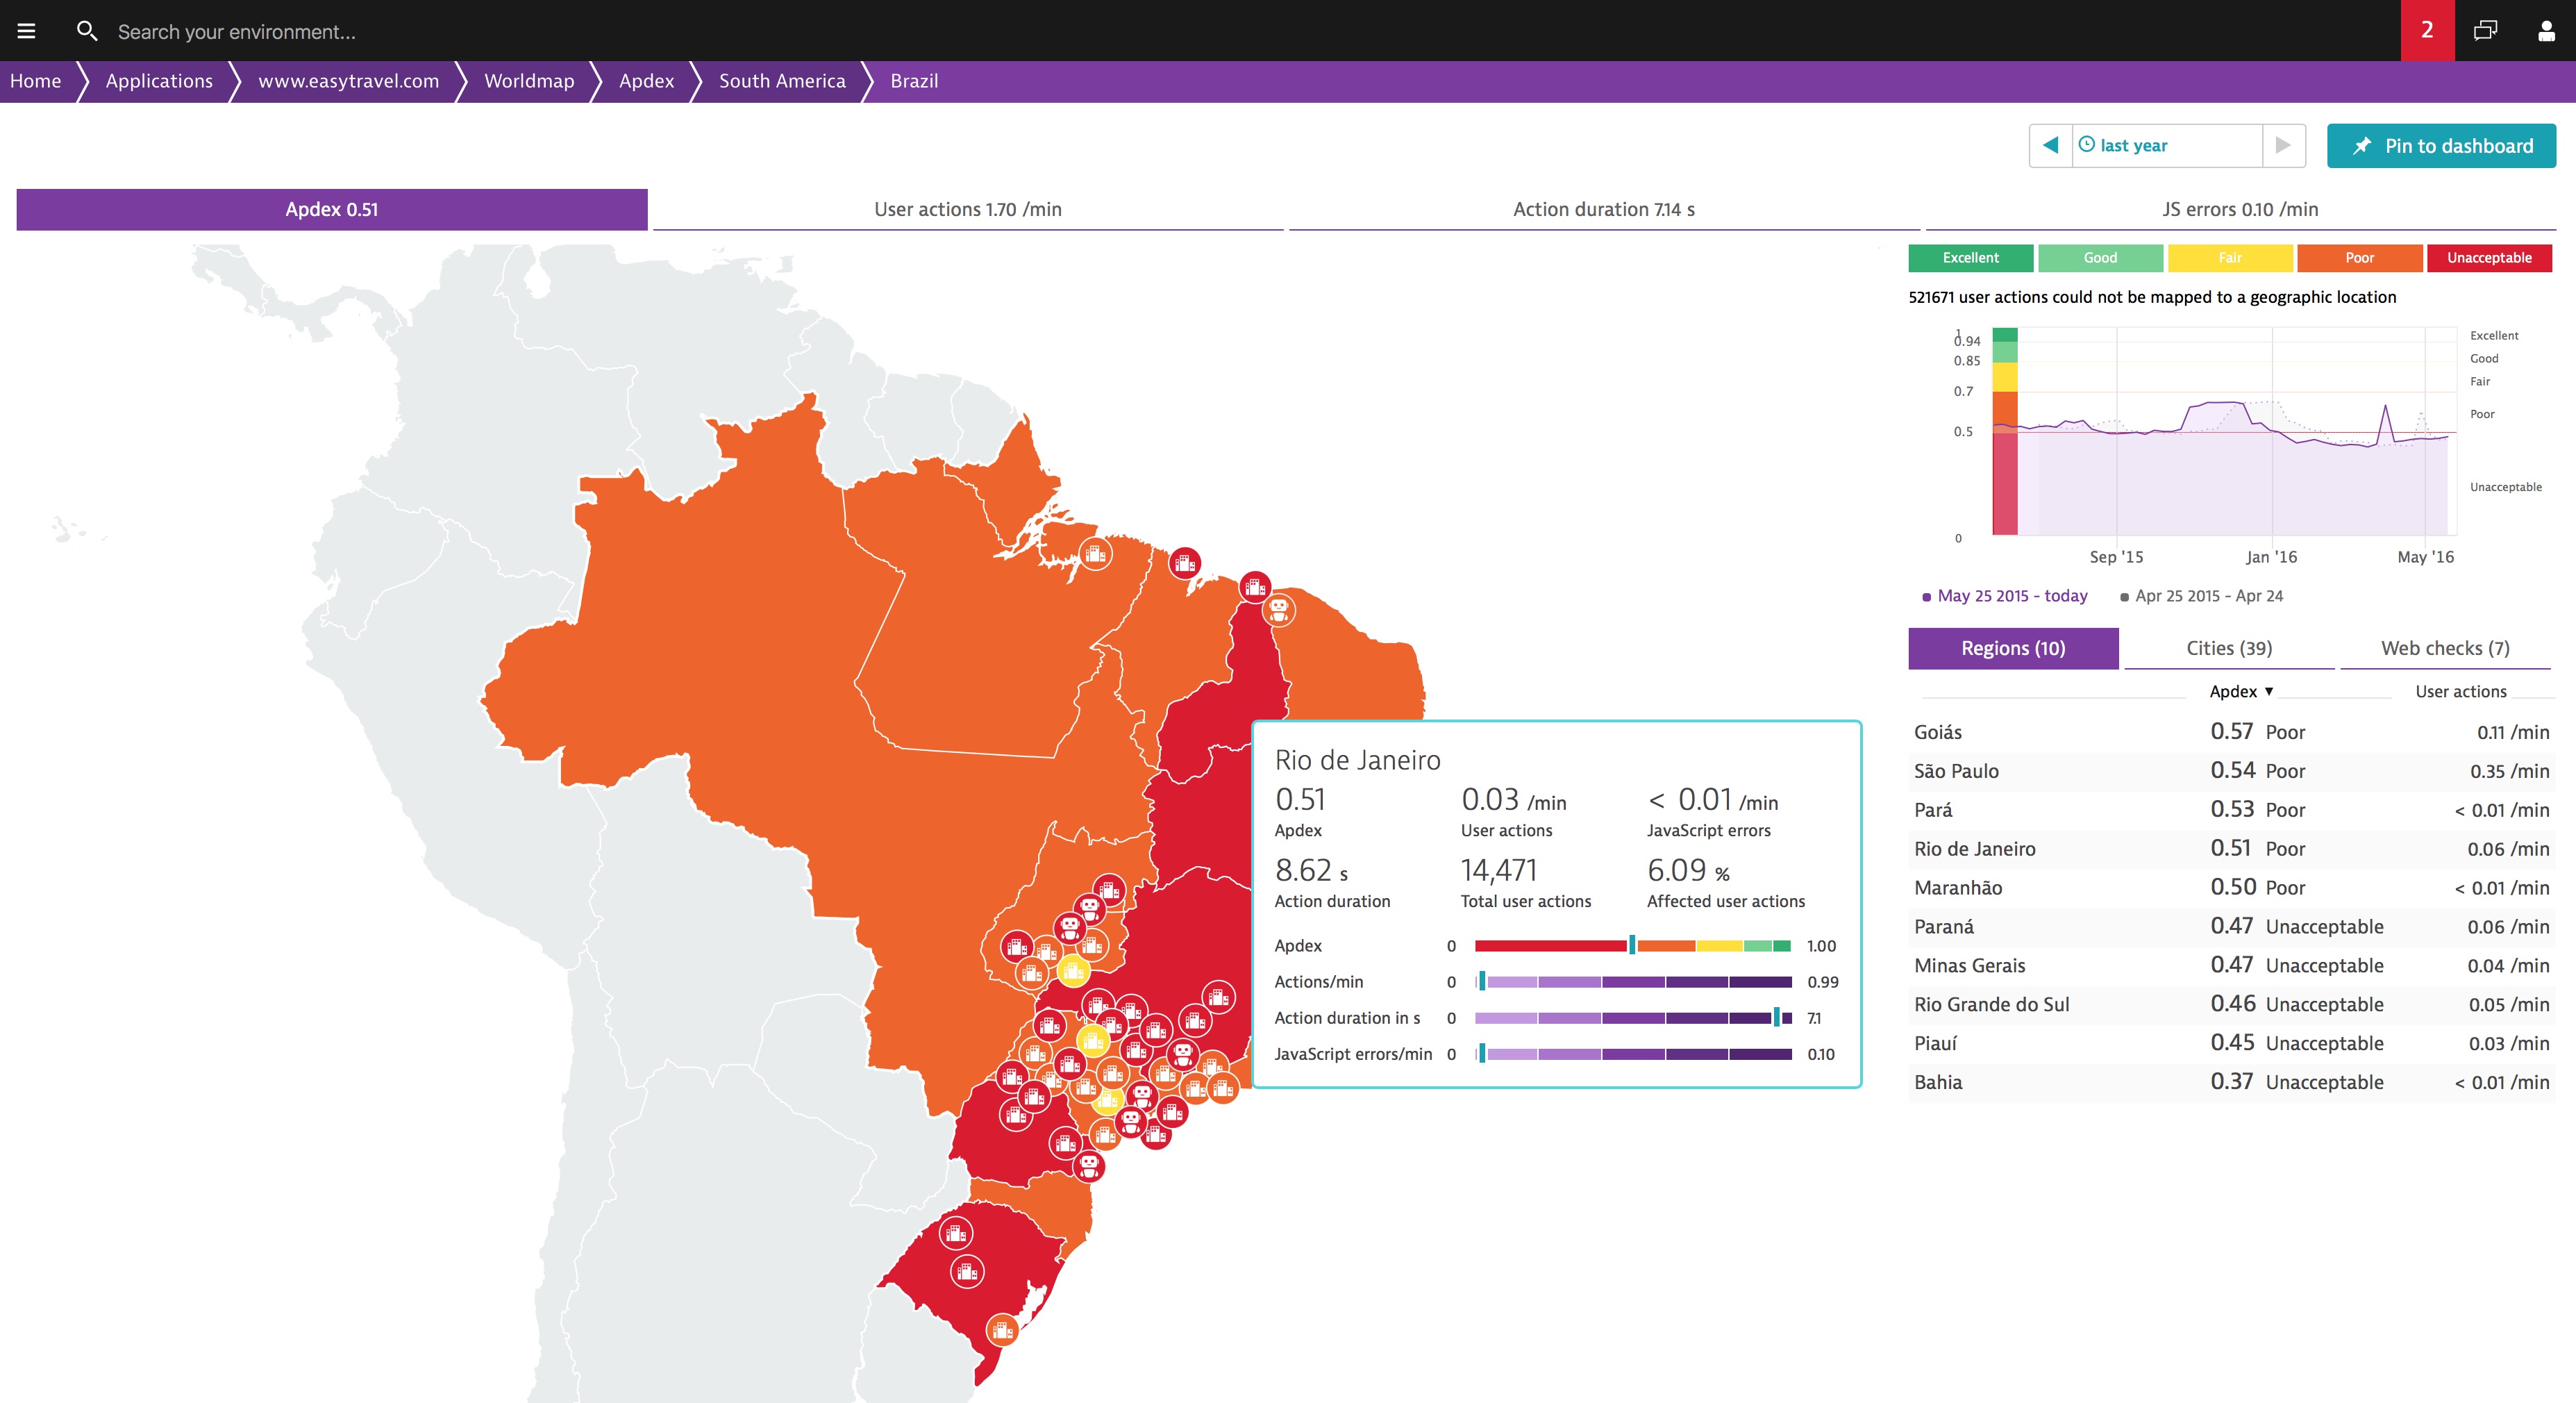
Below is a view of some real user data from Brazil for a travel/hotel vendor during the Olympics. What’s interesting is that you can see that the pages viewed on mobile web performed worse than the traditional desktop delivered pages, leading to a high bounce rate.
In comparison to a North American or European market, real users in Brazil tend to get a worse experience for this vendor. Below we see a sample set of 2,000 visits in which more than half received a tolerating or frustrated experience.
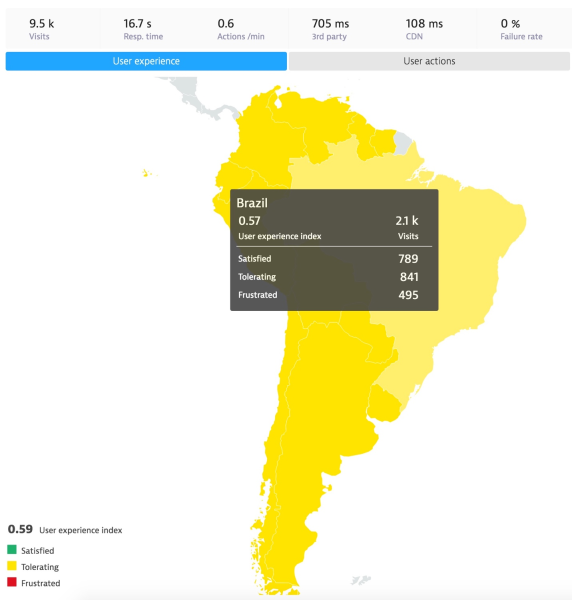
Now this data (above) is from a single vendor and does not represent the overall performance seen in Brazil during the games. For this analysis we looked at hundreds of different sites, some related to the Olympics and others based on Dynatrace Industry Benchmarks.
Below are the Brazil-based financial services companies we looked at:
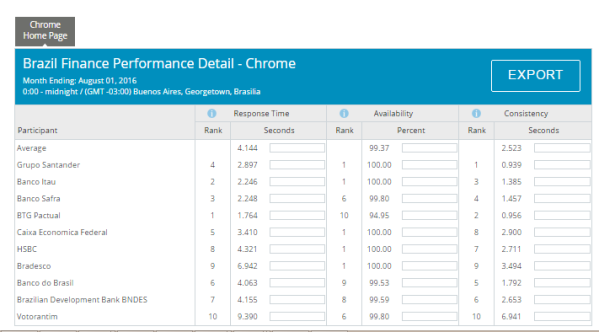
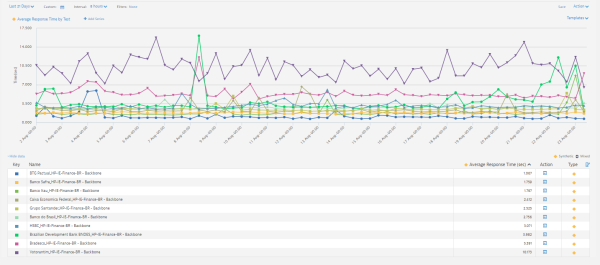
We examined these websites prior to and during the Olympics:
Here is the Brazil Retail Benchmark:
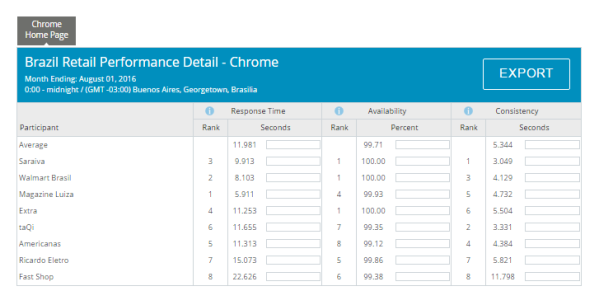
Taking a look at these retailers’ performances over the last 21 days:
Based on the local network testing from the Dynatrace benchmarks of Brazil’s top banks and retail sites, we have not seen any major outages impacting end users. Considering the millions of additional people that converged on Brazil, this must have come as welcome relief for IT managers of these companies.
Top 5 lessons learned from the RIO Olympics you can leverage for the next major event:
- Establish web performance standards and best practices and enforce them. Too many times organizations talk about performance standards but fail to look at how that applies to the entire application delivery chain.
- Make sure you have a solid go to market monitoring strategy which baselines your key sites, applications and customer journeys. Consider taking a DevOPs approach to use automation wherever possible (ie. Automating load testing while leveraging Agile development practices).
- Implement a User Experience Monitoring strategy to understand real time how your real users are experiencing the site. Are they frustrated? Why are they frustrated?
- Optimize the edge delivery of the site by minimizing domain/hosts requests to 3rd parties. Optimize by reducing the complexity of the pages being delivered by reducing the number of objects (round trip requests). Manage the size of pages be reducing the byte count, and minify Javascript and CSS Files (where possible) as well as enabling compression. Reuse Connections and optimize cache. Utilize a CDN (Content Delivery Network).
- Compare, contrast and benchmark your performance with your peers and competitors. Social Media sites set the bar for constitutes good performance during the Olympics, this is what sets performance expectations for end users.
After analyzing the data, the team at Dynatrace can now confidently say that Brazil was in fact digitally prepared for the 2016 Olympics, with social media sites providing an outstanding gold medal performance.
As we now head into the holiday season, retailers should take note of how some of these Olympics sites performed. Stay tuned for more insights on the performance of key industry events from the Dynatrace.
Update: 12:30pm August 19th, 2016 by David Jones
The Dynatrace Rio Report — Social Media Showdown
Here it is, the 100m Final of the Digital Olympics: the social media showdown. It’s the Usain Bolt, Justin Gatlin and Andre De Grasse spectacle you’ve all been waiting for.
![]()
For this analysis in the Dynatrace Rio Report we tracked various Facebook, Twitter and Instagram sites on the 2016 Olympic Games. However, before we look at the finalists let’s take a look at some of the heats leading up.
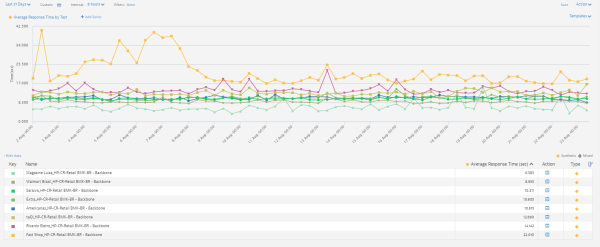
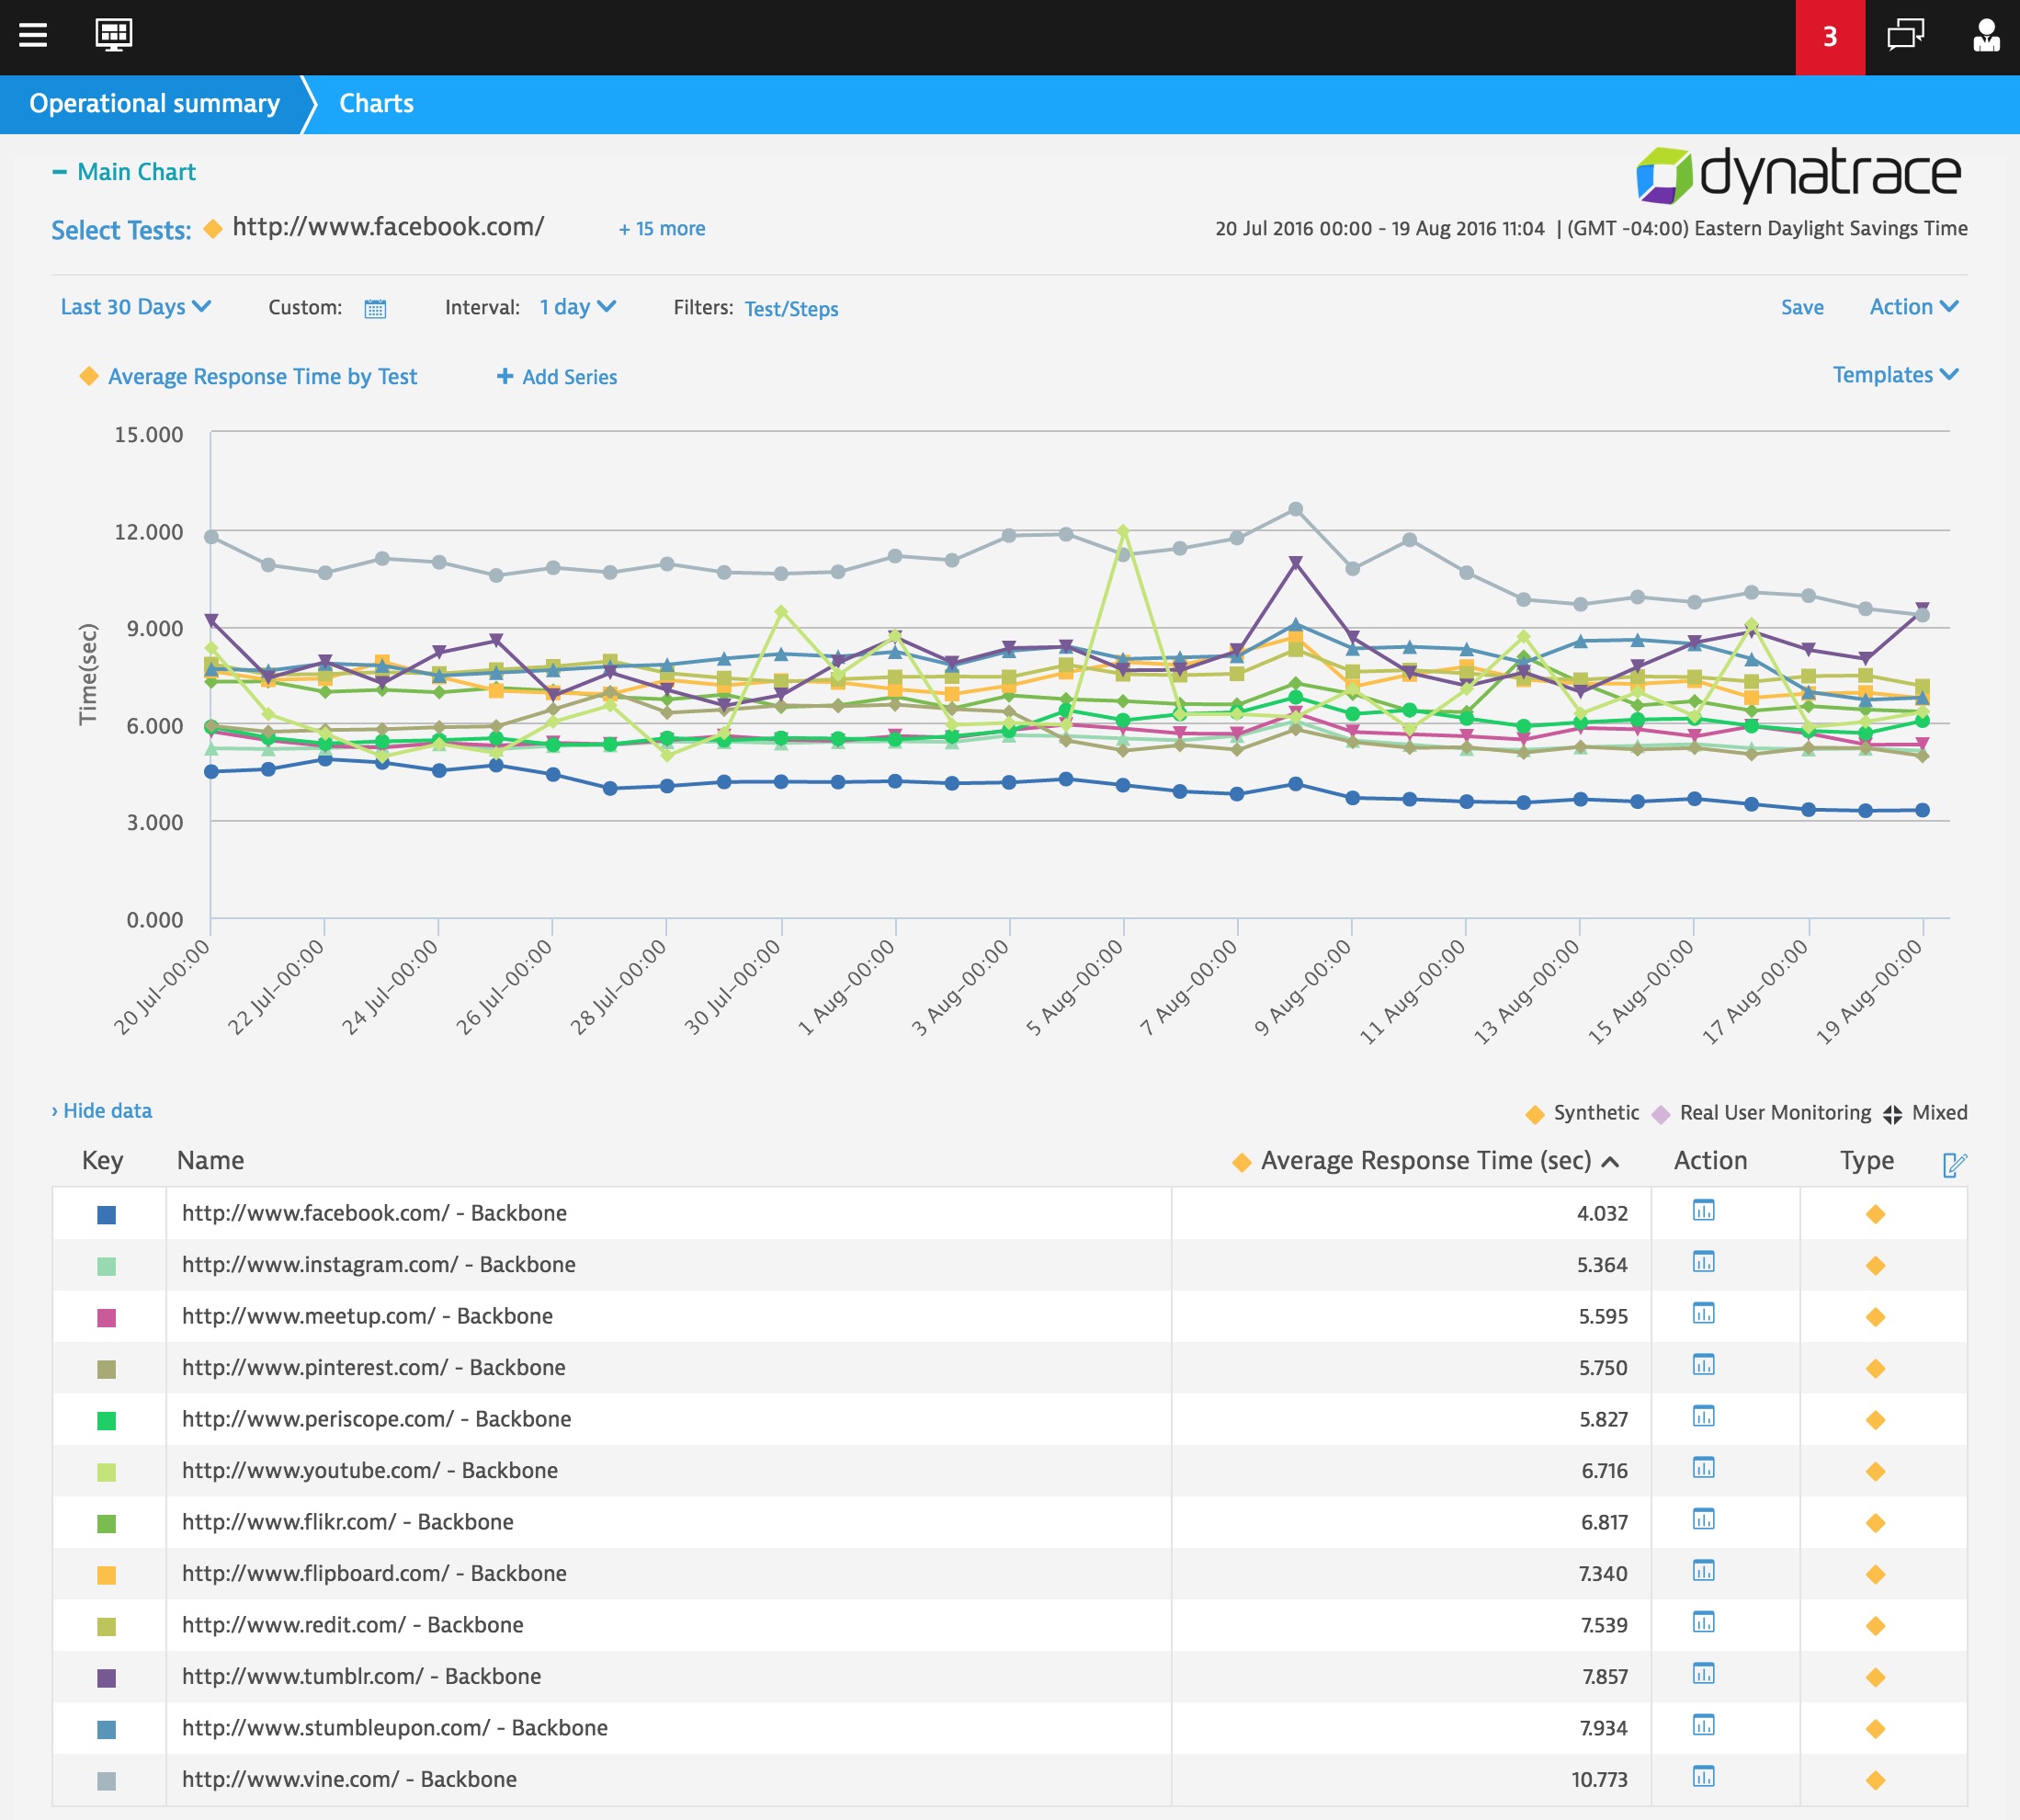
These were the results from a larger selection of social media sites from U.S. locations over the past month. There is a pretty big spread in terms of response times from the social media field.
For our final we paired the finalists down, and looked at some Olympic-specific landing pages. These would be the top pages if a user had searched for Olympics and Facebook, Twitter or Instagram.
Here are the results from the final, and Facebook is the Usain Bolt of the social media showdown!
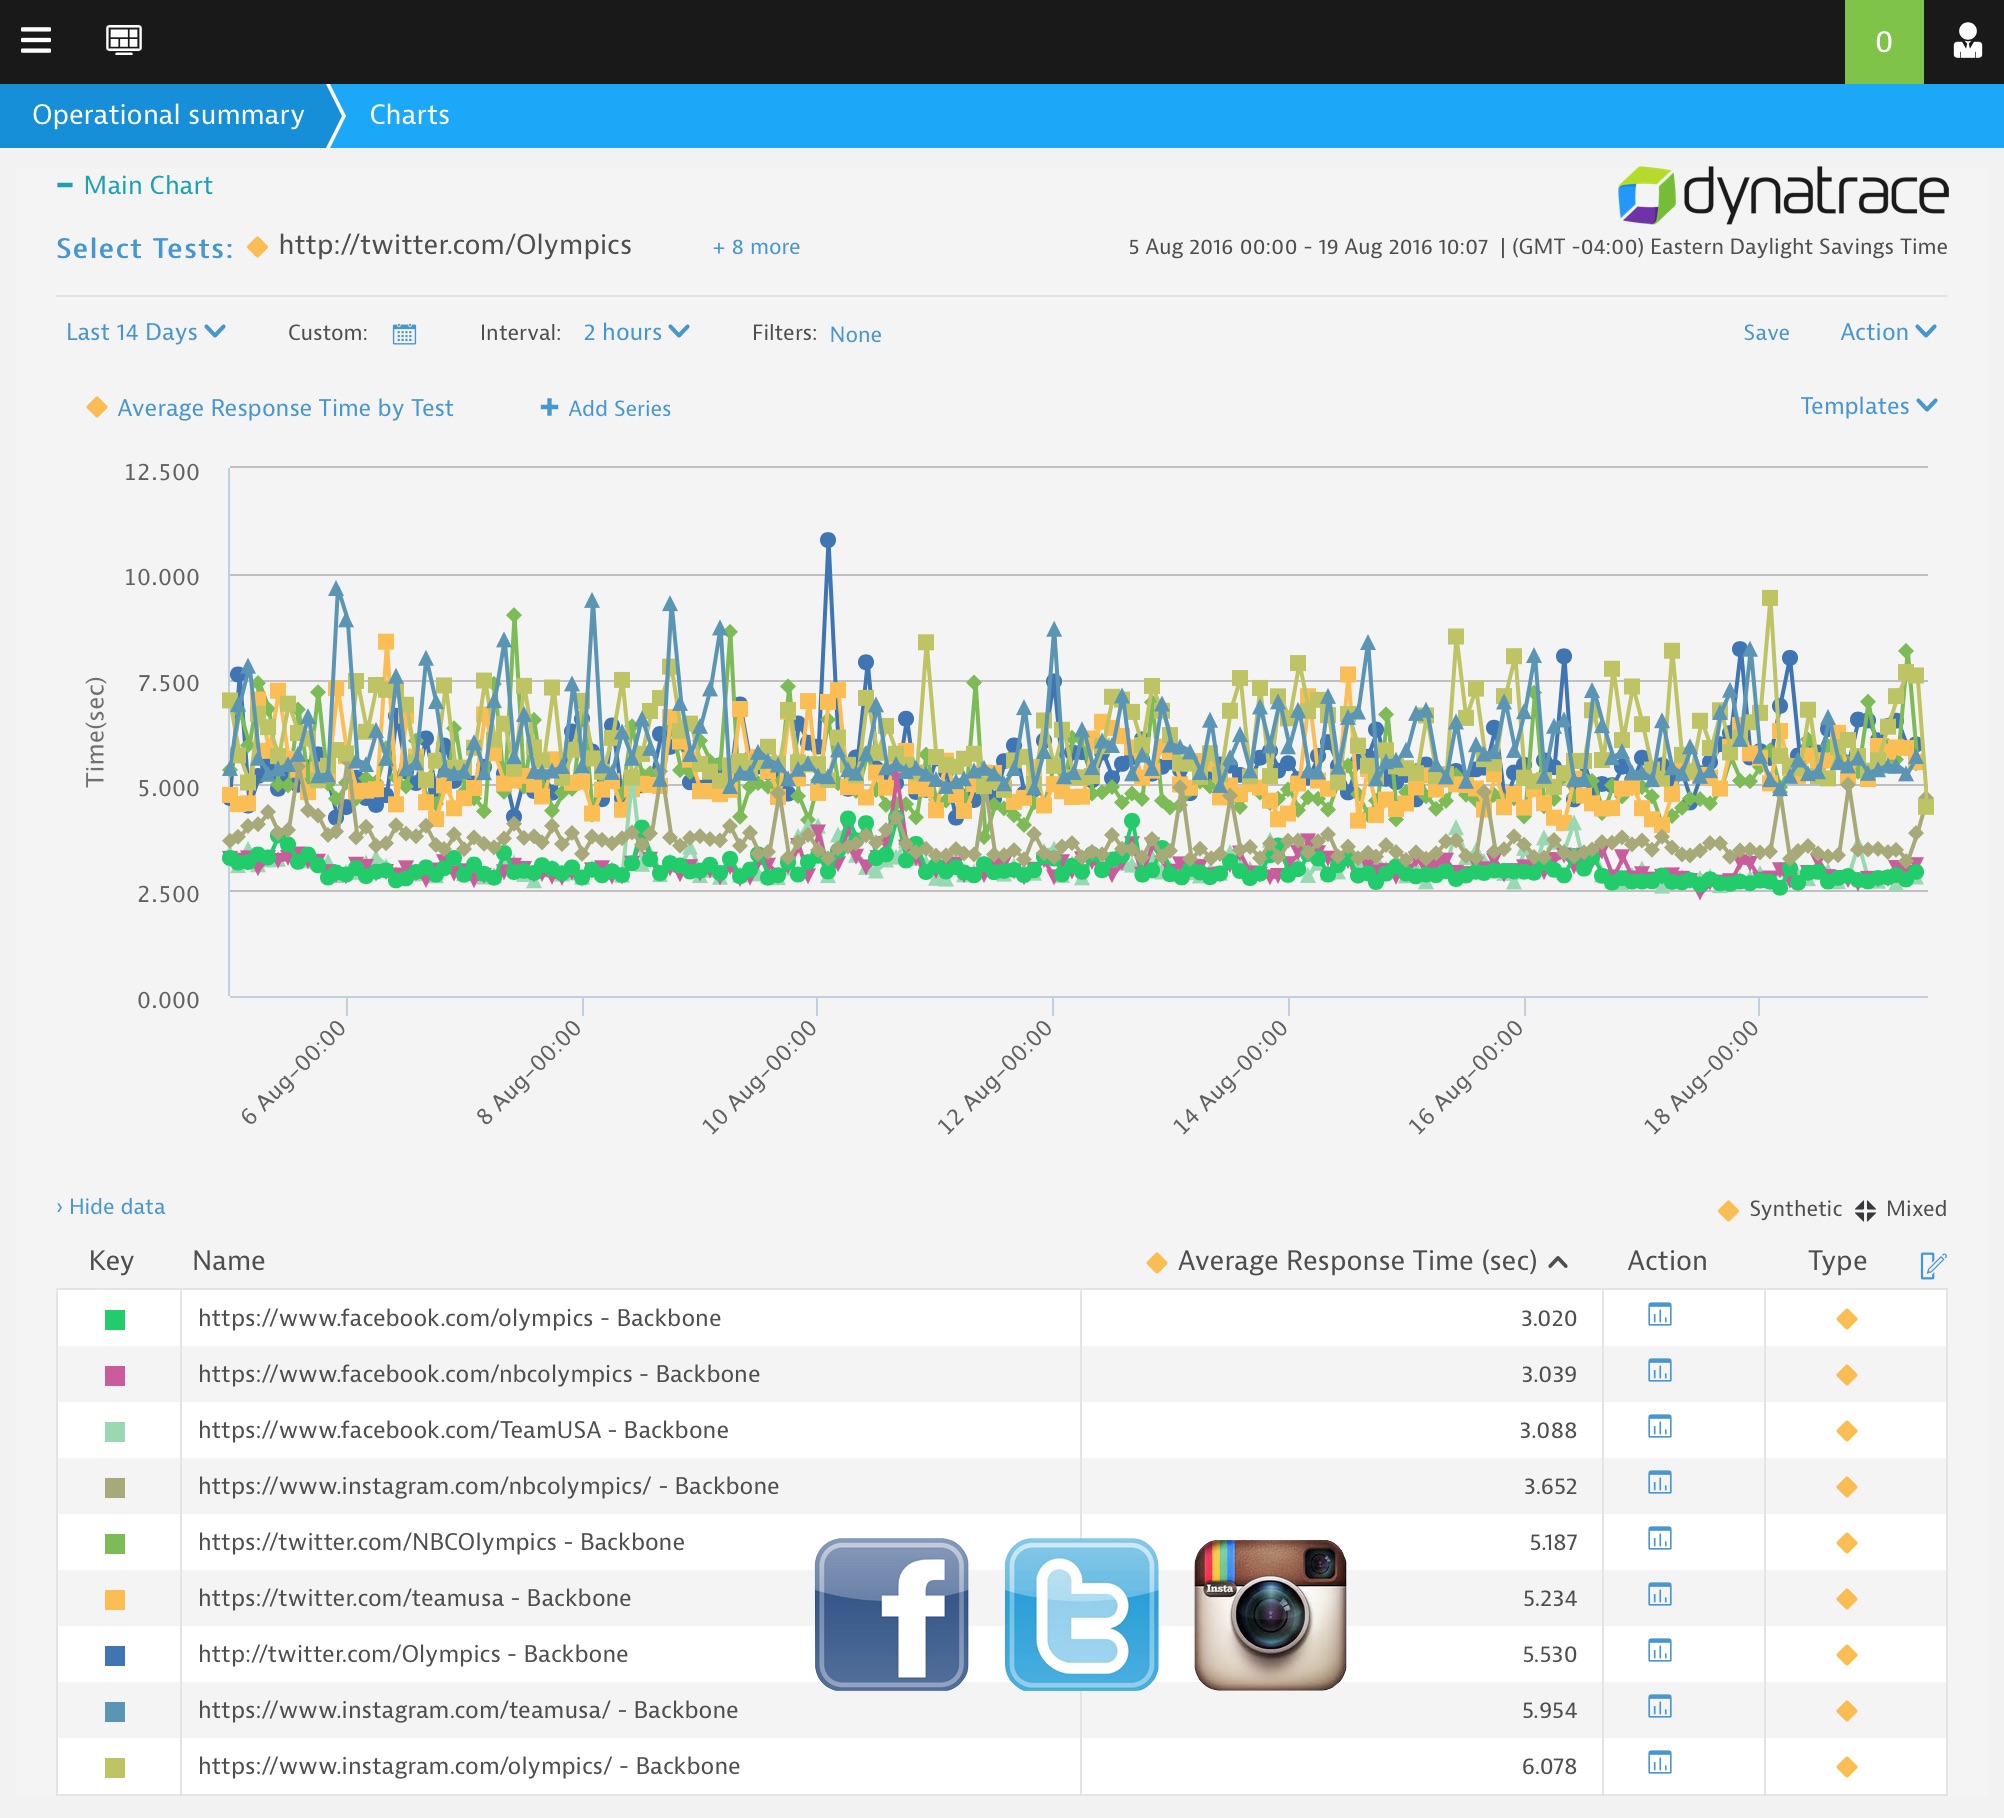
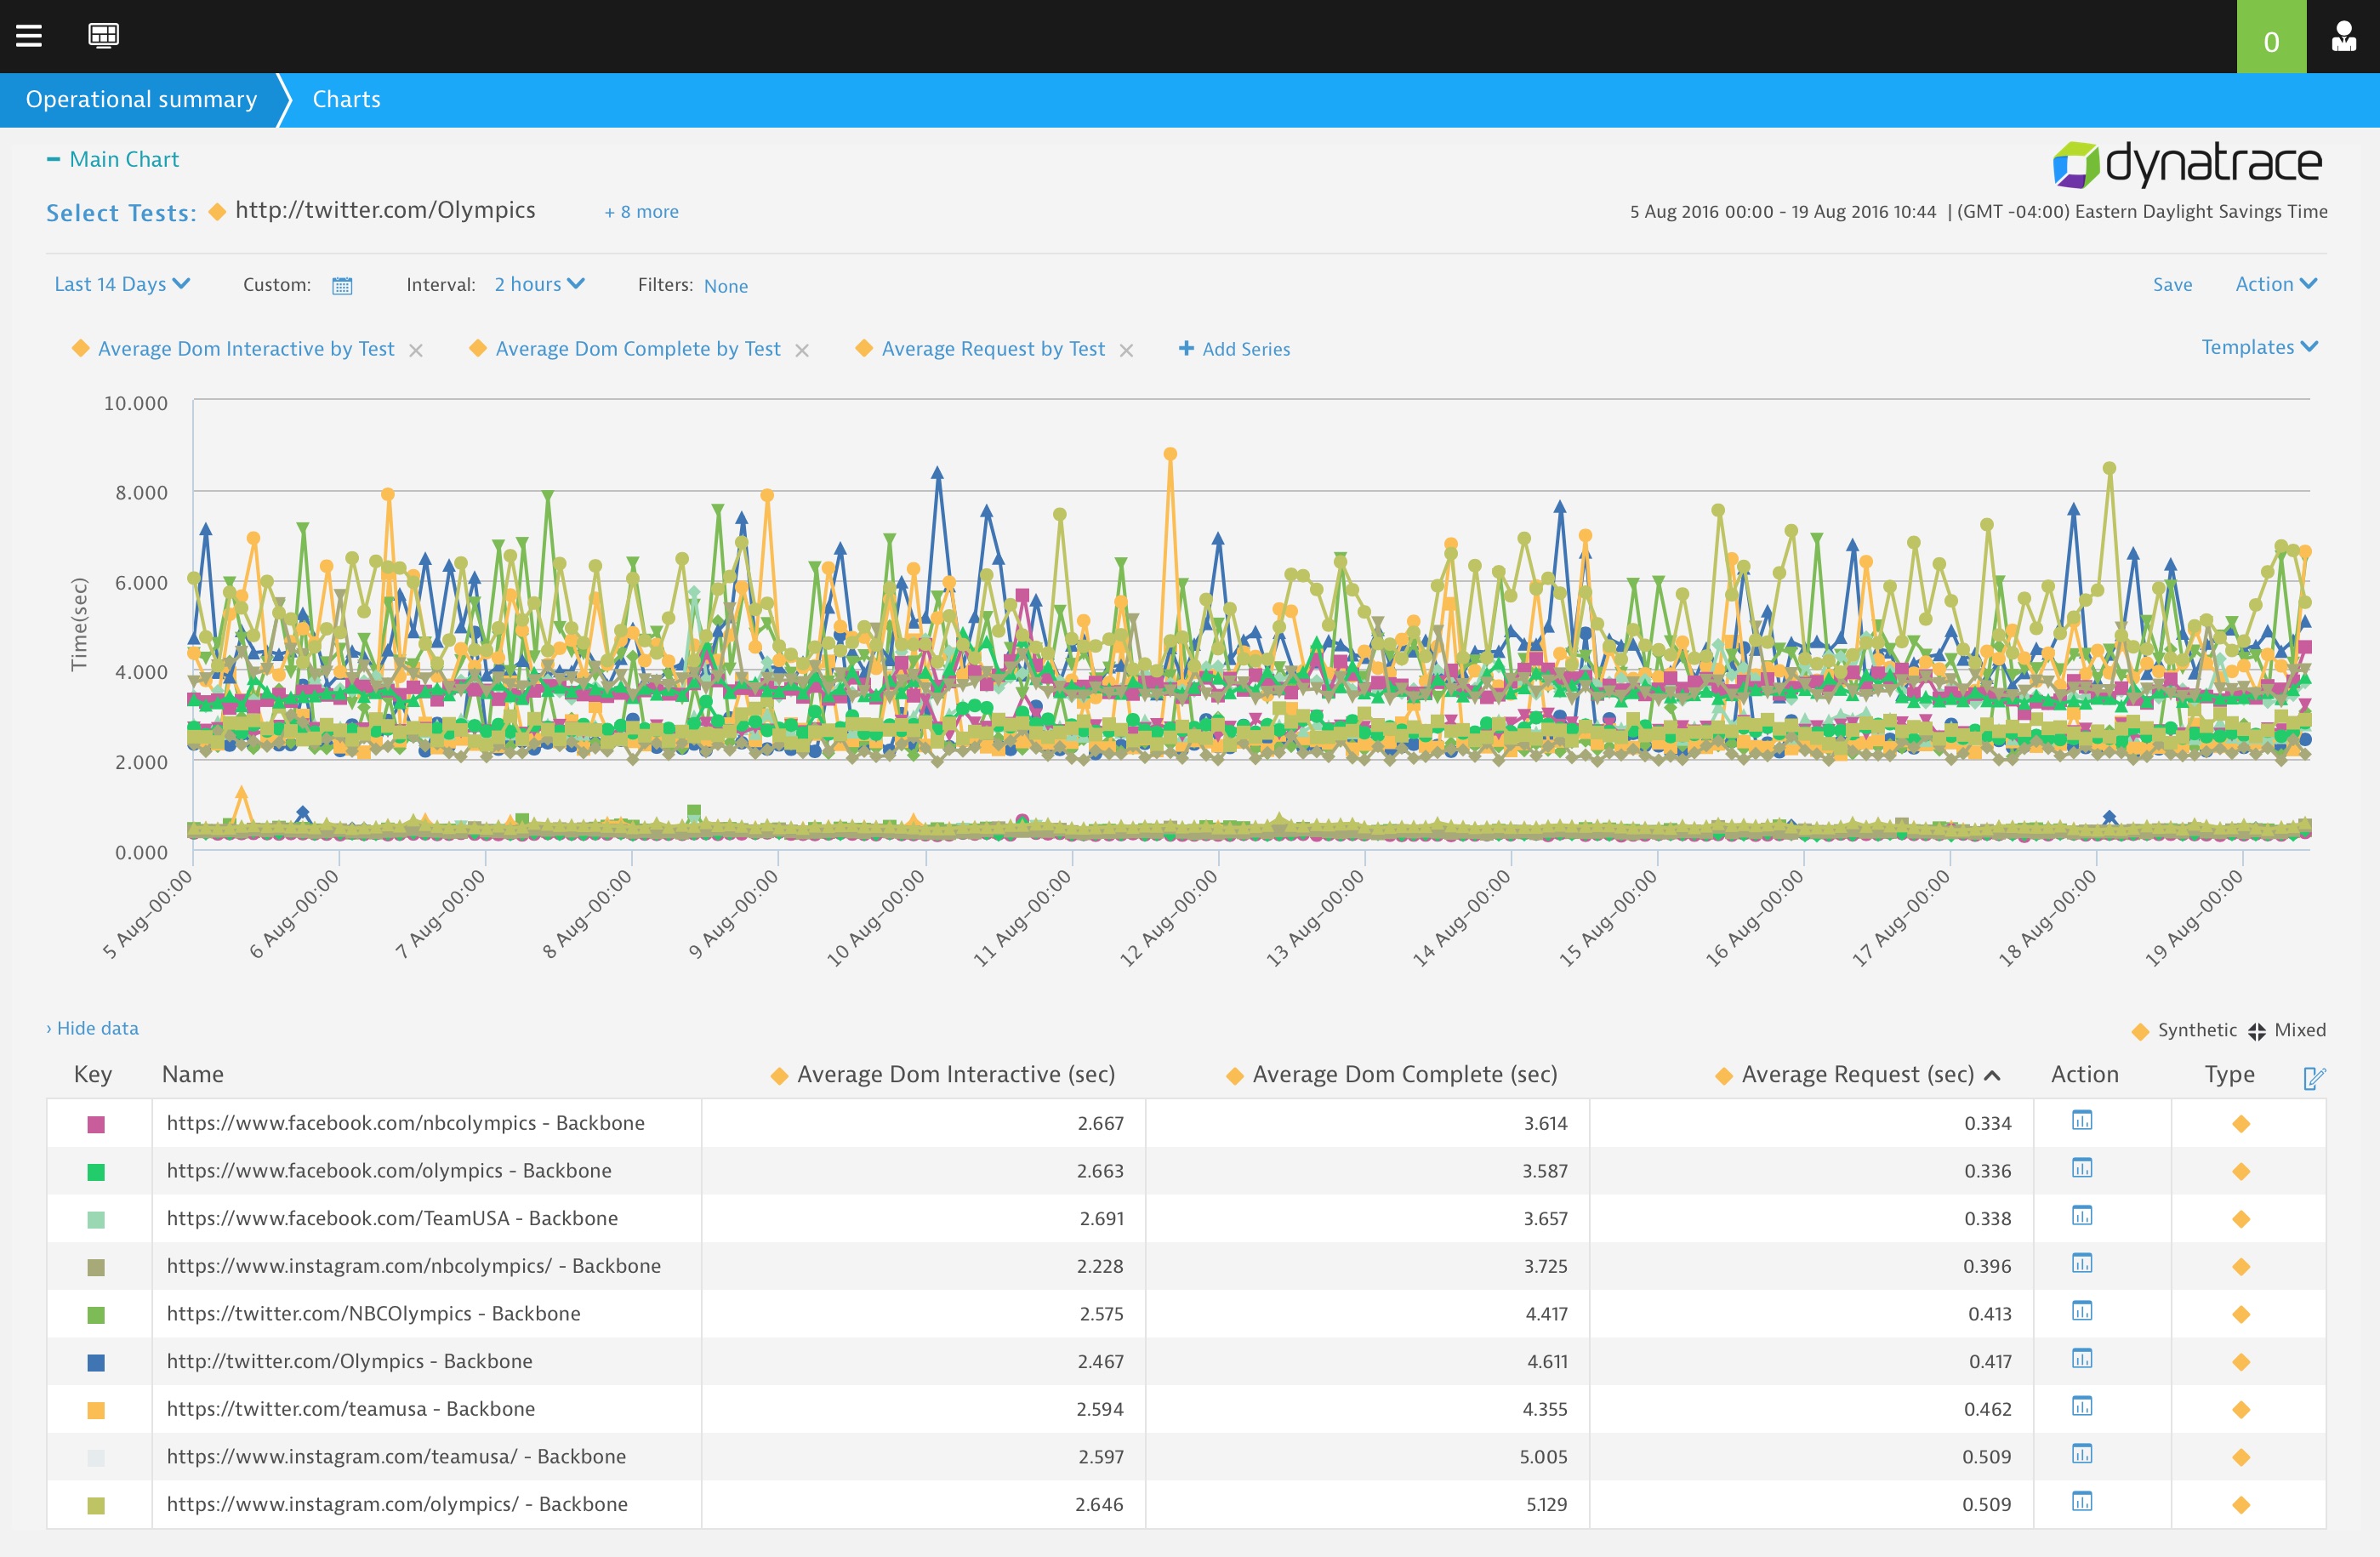
The results are so close, we looked at “over the wire” response time (this is the network response time), but also looked at several W3C metrics as well.
W3C DOM Interactive is when the browser considers the page to be built enough that a user could potential start interacting with it (clicking on things). W3C DOM Complete is when the browser has loaded all of the assets which could affect the functionality of the page. Finally W3C Request is a measure of server side responsiveness (the amount of time it takes to receive the first byte from a server in response to a request).
What’s clear is that these social media leaders really know how to deliver. Social media sites tend to favor a “New Stack” approach to delivering content. New Stack tends to represent the bleeding edge of web technologies. New Stack can refer to a variety of different technologies which can be utilized through the application delivery chain.
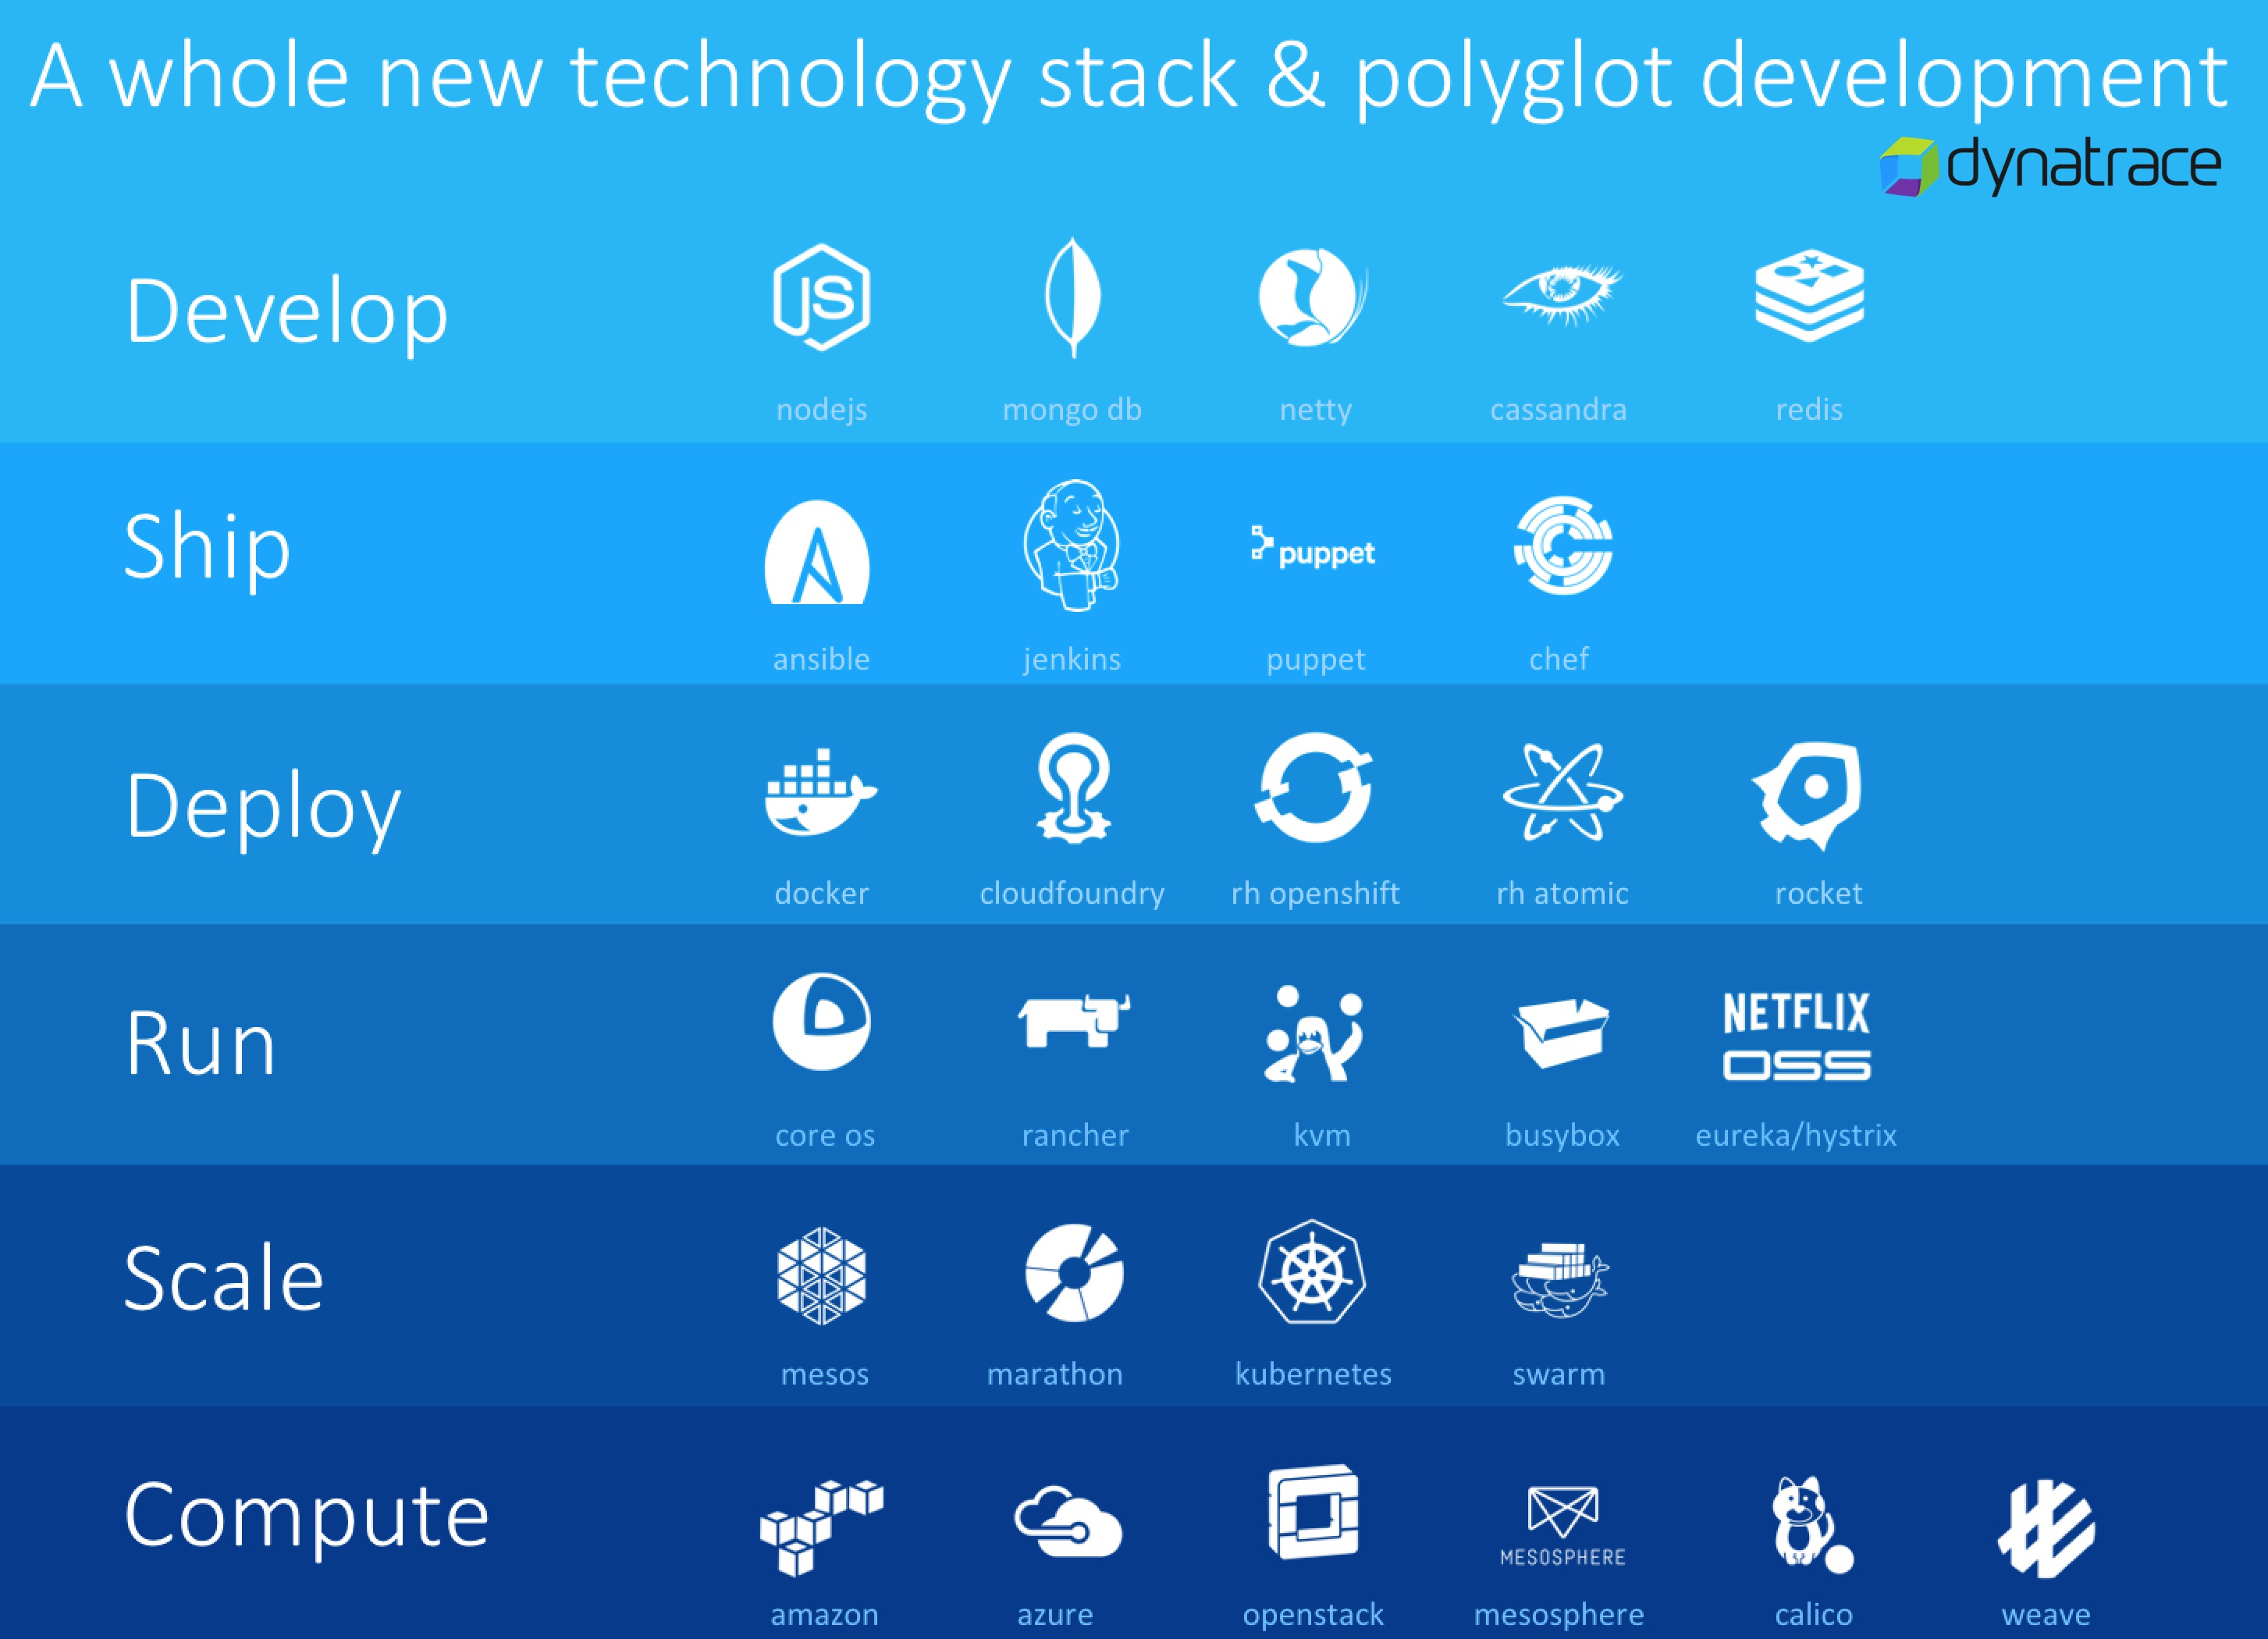
The results of this bleeding edge is the ability to deliver applications faster more efficiently in a highly scalable fashion. It changes the way applications are managed as the traditional view of monitoring servers is no longer relevant when applications are based on highly dynamic “elastic” architectures, where if one server fails it is no longer as catastrophic as it once was.
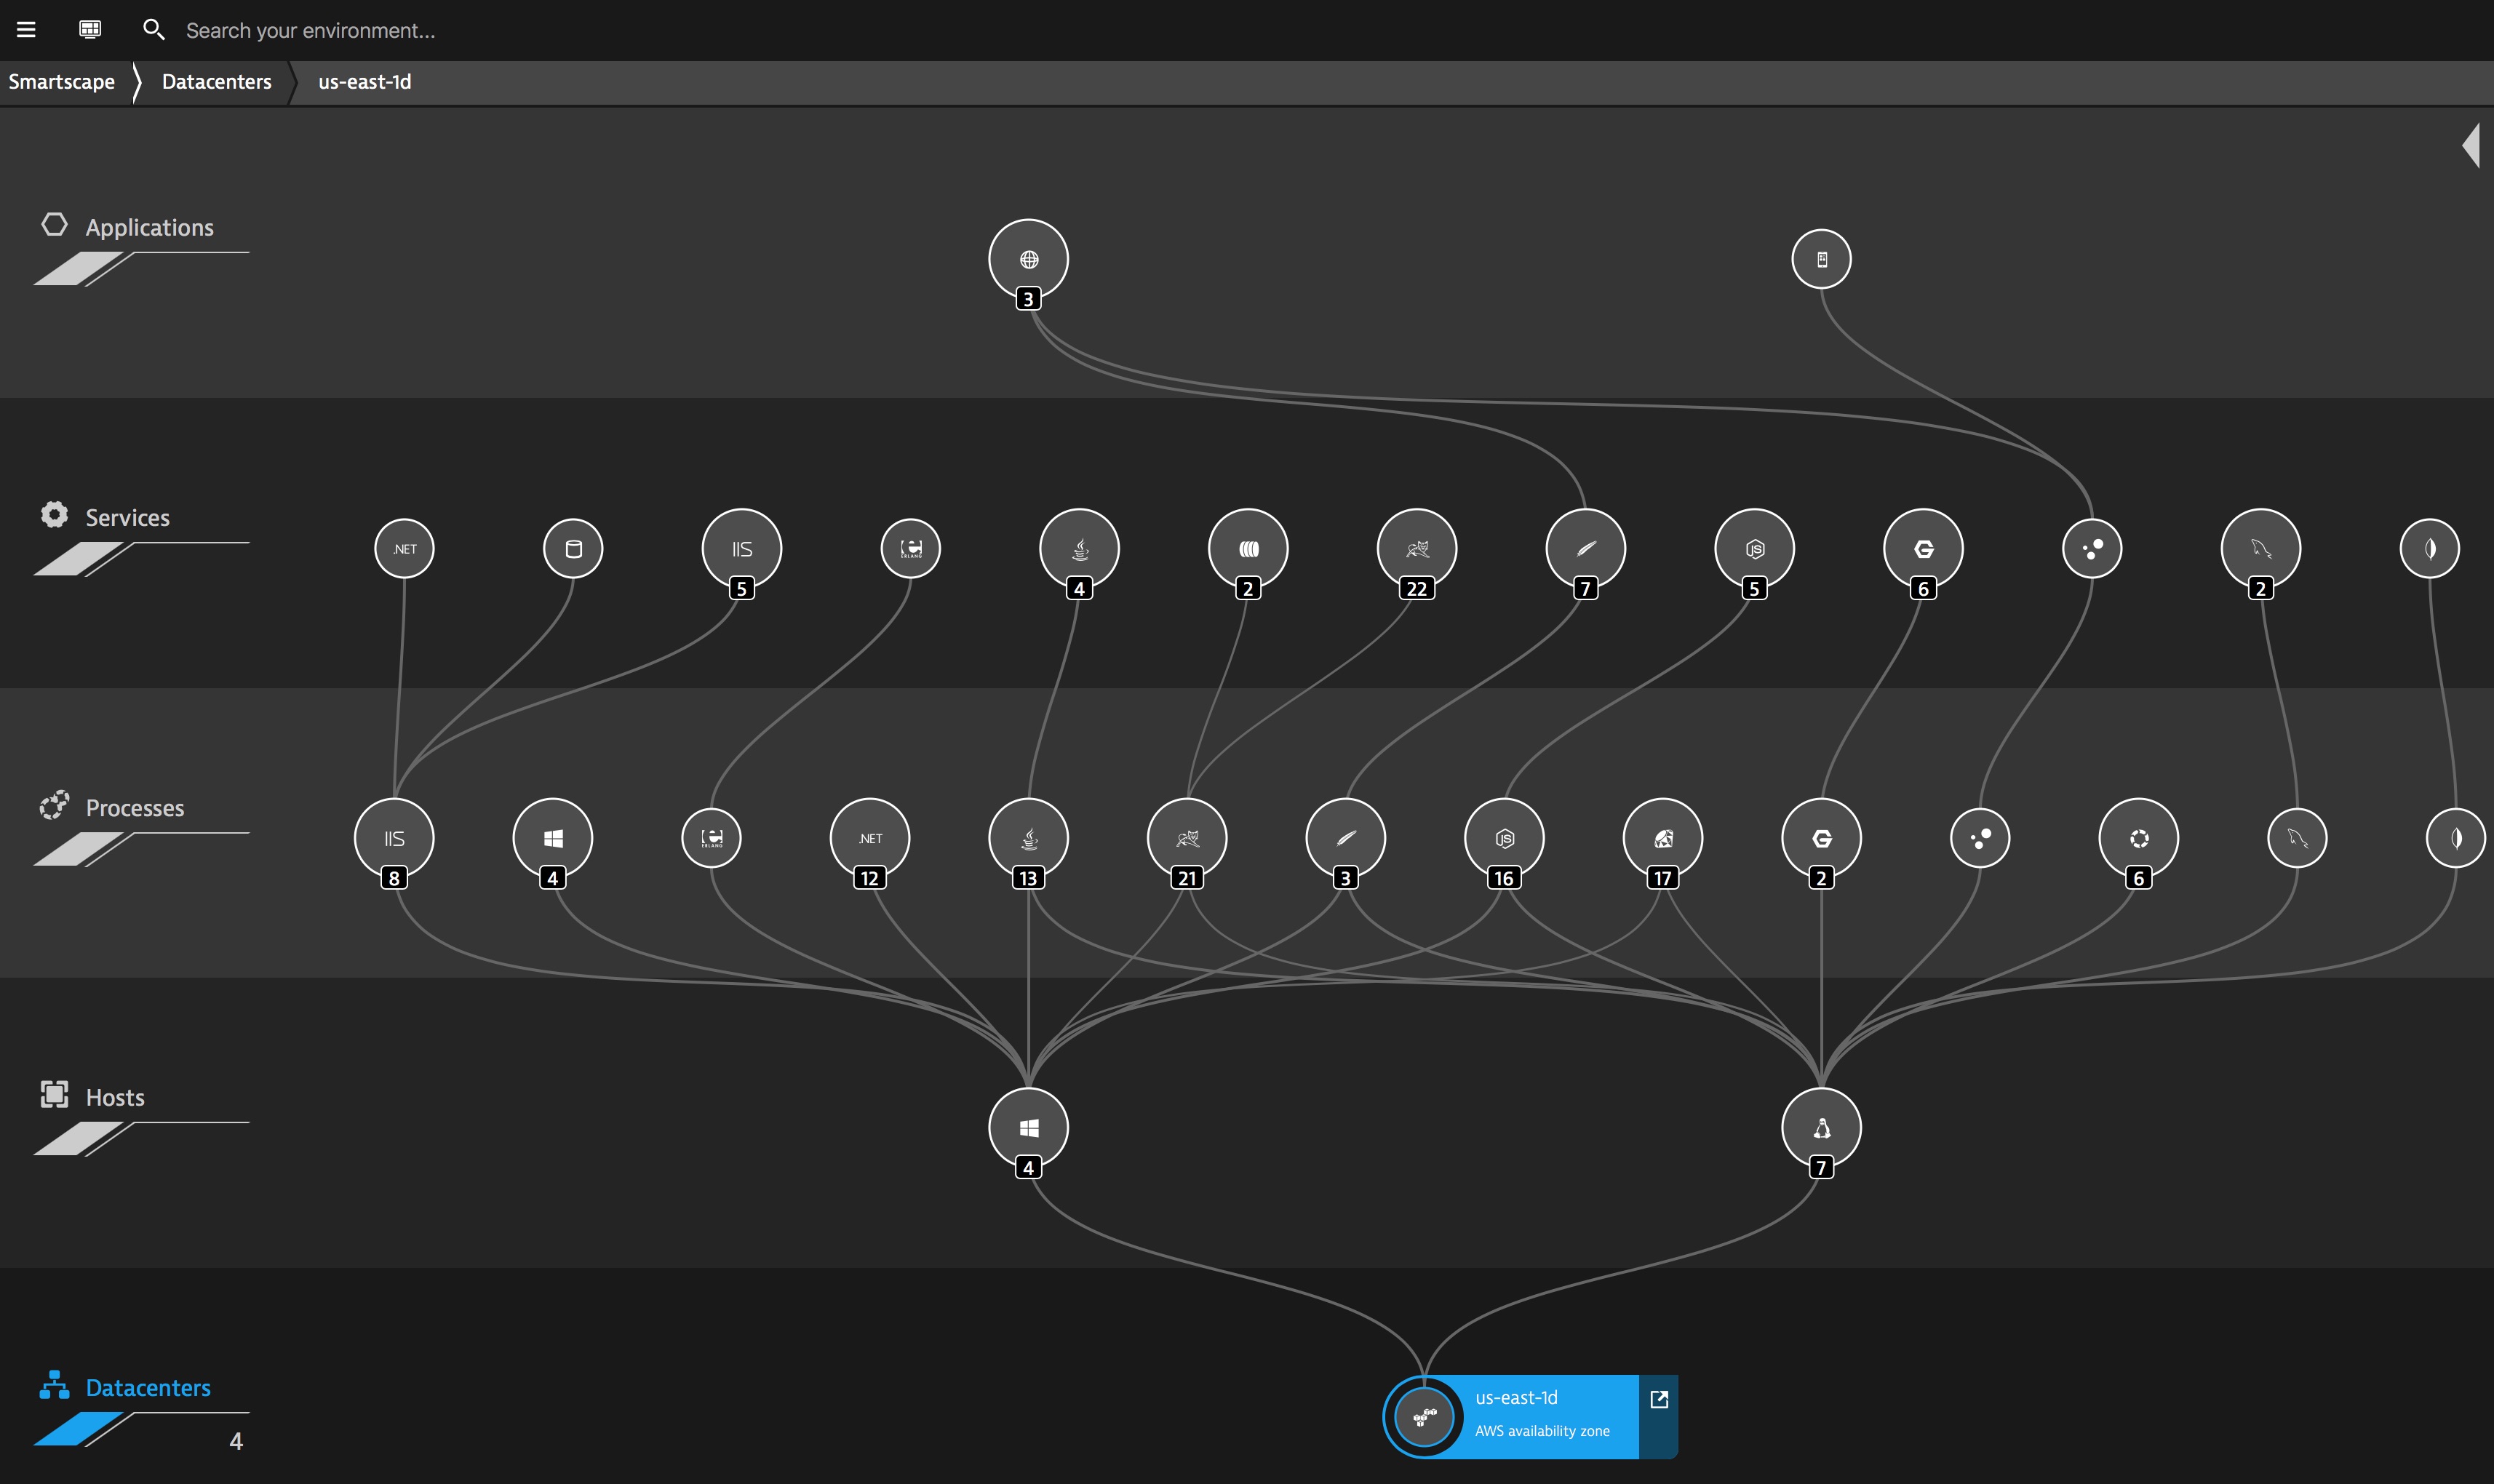
With the New Stack approach comes a paradigm shift in complexity. Managing this complexity requires a new way of looking at applications. The most effective way to do this is from an end user, full stack perspective. Where the ability to auto-discover and analyze technology dependencies is more important than rows upon rows of blinky lights.
Below is an example of a “SmartScape” view of technology dependencies. This is a glimpse into how to manage New Stack complexity.
So, back to our social media showdown results. We see that Facebook takes the gold for web performance. Our results were based on monitoring from around the globe, when we look at the results by country we see that end users in the USA and EMEA get the most benefit of these fast performing sites.
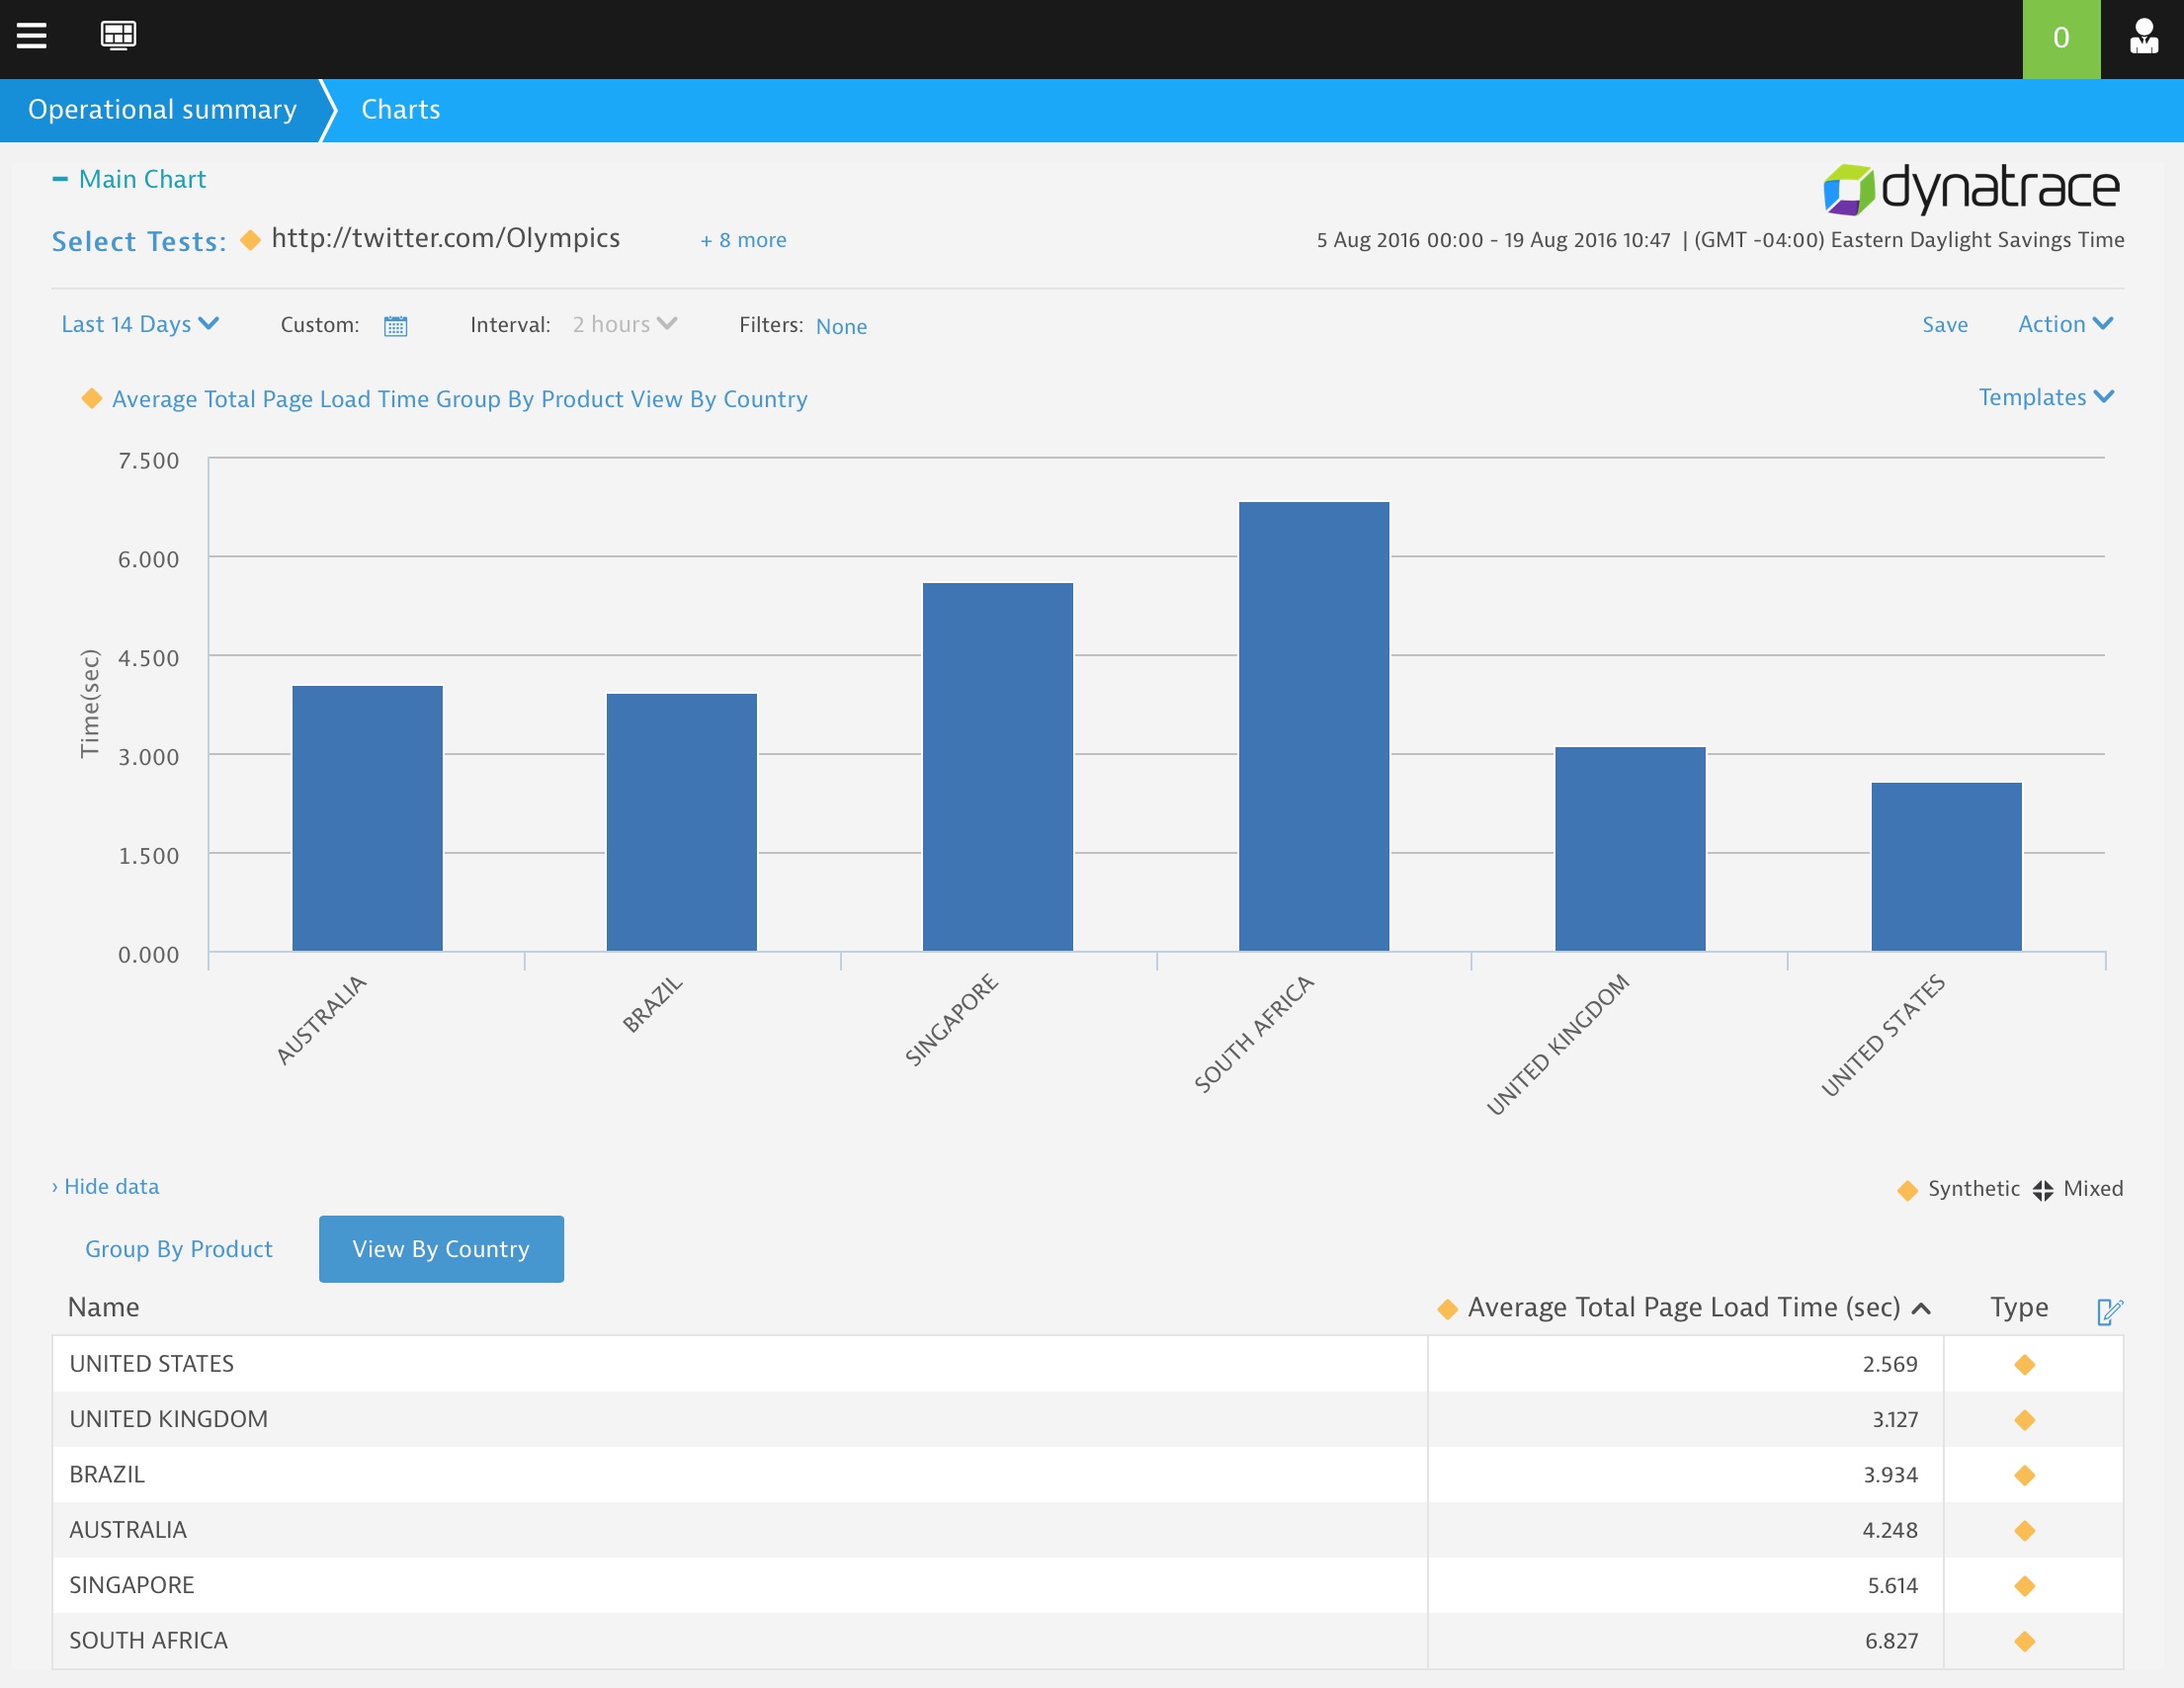
This actually raises an interesting point, while the New Stack introduces the ability to create highly performant and scalable sites, it doesn’t solve issues around network latency and the impact that client side complexity has on end user experience. Content providers need to keep end-user experience in mind when delivering their applications. This is even more important for those pushing into developing markets across the globe that do not have the mature network infrastructure that exists in North America and EMEA.
Join us next time as we take a closer look at a digital summary of the 2016 Olympic Games and answer the question, “Was Brazil Digitally Prepared?”.
Update: 11:00pm August 18th, 2016 by David Jones
The Dynatrace Rio Report — A View From Down Under
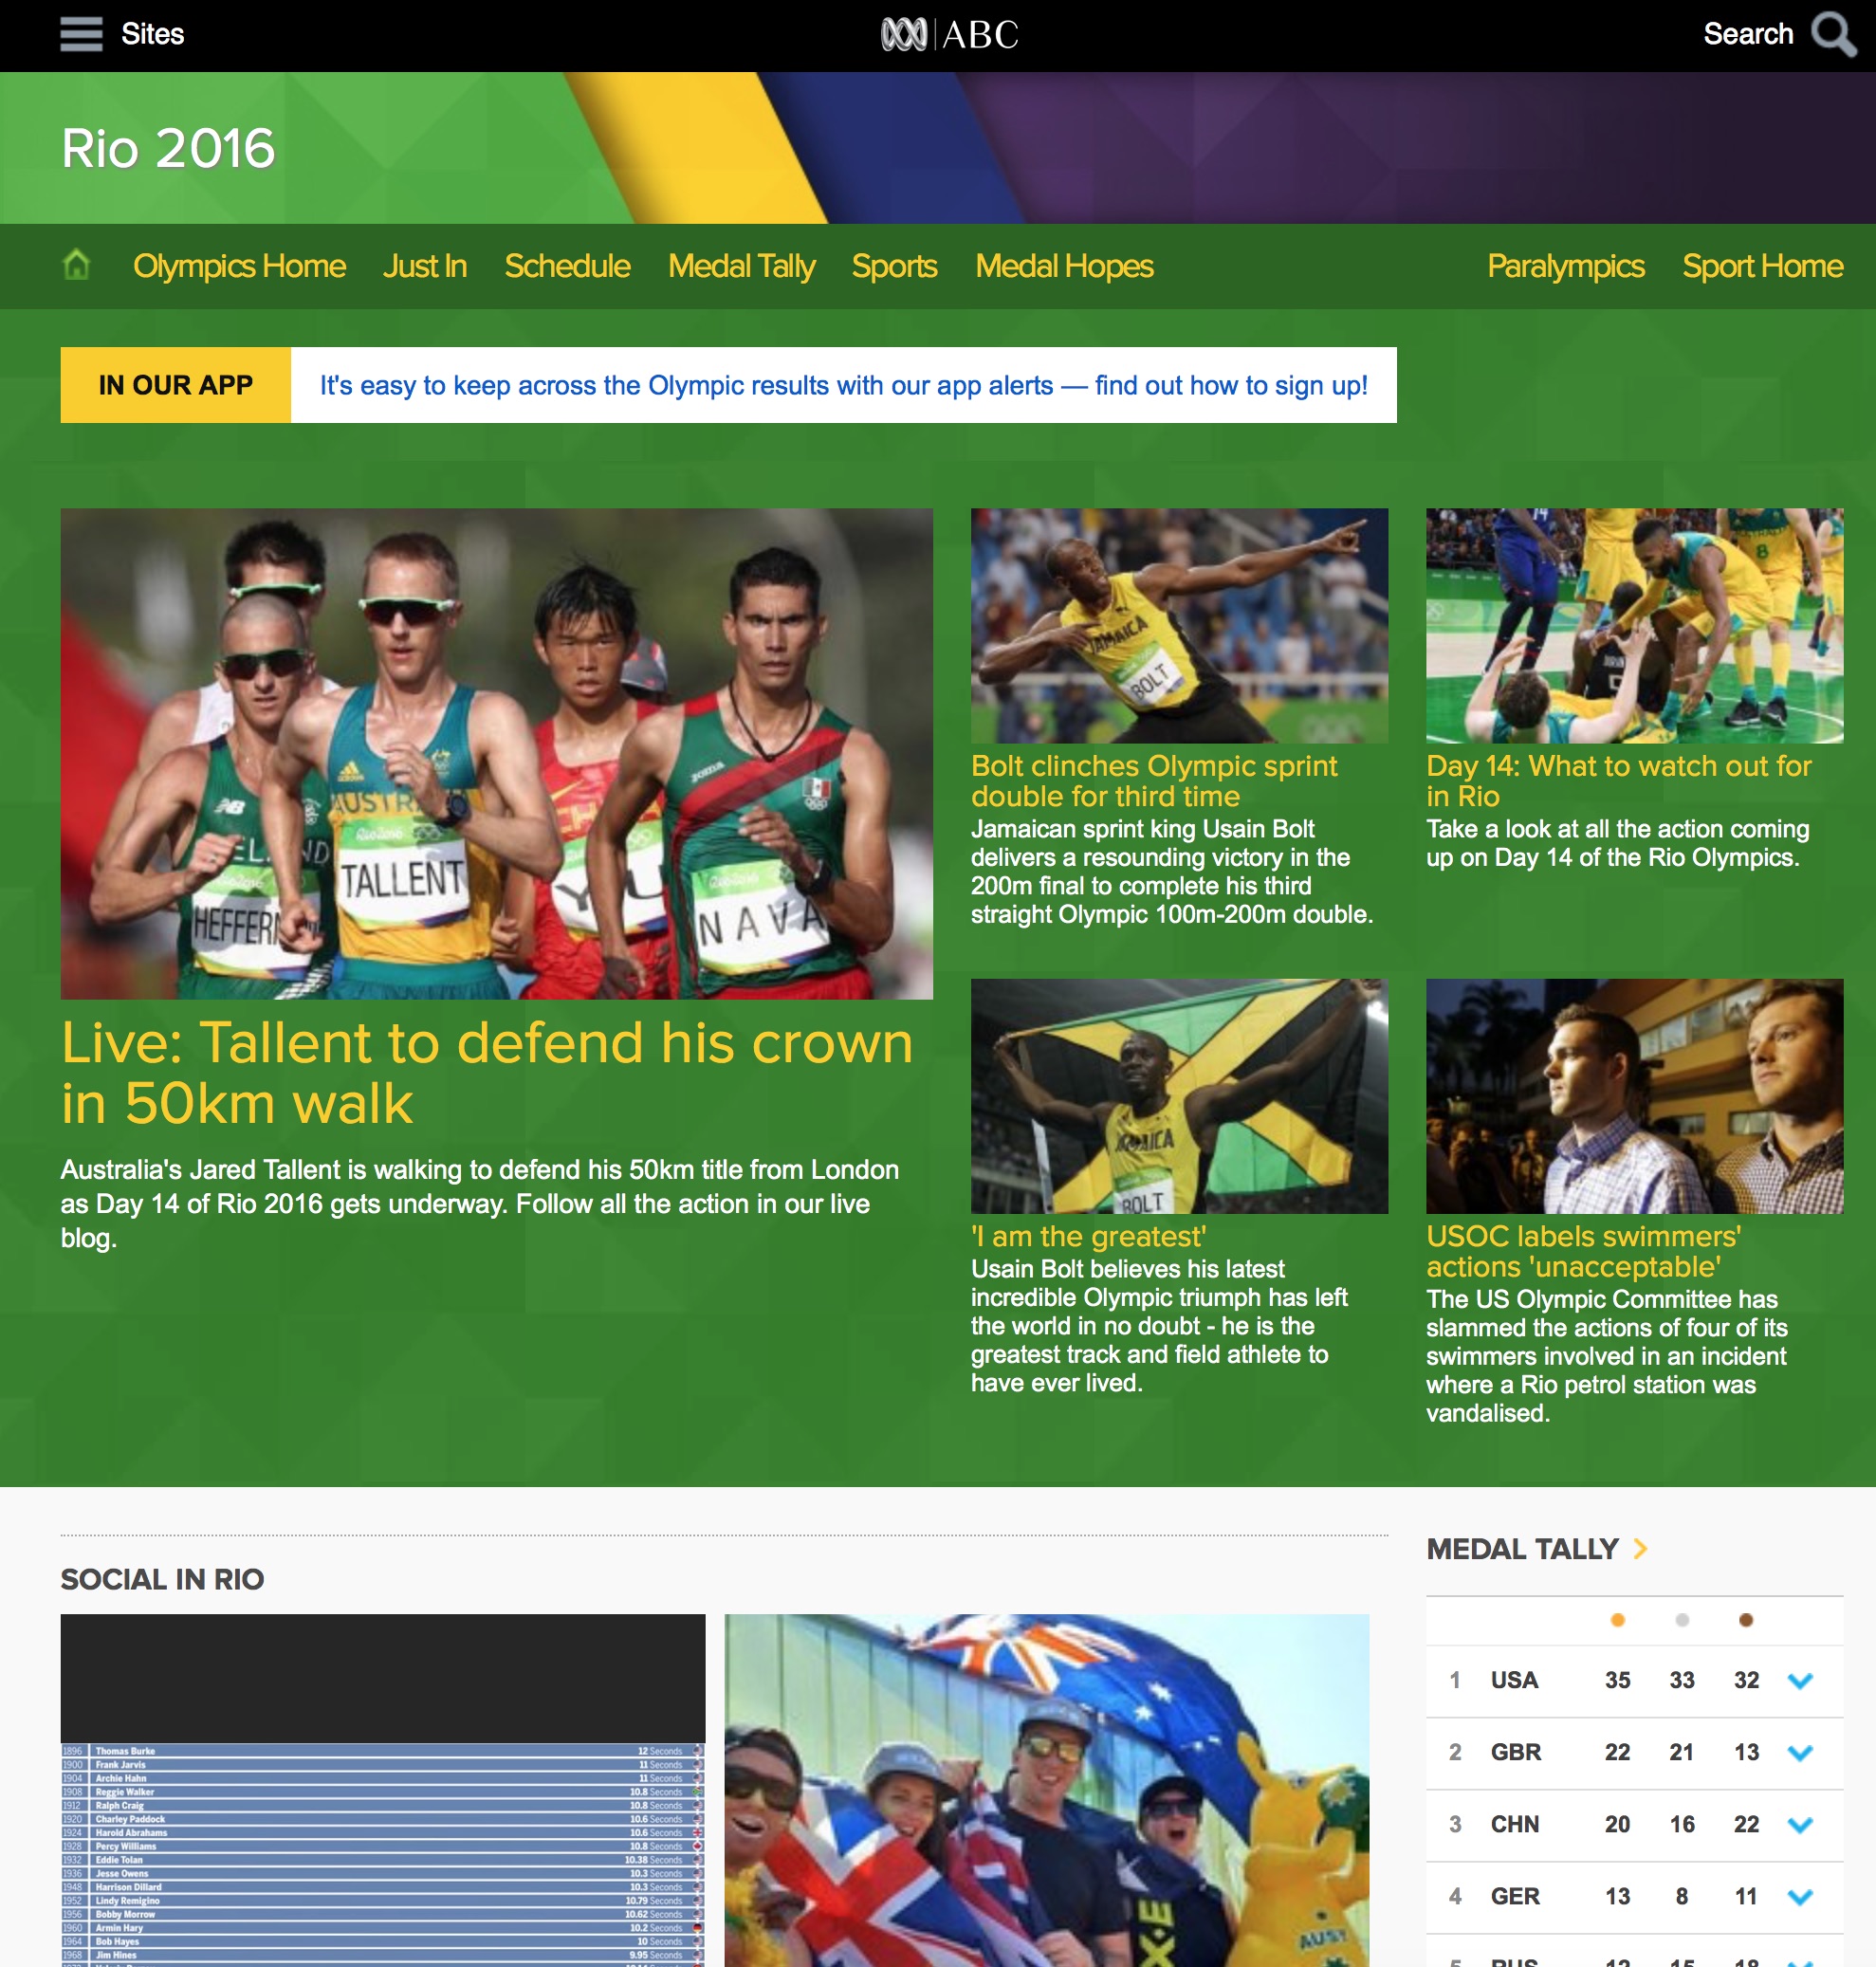
There is so much going on, and like a fourth position Olympian we need to catch up. In this installment of the Dynatrace Rio Report, we took a look at some results from the land down under. Scrappy Australia has punched its way into the top 10 by medal count so let’s have a look at how some Olympic-related sites are performing.
These results are being observed from real browsers on the Dynatrace Synthetic Network from across the globe. Here we looked at some news media and social media sites.
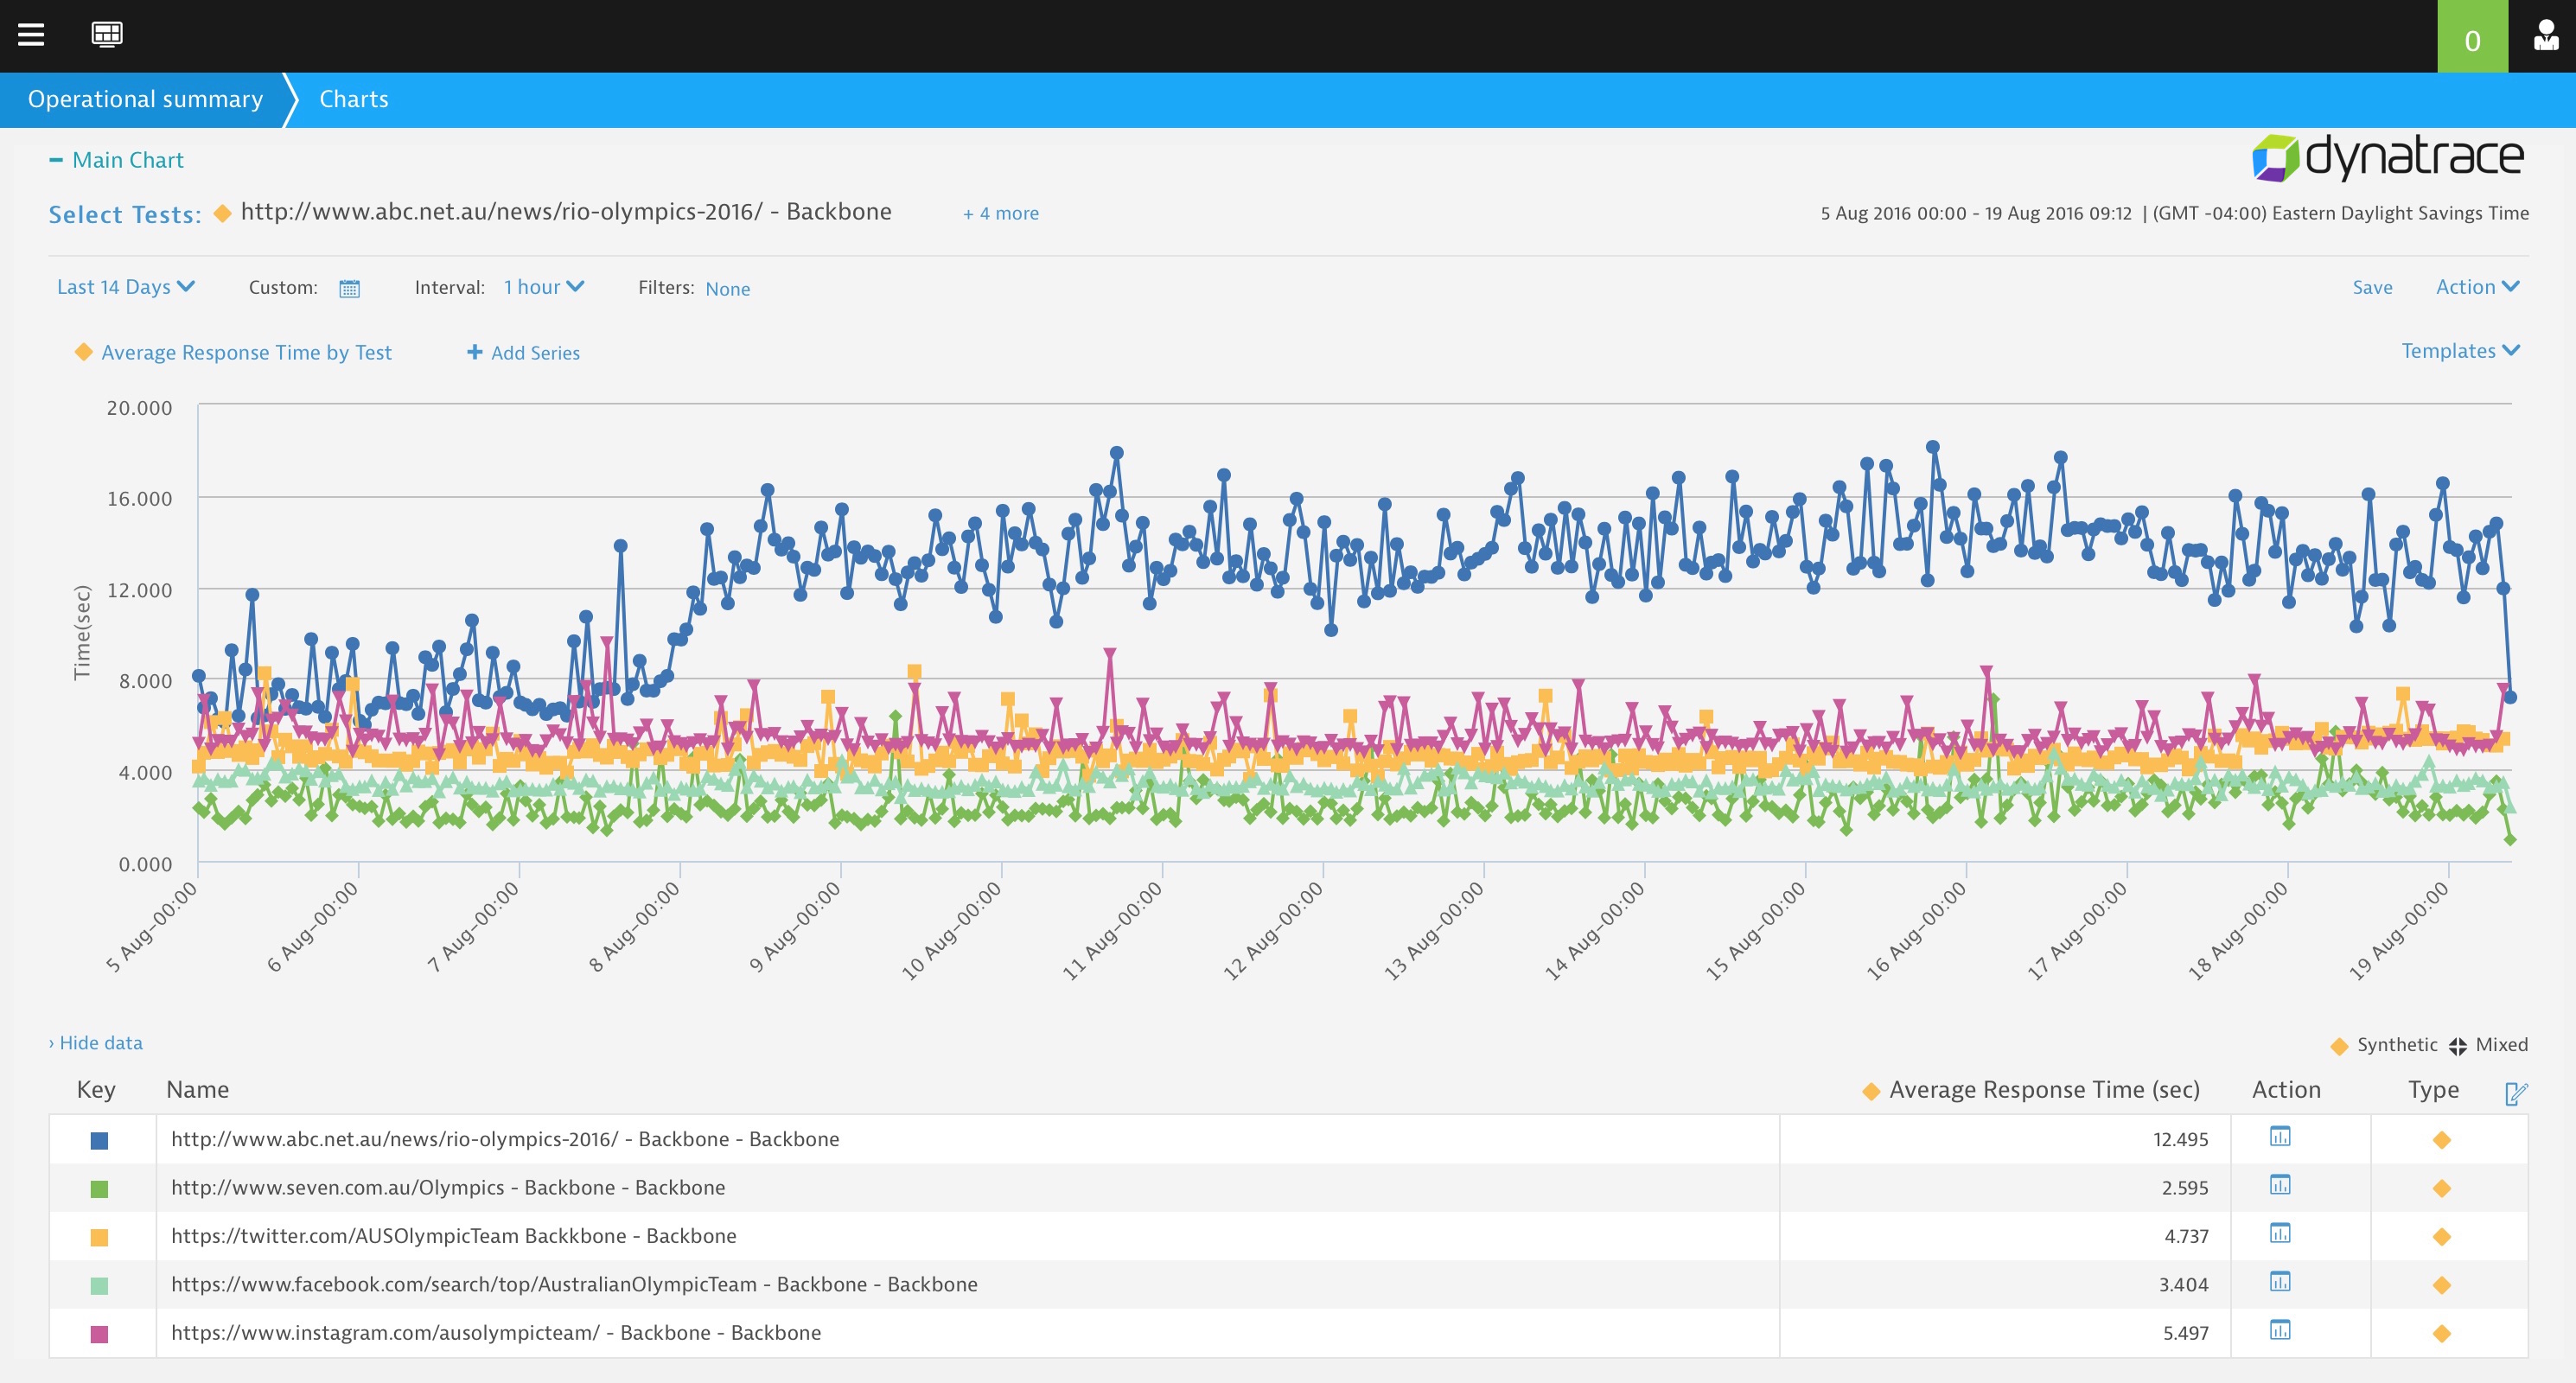
The results were pretty consistent with the exception of one of the news media sites which saw a sudden jump in response time on Aug. 7.
ABC, The Australia Broadcast Company made a site change on the 7th and we can see a cumulative increase in page weight/byte count (this is the amount of data being transferred when the page is loaded).
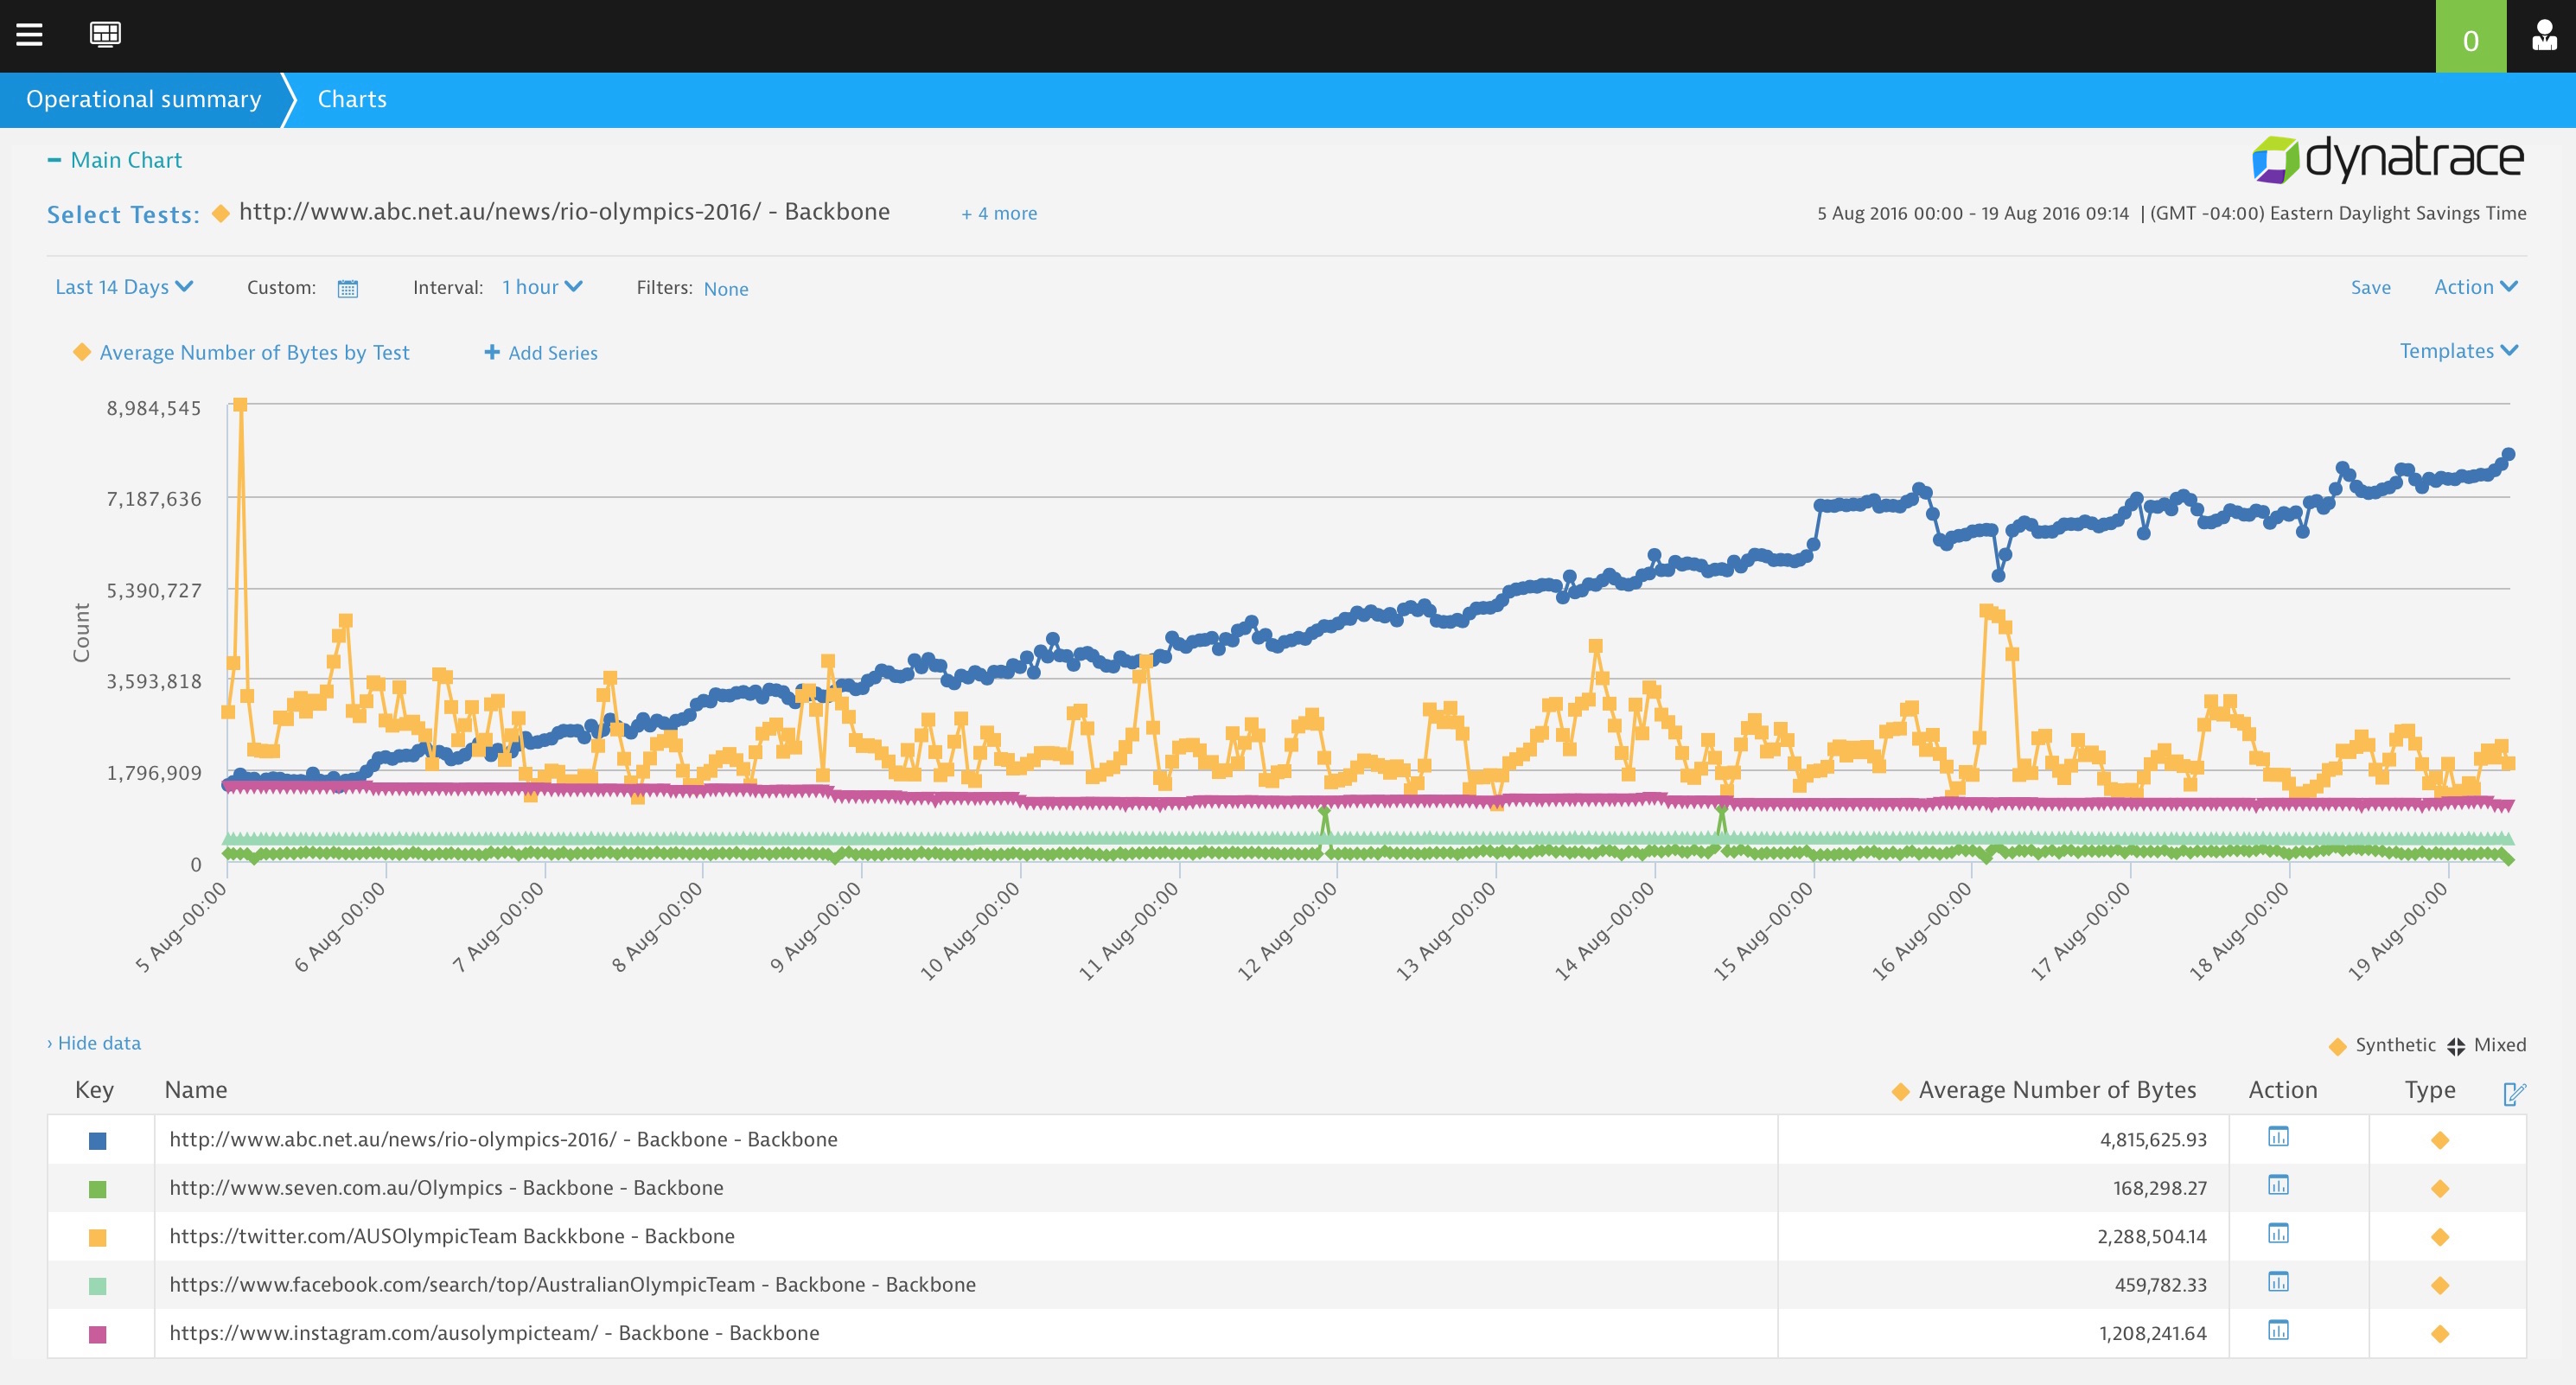
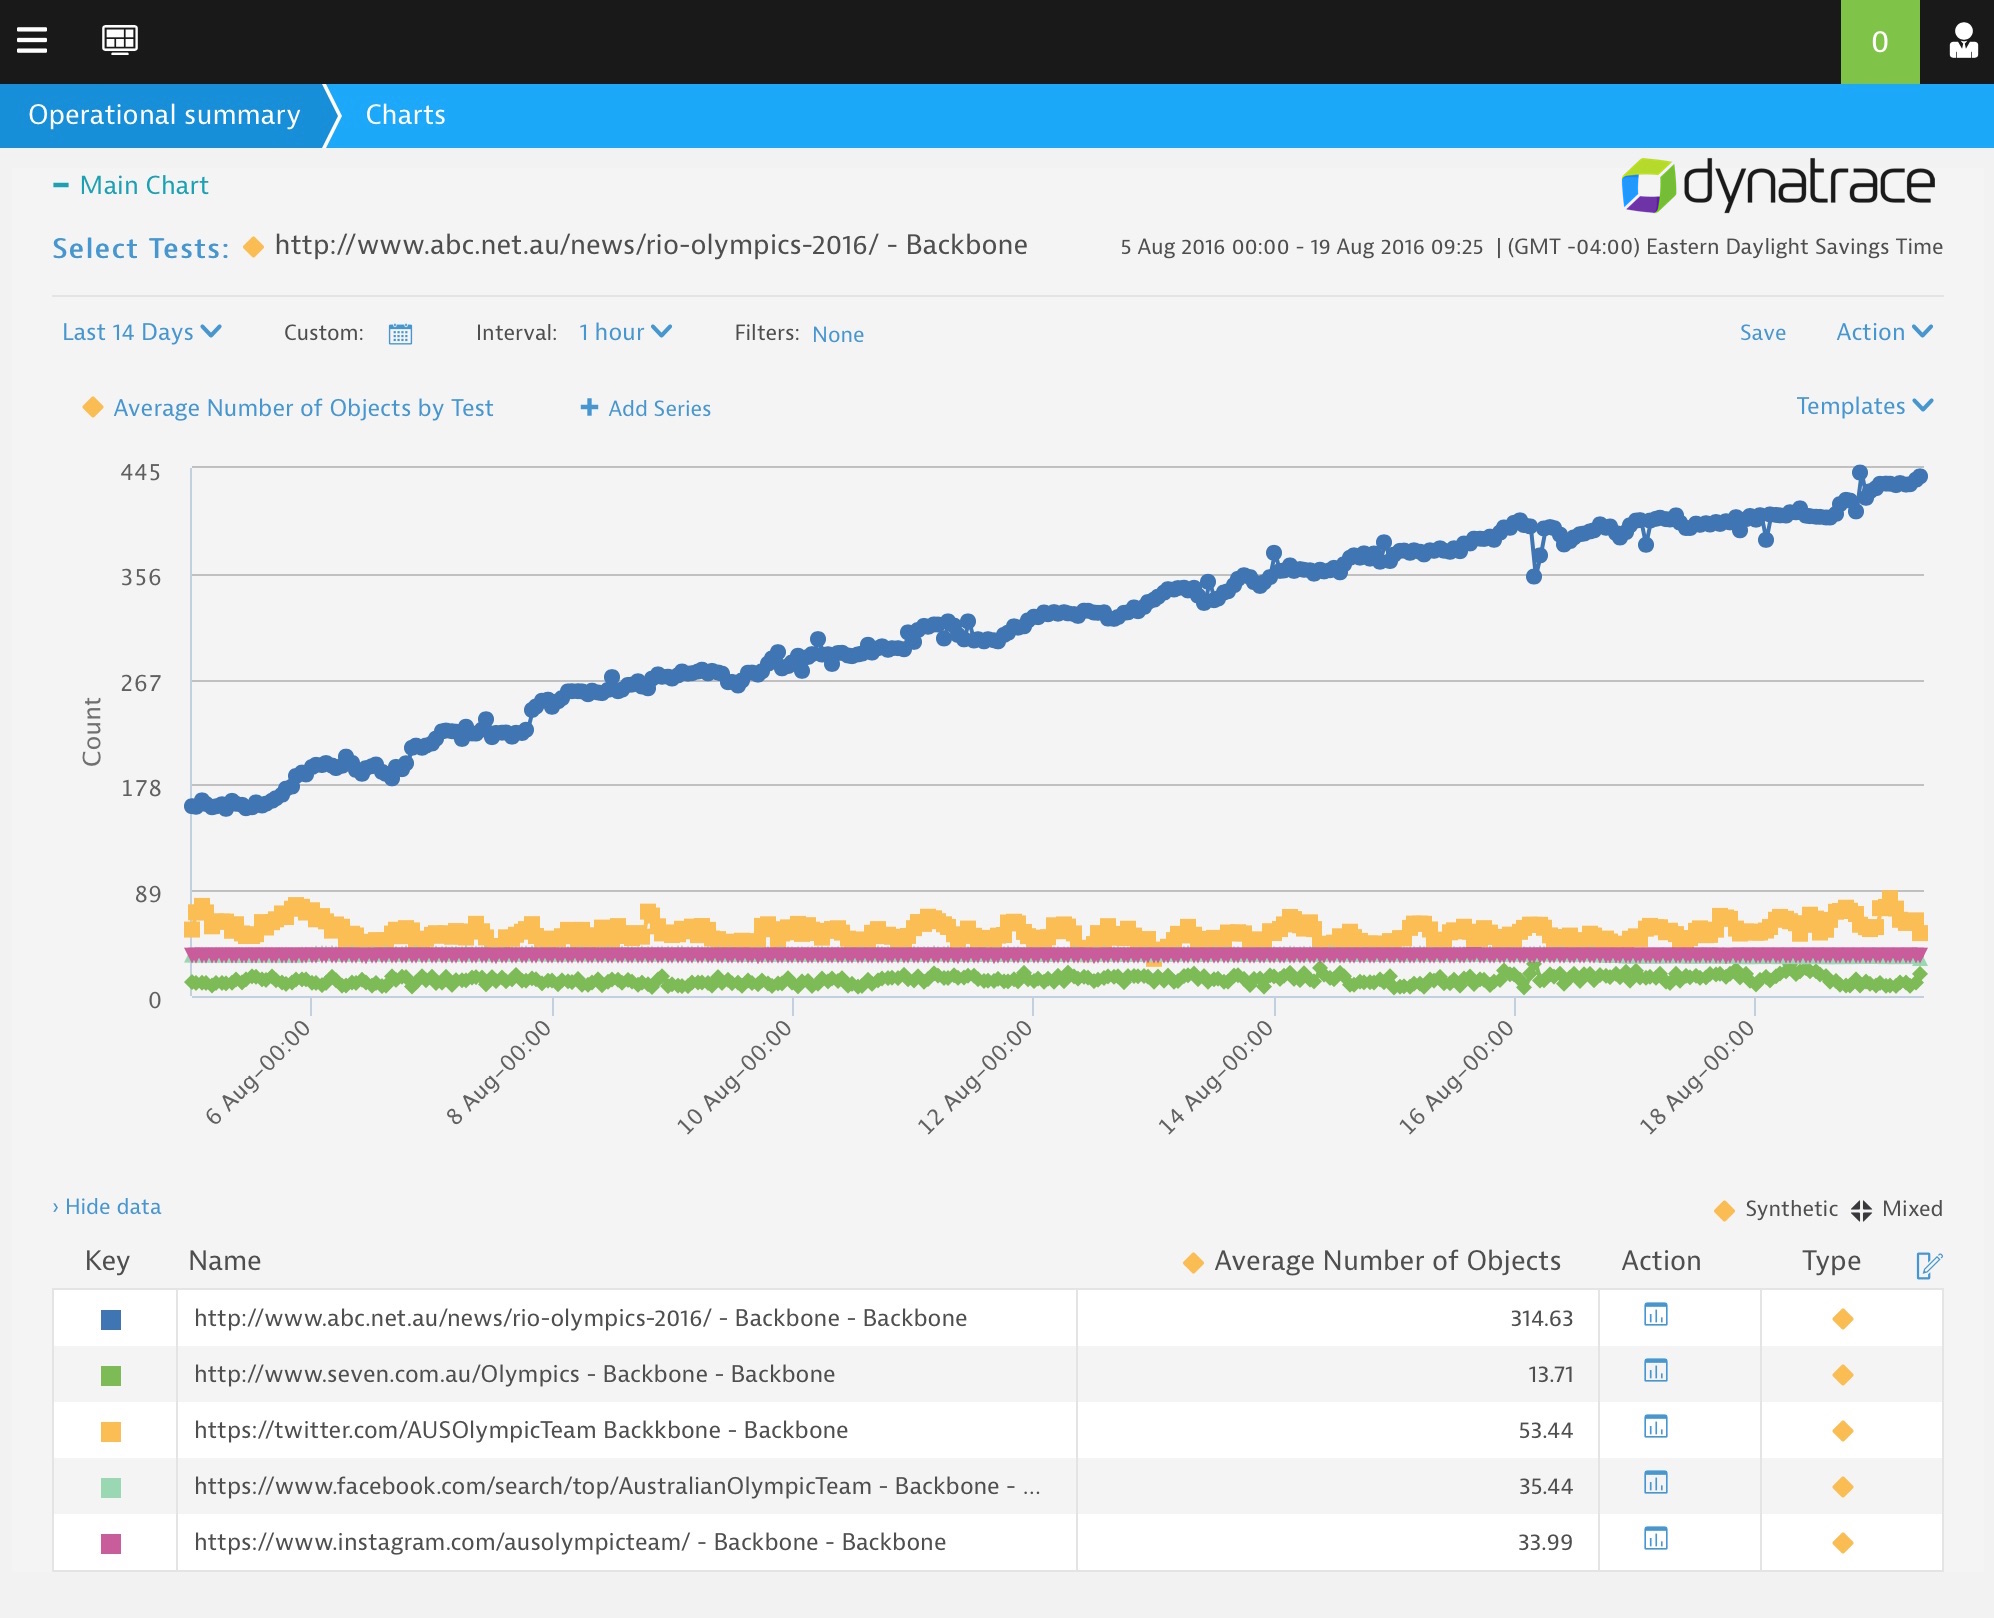
We can also see a cumulative increase in the number of object requests (network round trips) starting at the same time.
What’s interesting about this change is that other than the initial change in response time (seen in the first chart at the top of the page) as the byte and object count increase we are not seeing a corresponding increase in response time. We’d expect to see a close to linear increase as more content is pushed out, but we are not.
Below you can see some detail around their page as we are looking at dozens of different metrics. An interesting observation is that metrics like DOM Interactive (this is at what point could a user potential start clicking things on the page) have remained the same after the site change.
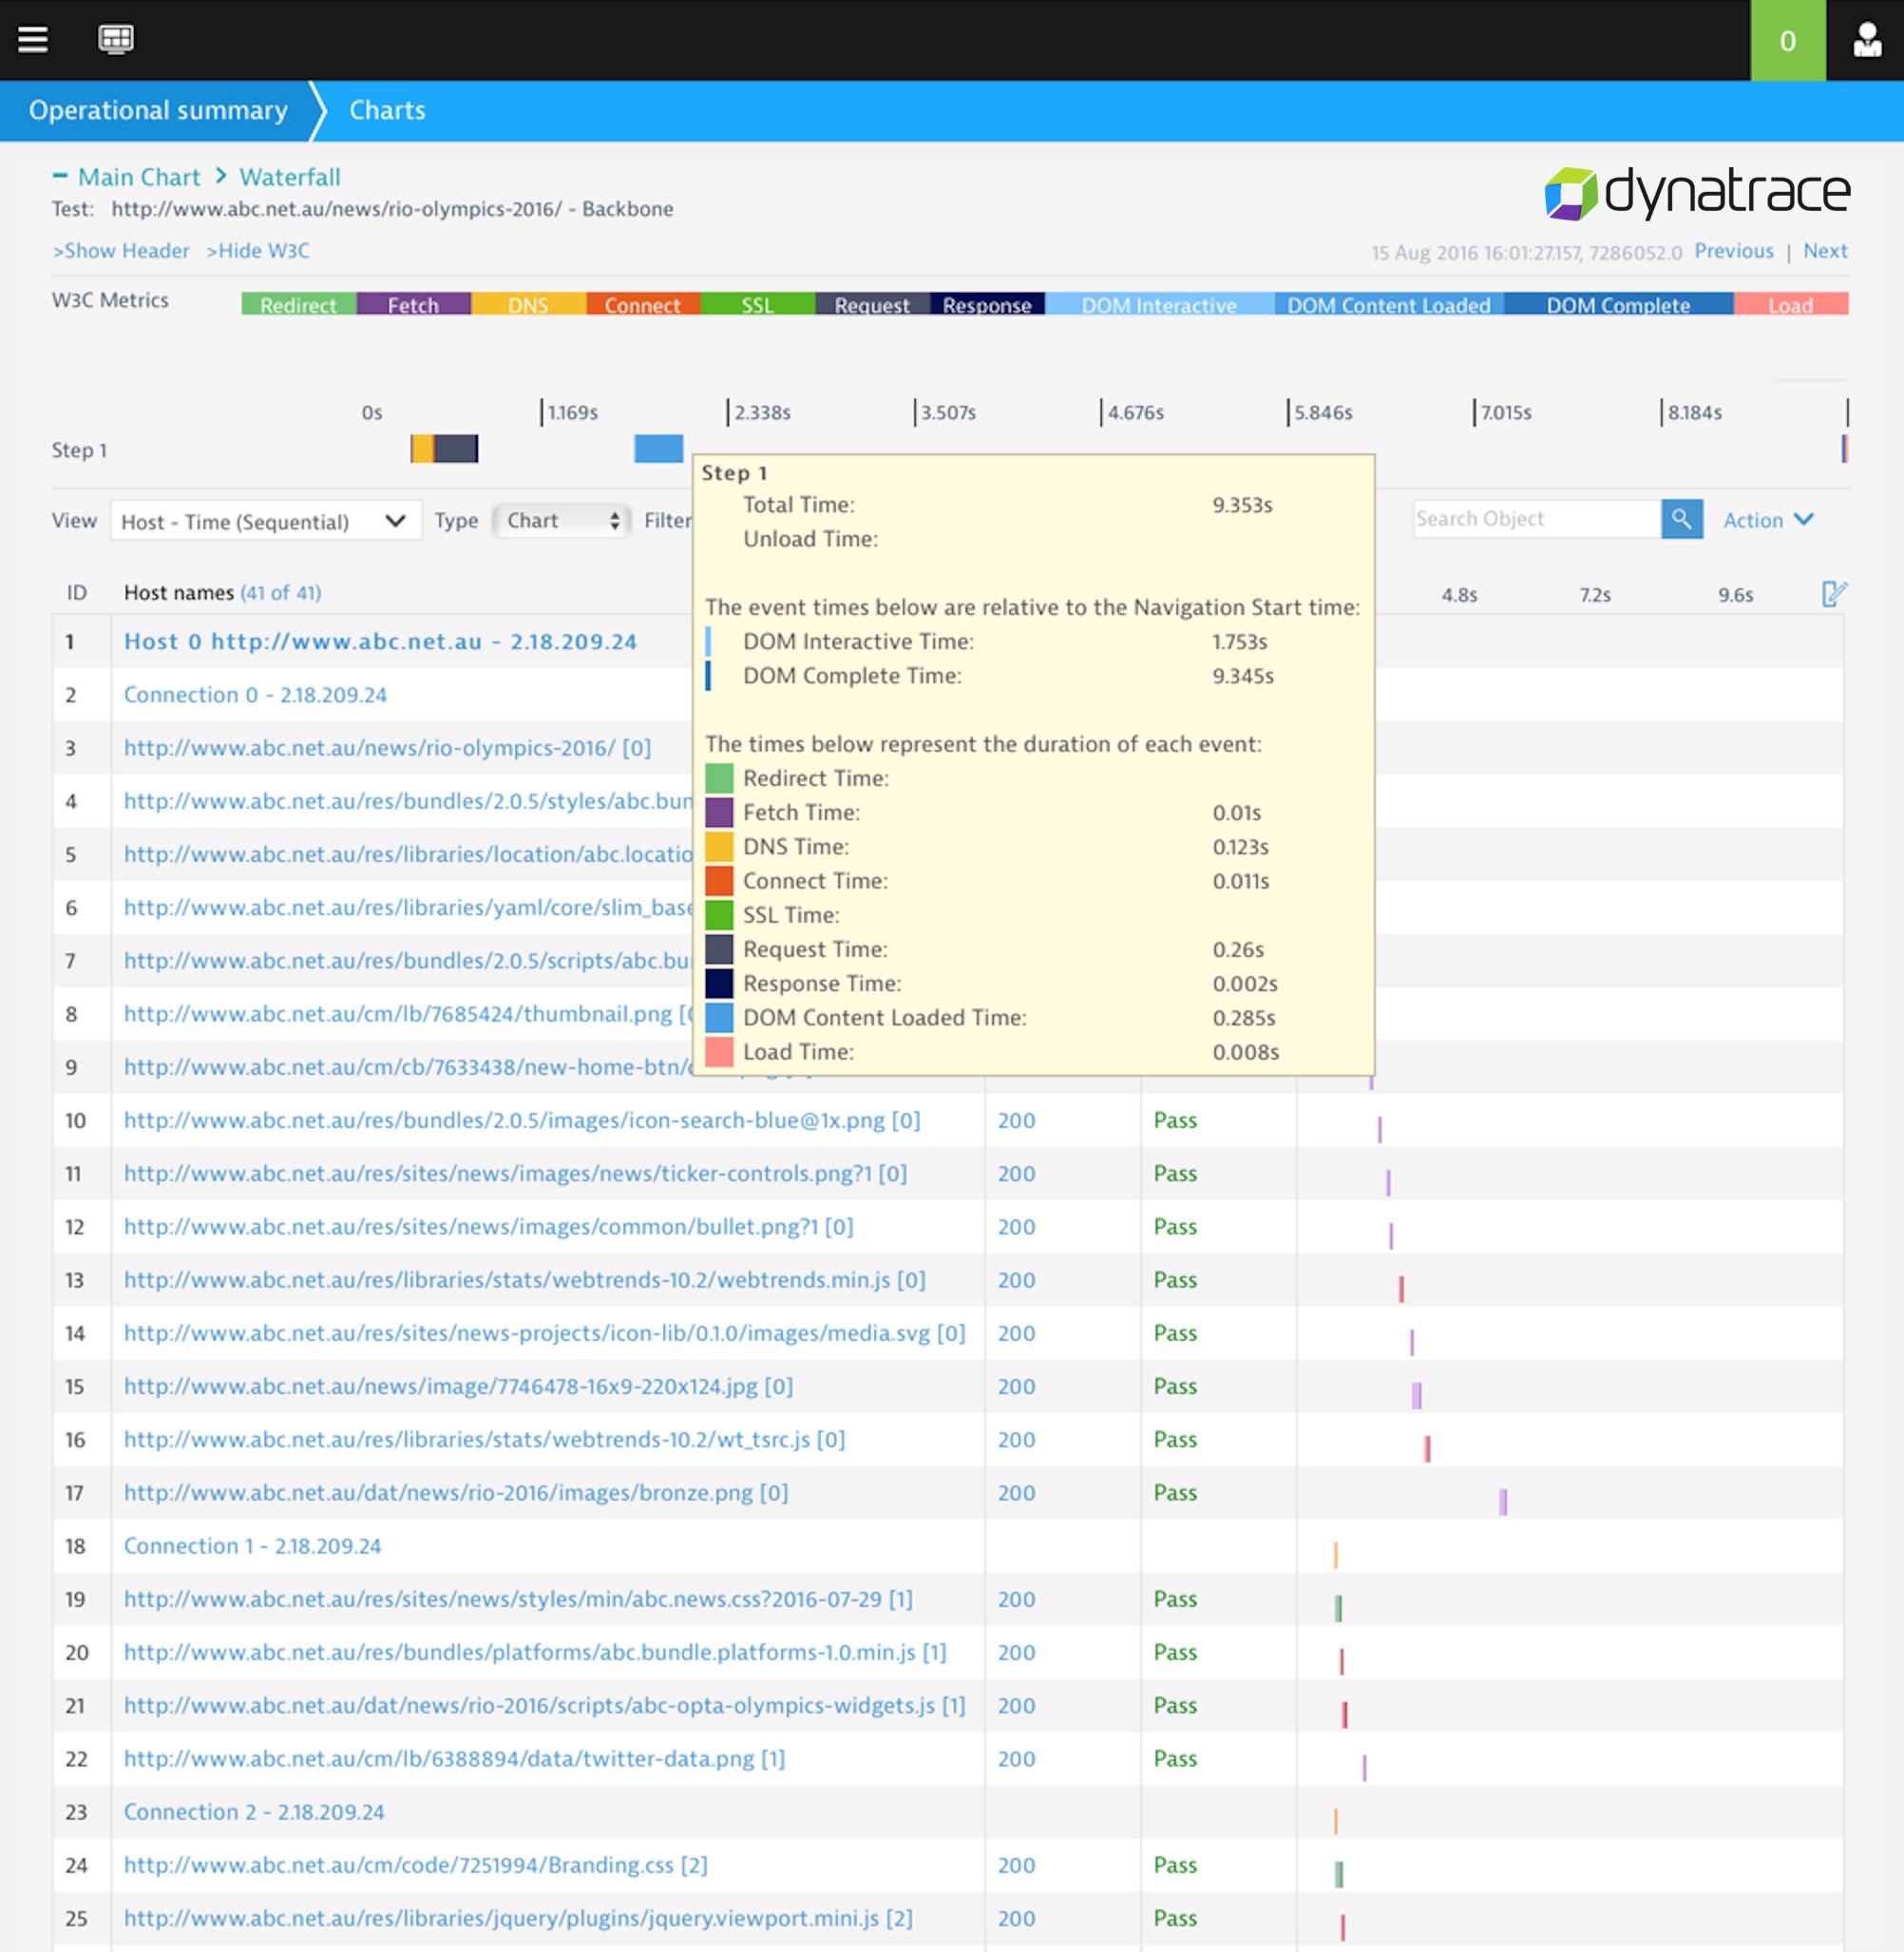
But as the page grows in size we see (below) that every time the page is loaded with a cleared cache there are over 400 round trip requests being made by the browser and over 80 network connections being opened. That is a lot of network activity.
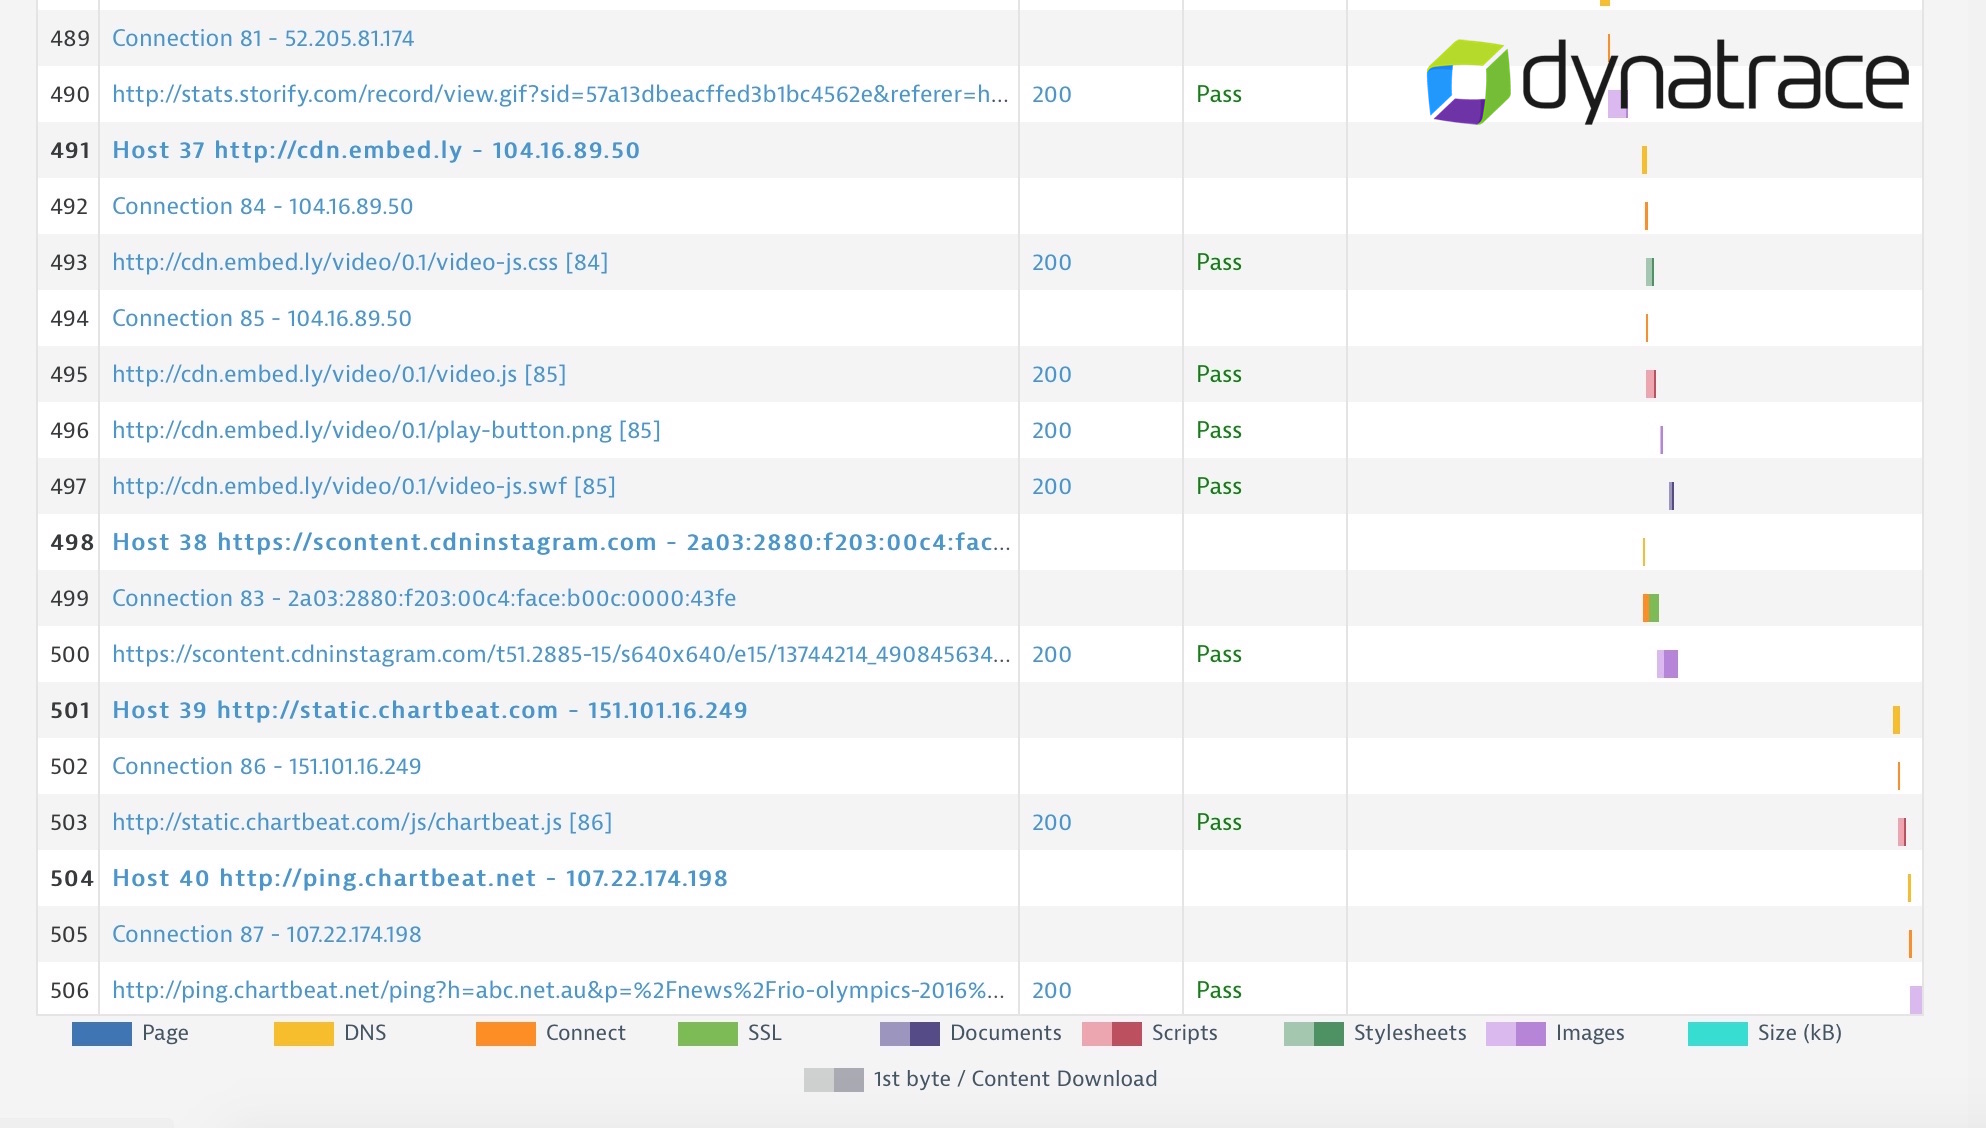
ABC is utilizing a lot of third party content on their site. Third parties introduce complexity, and as we can see here they need to be managed as they can impact performance and end user experience.
Join us next time as we take a closer look at how Social Media websites performed during the Olympic Games overall. Who were the winners, and who has work to do before PyeongChang 2018.
Update: 6:00 pm August 16, 2016 by Andre’ Chagnon
The Dynatrace Rio Report — View of Top Global Brands
In our next installment of the Dynatrace Rio Report, we see how global consumer brands are heating up midway through the Olympic Games.
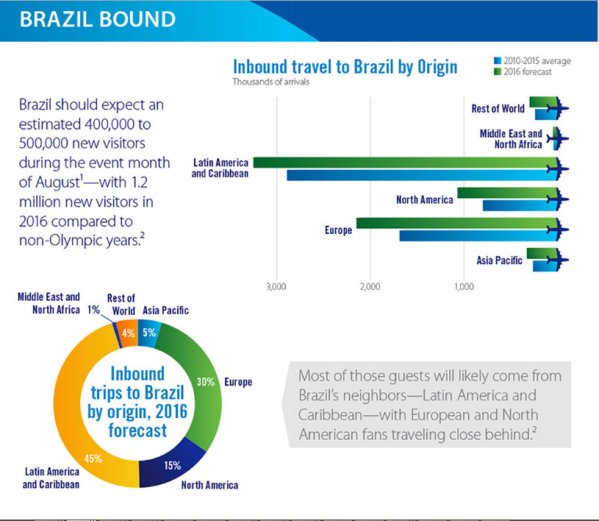
In the global comparison below, which looks at DACH, EMEA, FR, UK, and the U.S., we see how overall, Brazil is expecting an estimated half a million new visitors to the country. The insights below comes from Visa, which leveraged the UK’s Office of National Statistics.
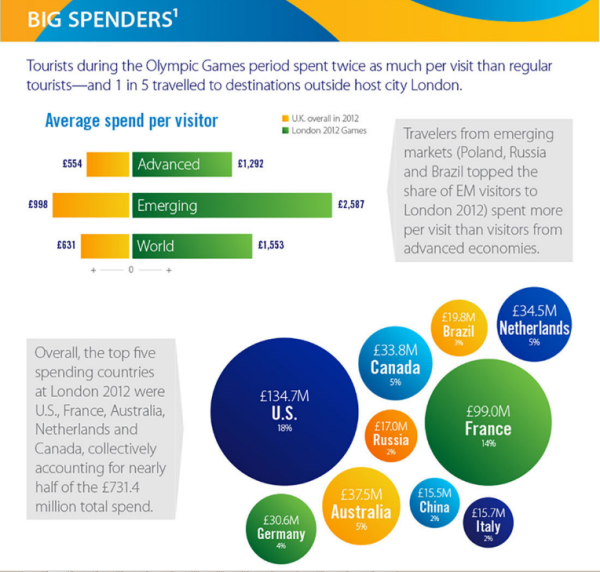
Global brands like Visa are conducting analyses to try to predict and prepare for consumer spending in Rio De Janeiro, Brazil during the Olympics. Taking a look at spending habits based on past trends in the London games has helped with planning for the Rio 2016 Olympics.
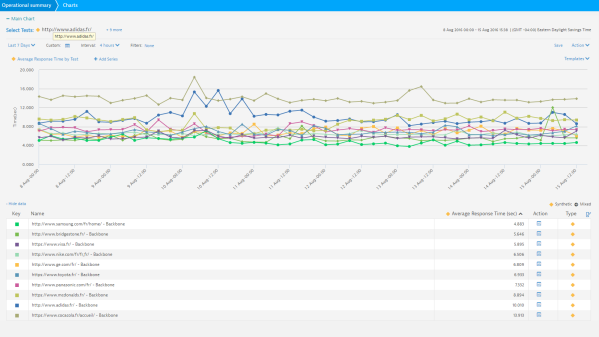
In this comparison of top consumer brands, we looked across 60 sites across the globe to see how they compare from outside Brazil, as well as their performance from within Brazil. The requirements to get into the finals were that the sites needed to have under a six second response time and be from a global consumer brand. Only a max of three sites from each category would be able to make it to this final gold medal heat.
Here are the top sites we compared from DACH, EMEA, FR, UK, and the U.S.:
| http://www.adecco.be/ | http://www.omega-pharma.be/ |
| http://www.adidas.com/ | http://www.panasonic.com/de/ |
| http://www.adidas.de/ | http://www.panasonic.com/fr/ |
| http://www.adidas.fr/ | http://www.samsung.com/de/home/ |
| http://www.aginsurance.be/ | http://www.samsung.com/fr/home/ |
| http://www.attentia.be/ | http://www.samsung.com/us/ |
| http://www.bridgestone.com/ | http://www.shop.panasonic.com/ |
| http://www.bridgestone.de/ | http://www.sport-adeps.be/ |
| http://www.bridgestone.fr/ | http://www.systemat.com/ |
| http://www.brusselsairport.be/ | http://www.teamusashop.com/Team_USA |
| http://www.coca-cola.com/ | http://www.topsport-vlaanderen.be/ |
| http://www.coca-cola-deutschland.de/ | http://www.toyota.com/ |
| http://www.dfs.co.uk/ | http://www.vbo-feb.be/ |
| http://www.dgsport.be/ | https://edfluminus.edf.com/ |
| http://www.elia.be/ | https://usa.visa.com/ |
| http://www.ey.com/BE/ | https://www.aldi.co.uk/ |
| http://www.famous.be/ | https://www.belfius.be |
| http://www.fitnessfirst.co.uk/ | https://www.brusselsairlines.com/ |
| http://www.flair.be/ | https://www.cocacola.fr/accueil/ |
| http://www.fondsbailletlatour.com/ | https://www.delhaize.be/ |
| http://www.ge.com/ | https://www.eventeam2016.be/ |
| http://www.ge.com/de/ | https://www.loterie-nationale.be/fr |
| http://www.ge.com/fr/ | https://www.mcdonalds.de/ |
| http://www.goudengids.be/ | https://www.mcdonalds.fr/ |
| http://www.kelloggs.co.uk/en_GB/home.html | https://www.muller.co.uk/ |
| http://www.mcdonalds.com/ | https://www.nationale-loterij.be/nl |
| http://www.nike.com/ | https://www.toyota.fr/ |
| http://www.nike.com/de/de_de/ | https://www.visa.de/ |
| http://www.nike.com/fr/fr_fr/ | https://www.visa.fr/ |
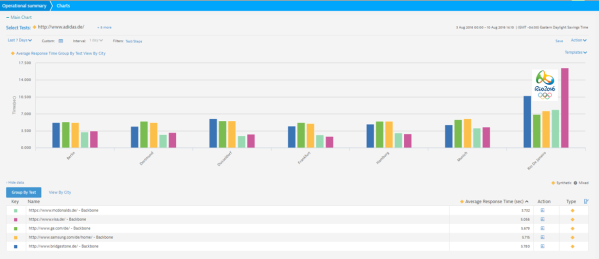
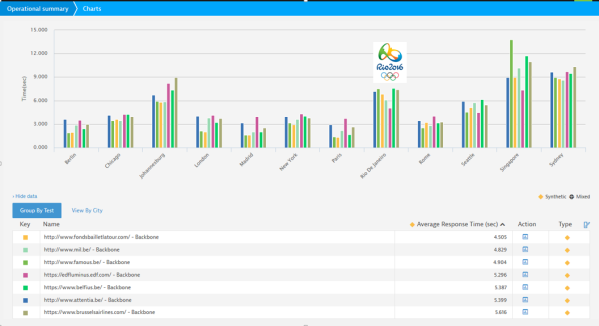
In this post we also decided to take a look at consumer brand sites by geography, comparing the top 2-3 sites from each. To make it fair, we would only compare from within Brazil for this final heat, seeing as all of our athletes are in Rio. Each one of these consumer sites are being monitored from both the country of origin and Brazil. For example, a French site would be monitored from France locations as well as within Brazil.
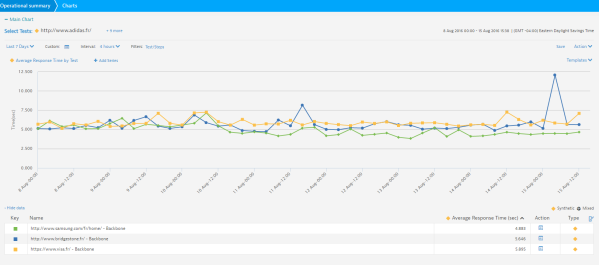
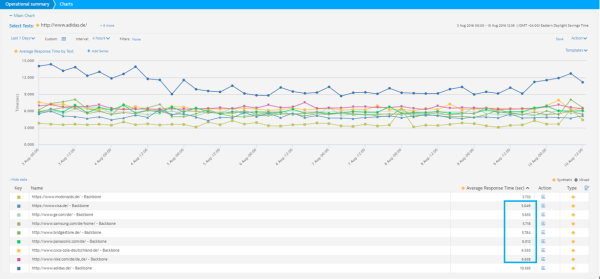
Category: Olympics Consumer Brands DACH – Last 7 Days
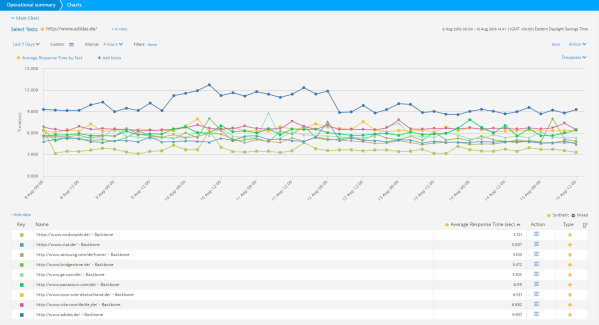
We looked at this first heat of Olympics consumer brands in the DACH category to get us started, and found it was a close battle between five sites to make it to the final heat. This chart above shows that response time averaged between 3.7 and 5.7 seconds over the last seven days for these five sites.
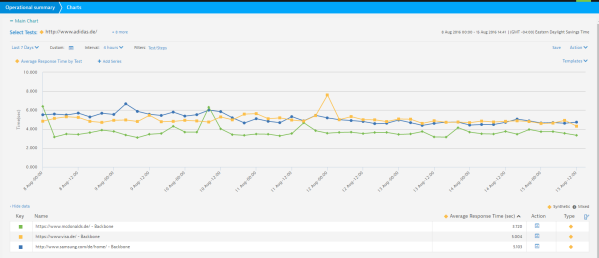
Isolating the top three sites that are heading to the finals, we see McDonalds, Visa and Samsung battling for the tops spots in the DACH heat.
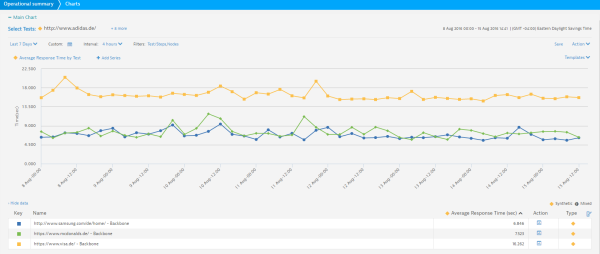
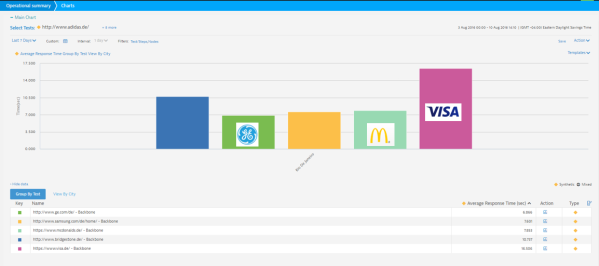
Taking out all of the local German locations and only looking at how well they are performing from Rio, you see a different story. From Rio, these sites are actually 2-3 seconds slower. But all 3 sites advance to the final round.
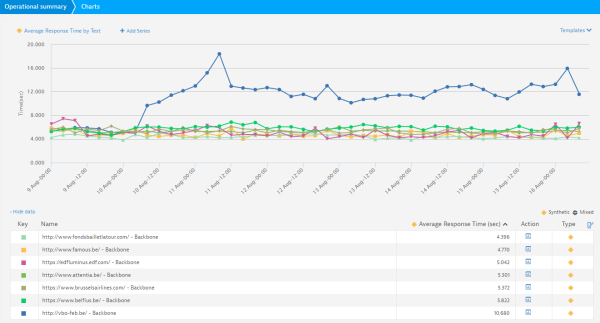
Category: Olympics Consumer Brand – EMEA
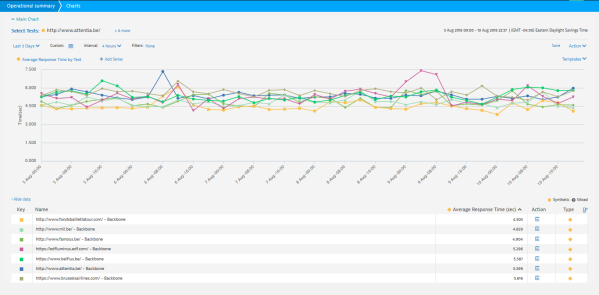
In the category Olympics consumer brands category for EMEA we compared eight sites and saw that there were seven sites that came in under the six-second cutoff. With only three sites able to make the finals, we take a closer look at the top finalist from this category.
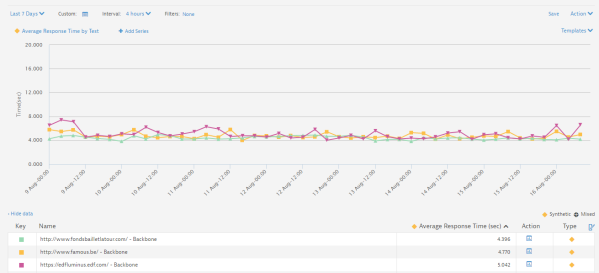
Here are the final three sites for from EMEA for this heat: http://www.fondsbailletlatour.com, http://www.famous.be/ and https://edfluminus.edf.com. Now let’s take a closer look at these three sites from within the host country, Brazil. In this heat less than 0.7 seconds separate the 3 sites.
Isolating the performance of these sites from Rio we see that these top three sites are performing two seconds slower from within Rio. We also see that https://edfluminus.edf.com/ is leading the way with an average response time of 5.14 seconds. Congratulations to the finalists from EMEA!
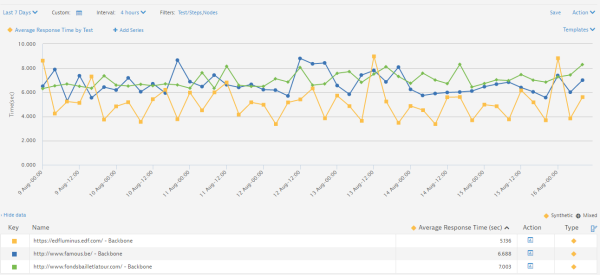
Category: Olympics Consumer Brands – France
In this category we head to France to examine 10 consumer brand sites.
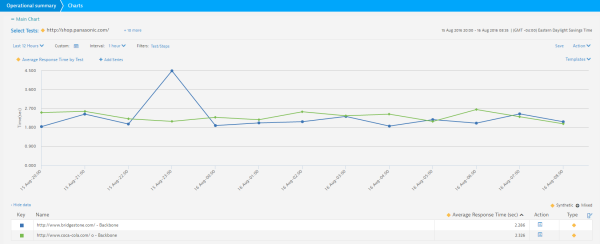
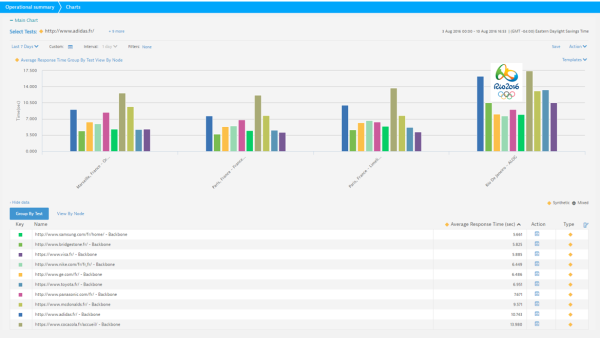
Taking a look at the top three sites, Samsung, Bridgestone and Visa, we see all three are doing a great job in terms of consistency. This chart is based on the three companies in their country locations and Brazil. Locations/ISPs tested include Paris, France – Limelight and Paris, France – France Telecom, Marseille, France – Orange-France Telecom and Rio De Janeiro – ALOG.
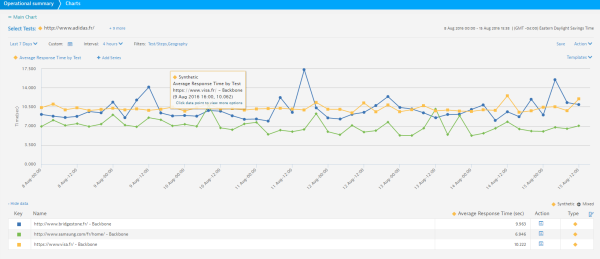
Taking a look at the performance from within Rio we get a very different view of the performance of these sites. We see more variability from hour-to-hour and we also see how response times almost double, with Visa providing the most consistency as shown in the above chart. Samsung, Bridgestone and Visa win this round and are propelled into the final heat.
Category: Consumer Brand – UK
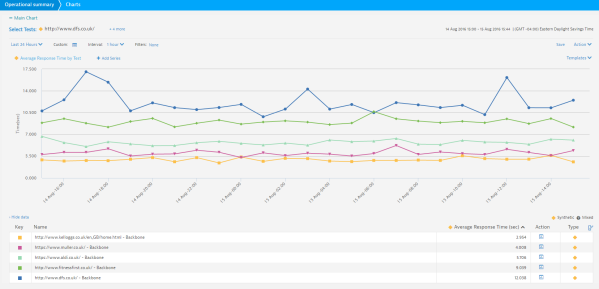
In this category we examined five consumer brands in the UK.
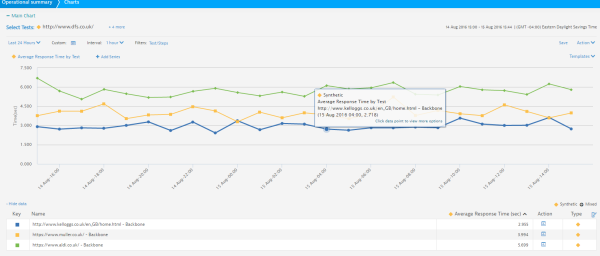
Taking a closer look at the top three you can see how consistent they were, with a mere two seconds separating the top sites from the UK.
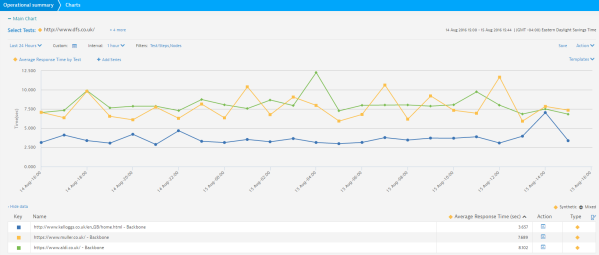
Looking at these sites, Kellog’s, Muller, and Aldi from Rio De Janeiro – ALOG we see Kellog’s crosses the finish line at the forefront of this category.
Category: Olympics Consumer Brands – USA
In the final category we see Bridgestone, Coca-Cola and Visa, but only the top two make it to this final round, with Bridgestone and Coca-Cola coming in under the six-second mark.
From Rio we see that Bridgestone and Coca-Cola are delivering the same performance, coming in consistently under the three second mark.
Congratulations to all of the finalists for the gold medal round:
Table2
| http://www.aldi.co.uk/ | http://www.mcdonalds.de/ |
| http://www.bridgestone.com/ | http://www.muller.co.uk/ |
| http://www.bridgestone.fr/ | http://www.samsung.com/de/home/ |
| http://www.coca-cola.com/ | http://www.samsung.com/fr/home/ |
| http://www.famous.be/ | http://www.usa.visa.com/ |
| http://www.fondsbailletlatour.com/ | http://www.visa.de/ |
| http://www.kelloggs.co.uk/en_GB/home.html | http://www.visa.fr/ |
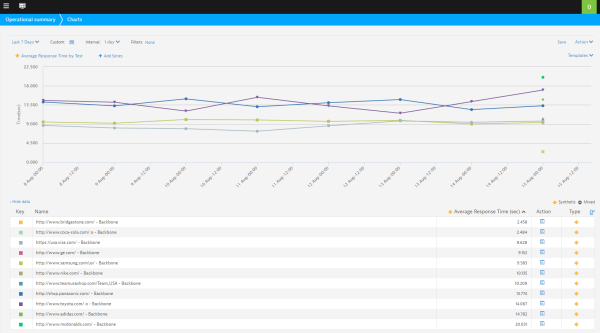
Here is a look at 14 finalists in the global consumer category that made the final heat from the DACH, EMEA, France, UK and USA.
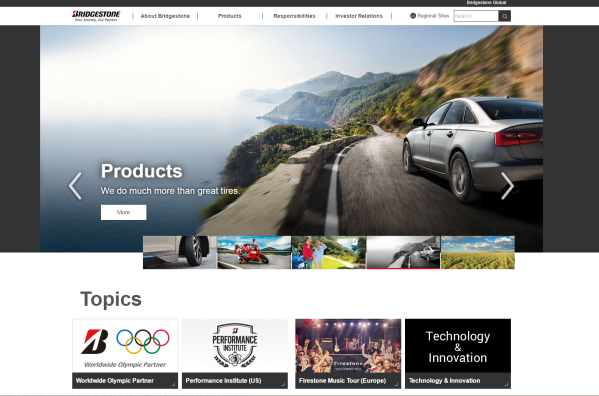
Examining these top 14 finalists for this gold medal heat, we find some brilliant performances from Bridgestone USA, edging out Coca-Cola USA by only 0.210 seconds to capture the gold. We also see the Kellog’s UK site capturing the bronze 0.5 seconds ahead of McDonalds.de.
And the gold goes to: Bridgestone.com Team USA
And the silver goes to: Coca-Cola Team USA
And the bronze goes to: Kellogg’s Team UK
Congrats to the all of the finalist and the winners.
Lastly, Visa gets a notable mention for topping three out of the five consumer brand categories that made the final gold medal heat. This is perfect timing considering Visa announced how they are providing new technologies to help with the consumer spending throughout Rio.
“Visa also extends the value of its sponsorship to Olympic Games host cities, facilitating the development and advancement of payment infrastructure in those markets. This year Visa will introduce acceptance of new technologies and innovation throughout Rio, focusing on new ways to pay including payment wearables and mobile phones – letting fans swipe, tap, dip or click to pay in Rio.” Source: Businesswire
Congratulations to Visa:
Join us for our next installment of the Dynatrace Rio Report, when all eyes will be on APAC.
Update: 12:00 pm August 15, 2016 by David Jones
The Dynatrace Rio Report – Carrier/ISP Performance Update
In our sixth installment of the Dynatrace Rio Report, we took a deep dive into the performance of network and carrier companies. Half way through the 2016 Olympics, we are pleased to see that Brazil’s networks are holding up. While there have been isolated incidents like this tweet:

Which points to this video clip…

…for the most part, things are holding up well for Brazil’s digital infrastructure. However if you listen to that video, you can hear what anguish from end users sounds, such as when there is an internet performance hiccup.
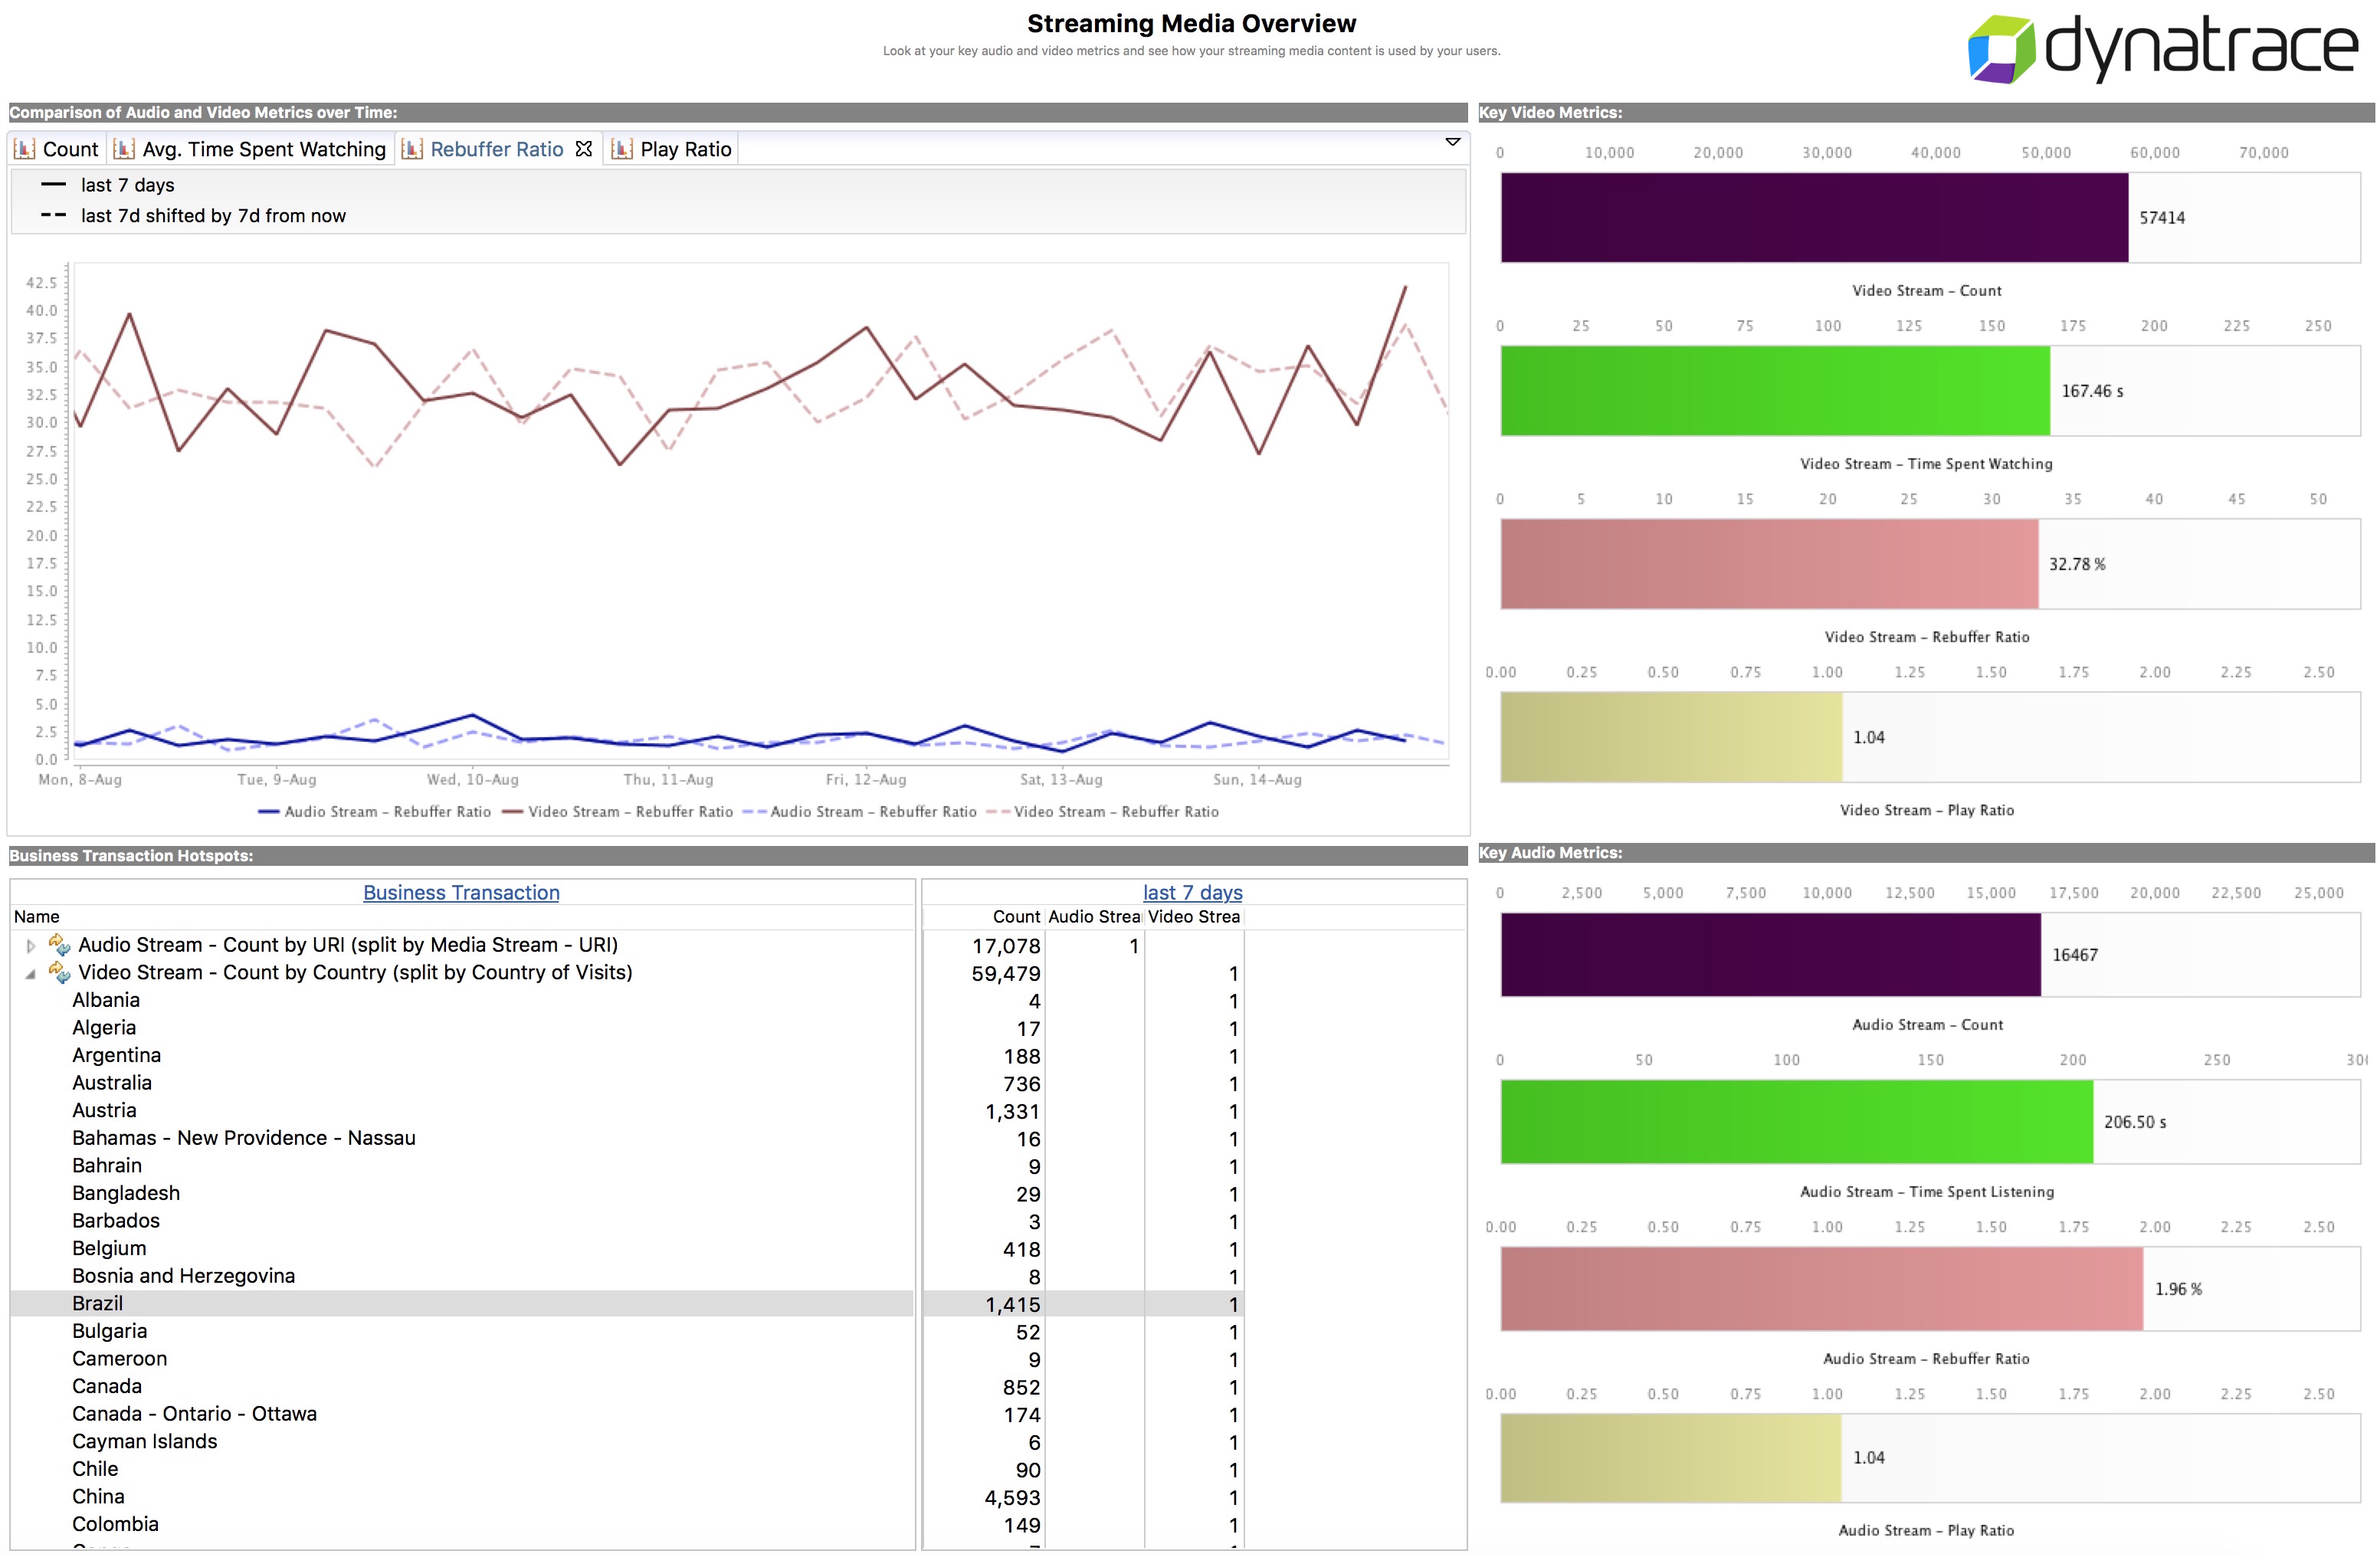
By using user experience management tools, companies providing streamed video content during the Olympics can monitor how end users are experiencing stream content. They can track what is being watched, how long users are watching and, like the case above, when end users are experience re-buffering issues. Here is an example of what one of these dashboards might look like:
Streaming content is complicated and network performance can directly impact the quality of the video being seen by end users. We took a look at the performance of various carriers in Brazil. These results are from the Dynatrace Synthetic Network based on measuring results from ALOG and Level3 in Brazil to each of the carriers shown.
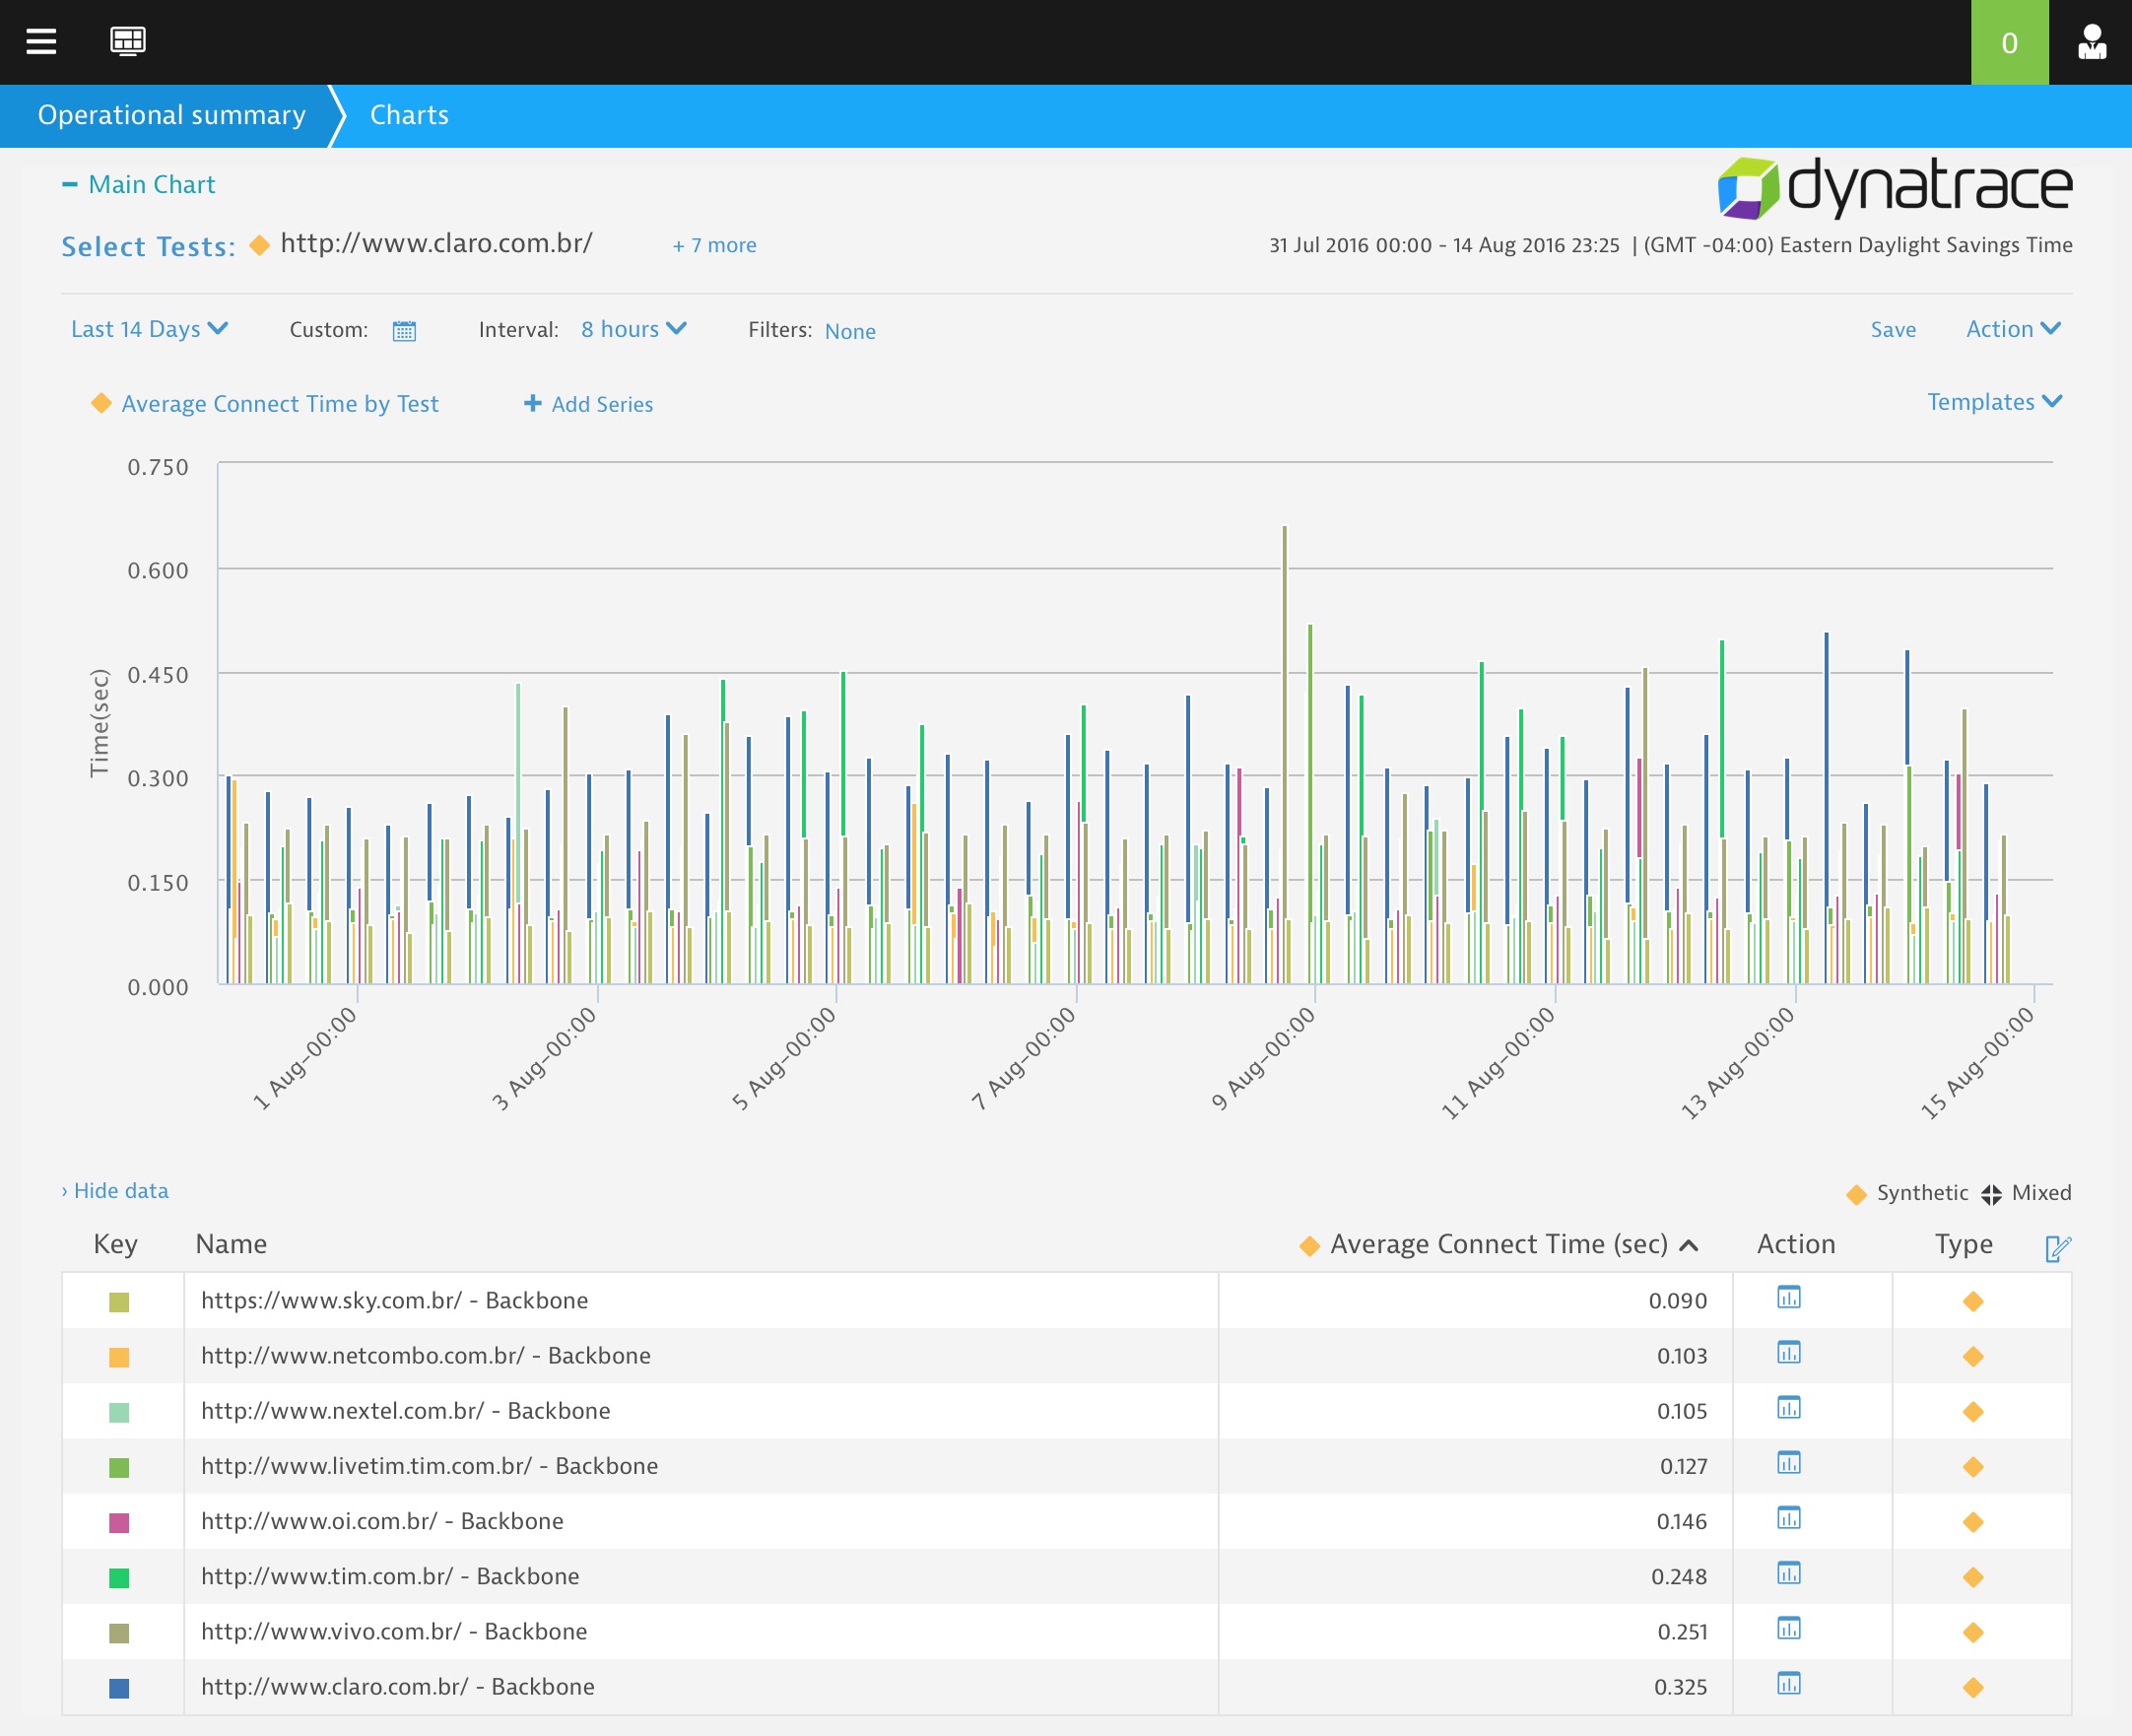
The results are based on network connectivity (we use TCP Connect time as an indicator of network speed), but we also looked at measured throughput in terms of Kbps (Kilobits per second) below.
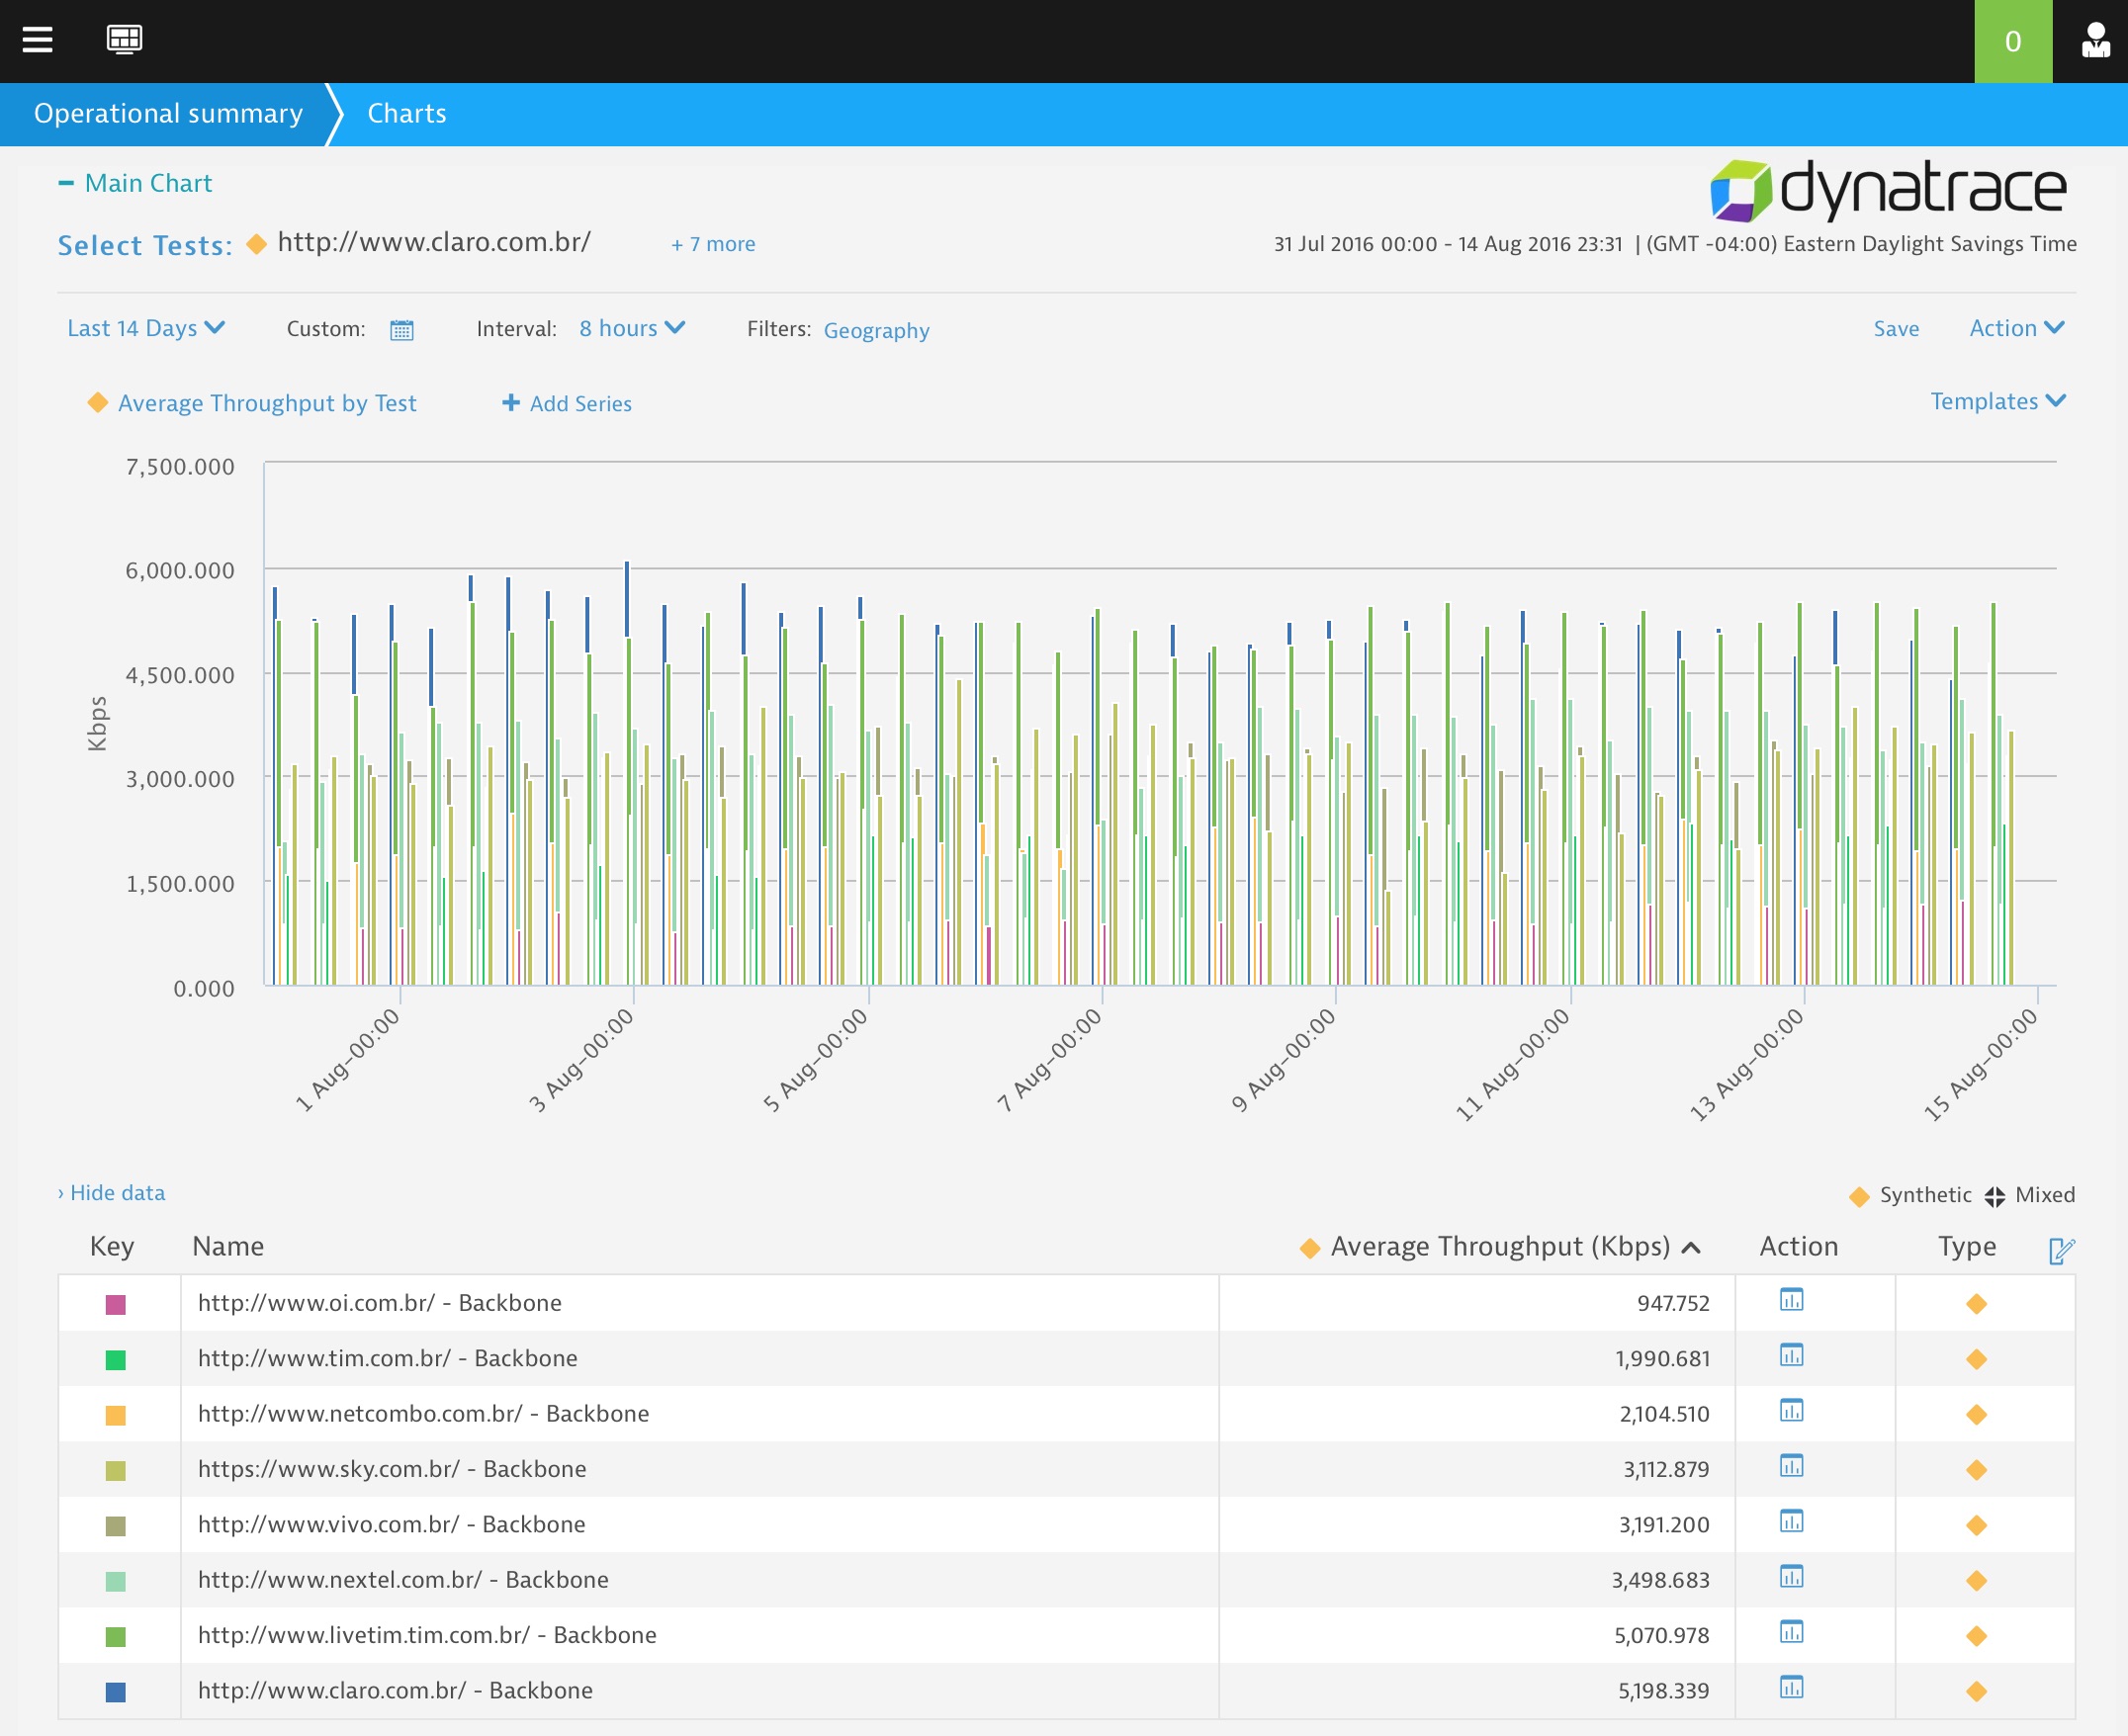
Both the speed with which connections/round trips are made and throughput are indicators as to the ability of a carrier to provide quality streamed content.
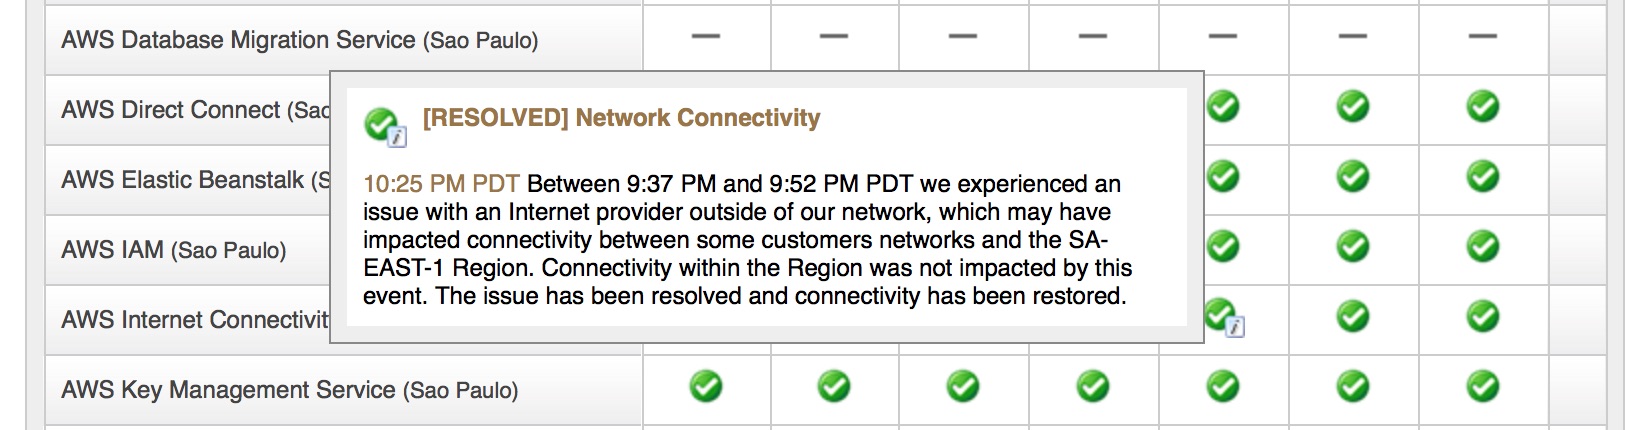
Just to look beyond the Dynatrace Network data in terms of overall heath we also looked to Amazon (no not the jungle — see what I did there?). Amazon’s own health status pointed to only one brief issue with network connectivity in the past couple of weeks which was quickly resolved.
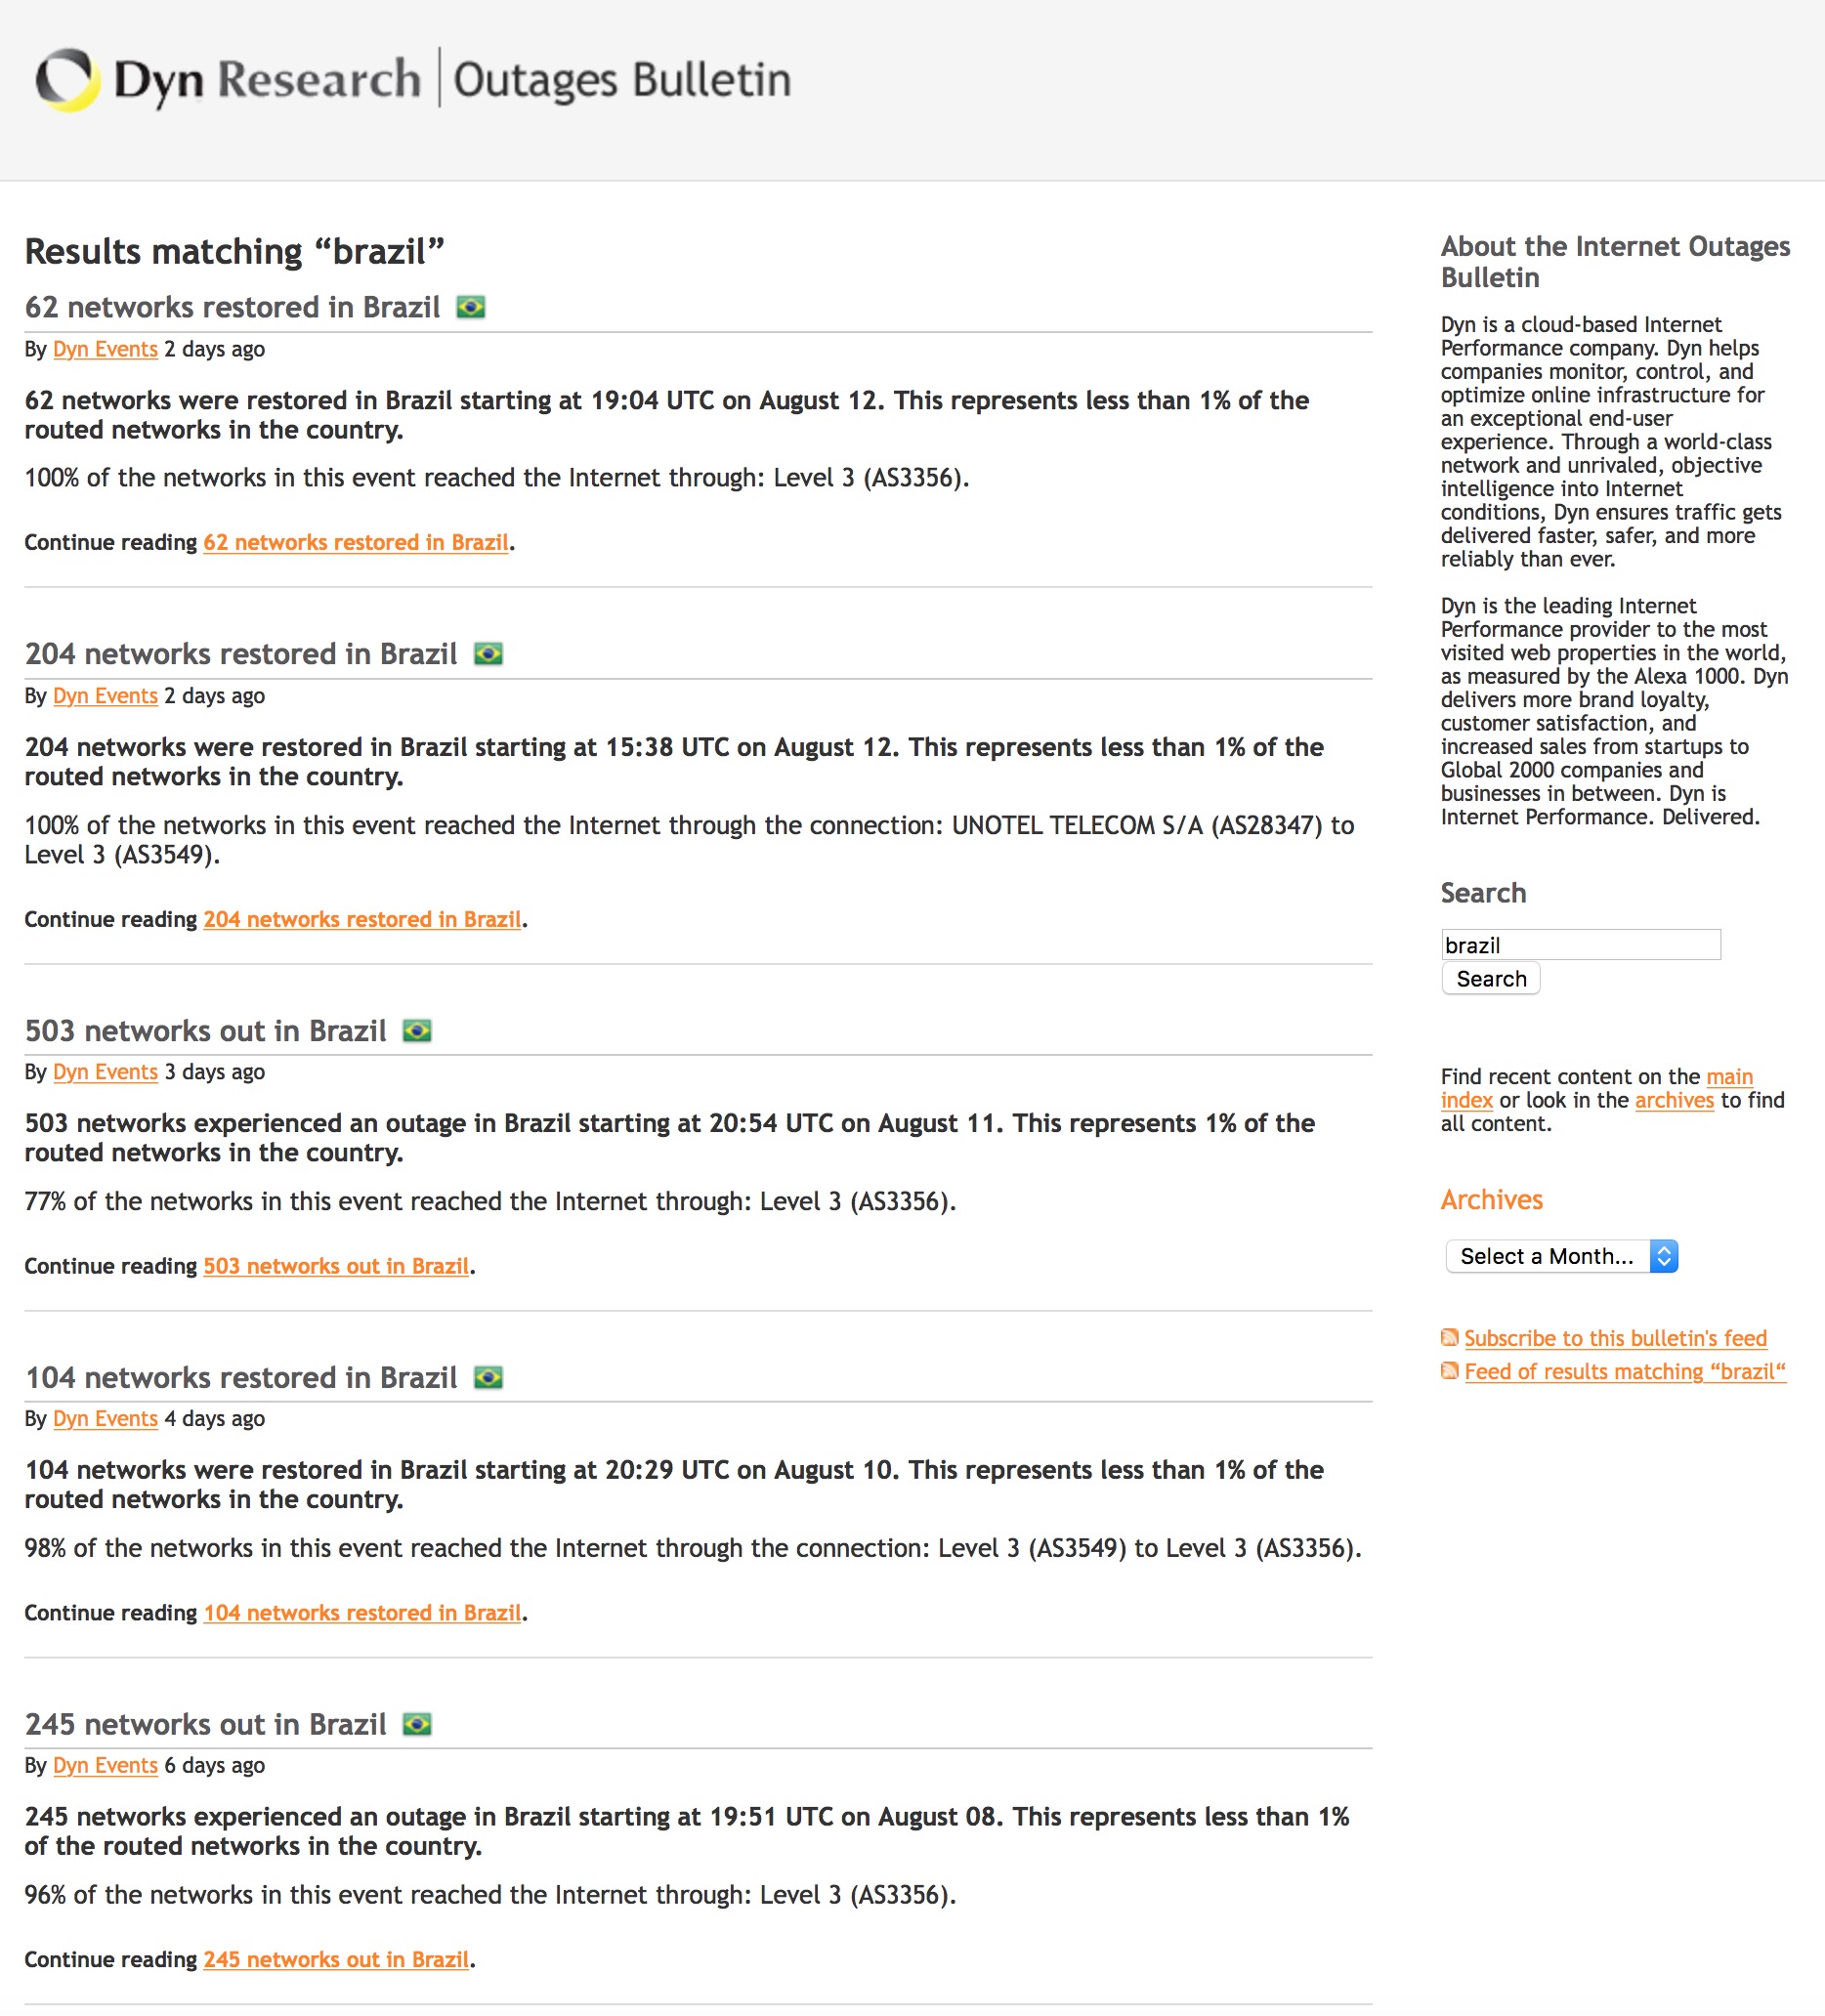
Network monitoring company DYN reported more issues which have all been quickly resolved.
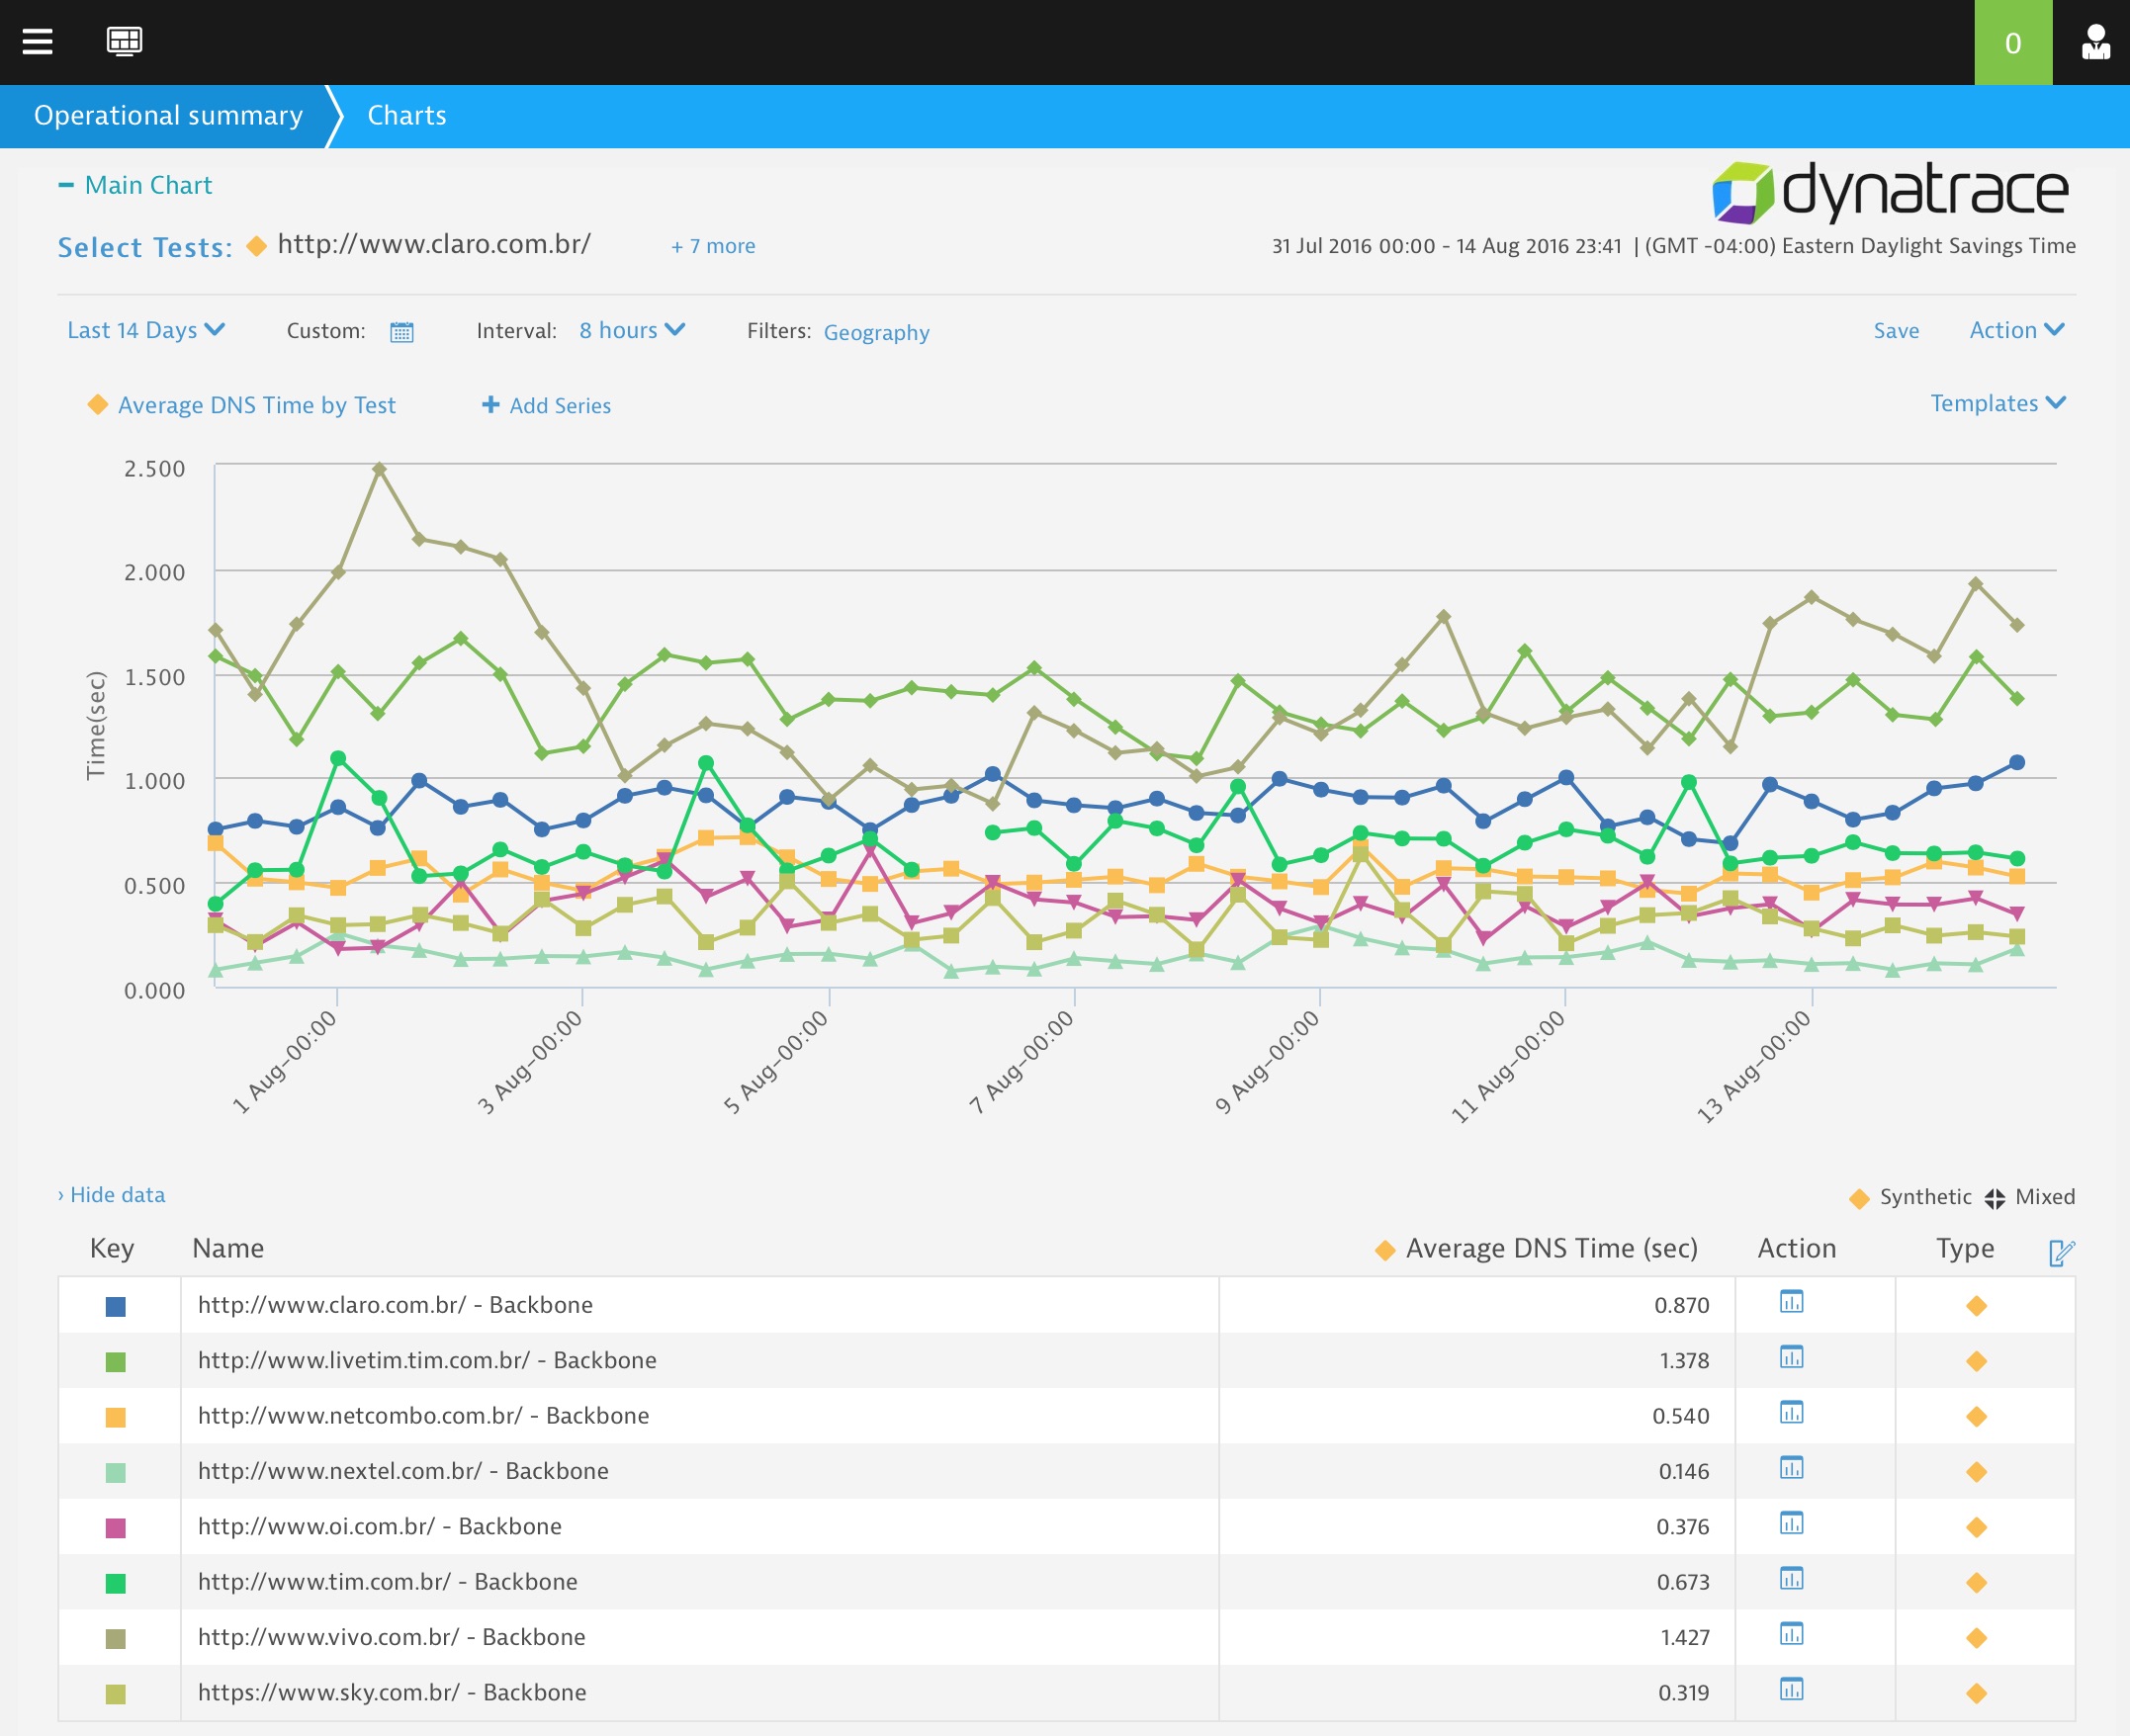
The Dynatrace Synthetic Network found that DNS performance has been consistent for some carriers and less so for others.
So now that we’ve looked at how the telecom carriers in Brazil are holding up, let’s change gears and look at a different event, how different countries are stacking up.
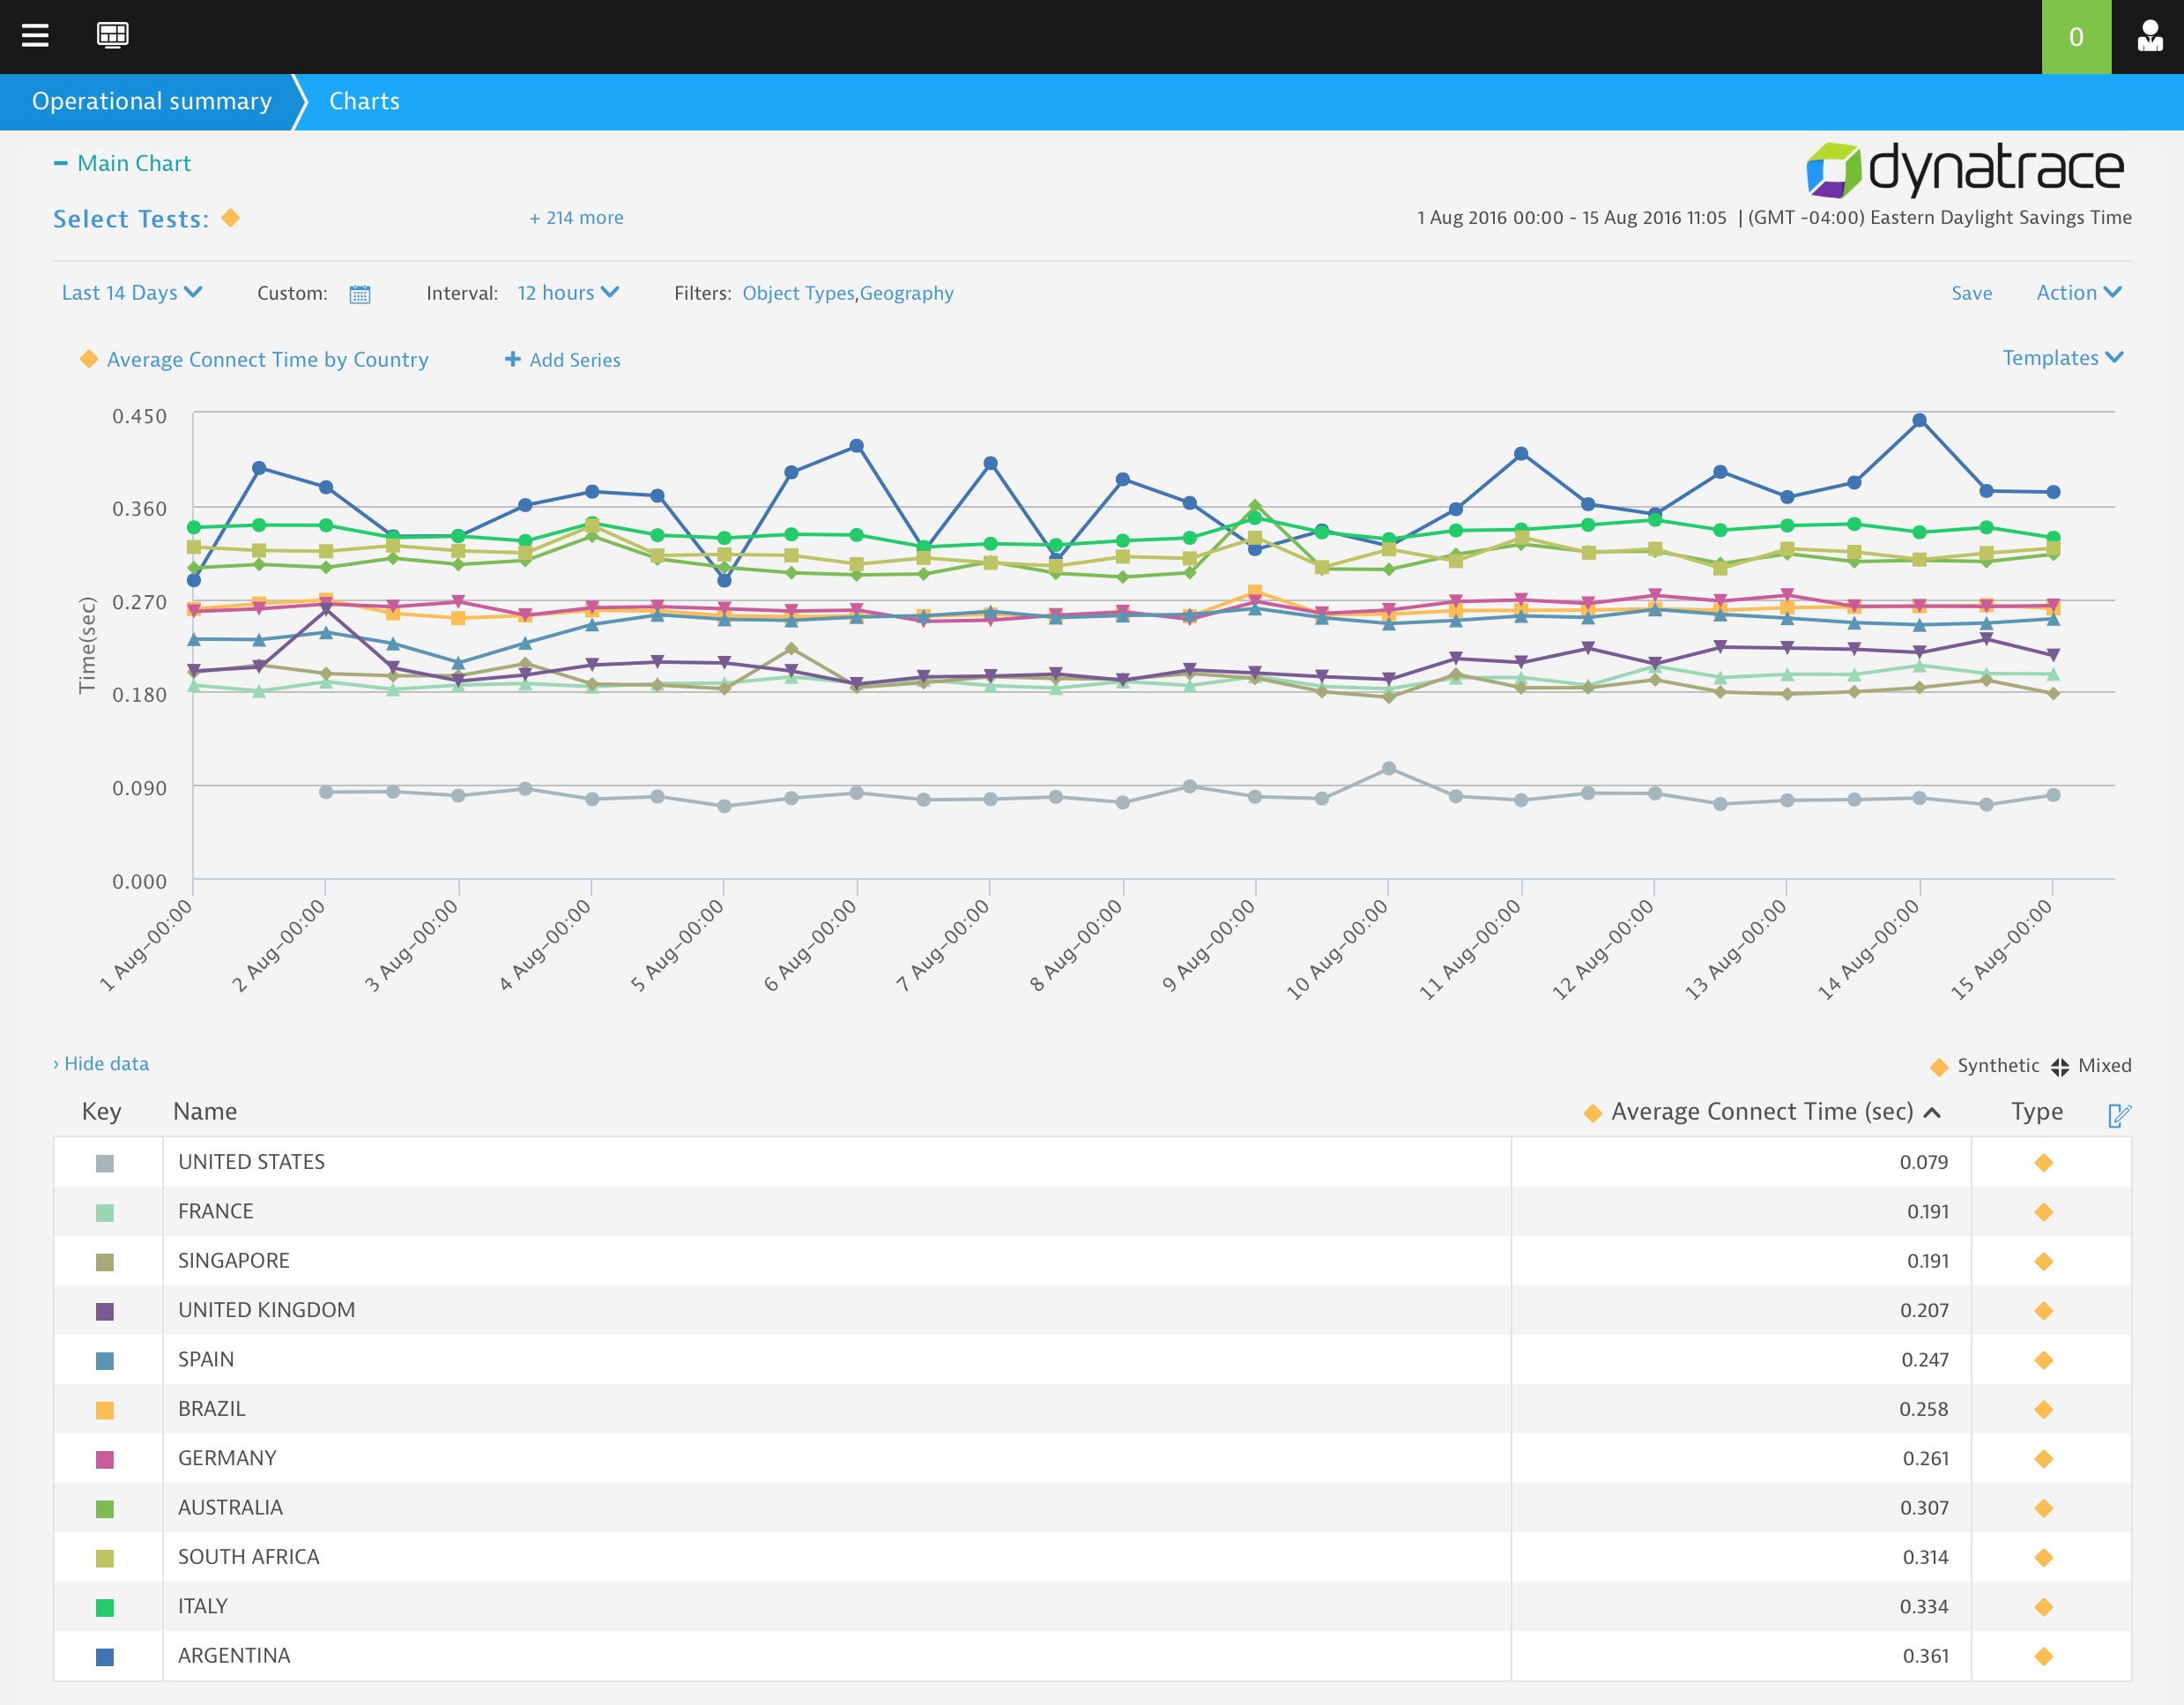
And the gold medal goes to: USA! Based on monitoring over 200 Olympic related websites from the Dynatrace Synthetic Network over the past two weeks (this represents hundreds of thousands network requests) we see that from the average connection time point of view, the USA is showing some of the fastest network times, followed by France and Singapore.
Keep checking back for more Olympic web performance updates from the Dynatrace team as we continue to see how businesses and countries stack up. Hopefully they, like the Olympic athletes, continue to finish strong.
Update: 6:00 pm August 11, 2016 by Andre’ Chagnon
The Dynatrace Rio Report – All Eyes on South America and Italy
The Olympic Games may be about halfway through, but our coverage of the Rio report is just heating up. In our fifth installment, we will be focusing on South American and Italian websites to see which ones are loading pronto, and which ones have some work to do for next time.
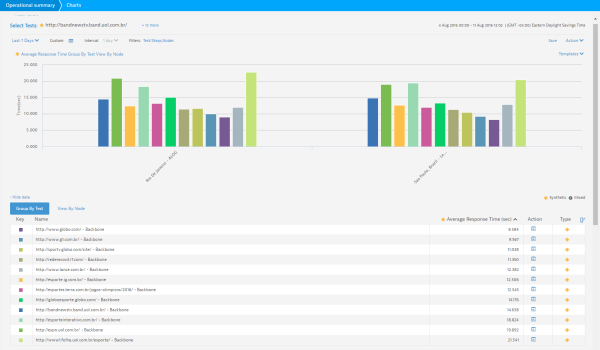
This first category takes us into South America and to examine Olympic media in LATM. Below are the sites we tested in this category, in the following locations: Rio De Janeiro, Buenos Aires, Sao Paulo.
- http://bandnewstv.band.uol.com.br/
- http://espn.uol.com.br/
- http://esporte.ig.com.br
- http://esporteinterativo.com.br/
- http://esportes.terra.com.br/jogos-olimpicos/2016/
- http://globoesporte.globo.com/
- http://rederecord.r7.com/
- http://sportv.globo.com/site/
- http://www.g1.com.br/
- http://www.globo.com/
- http://www.lance.com.br/
- http://www1.folha.uol.com.br/esporte/
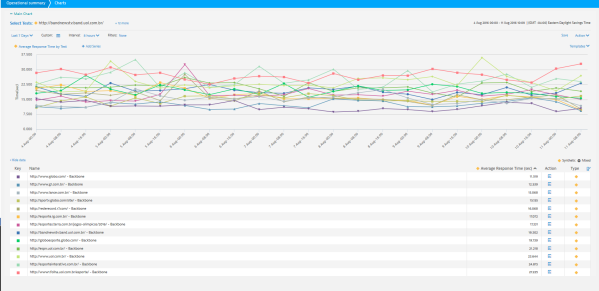
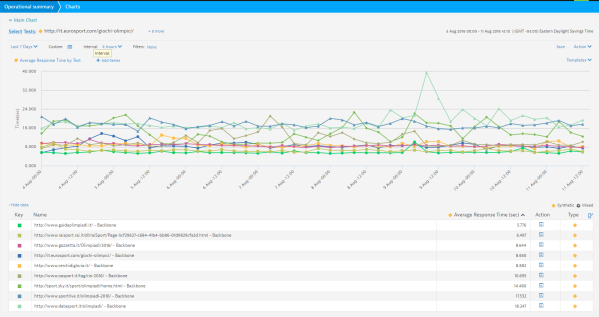
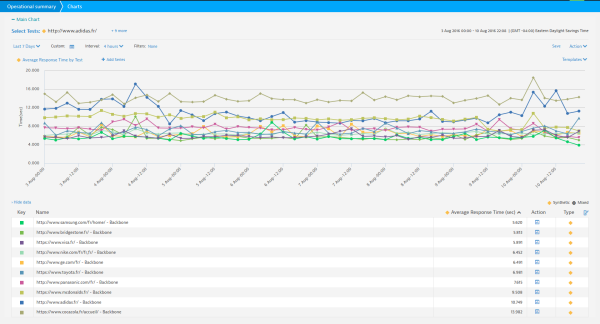
The top two sites in this category have separated themselves from the pack and are performing, on average, three seconds faster across the three locations we are testing from Rio De Janeiro,
Buenos Aires, and Sao Paulo. The next two sites are neck-and-neck, with the slimmest of margins separating second and third place — 15.068 and 15.155 – for a net difference of 0.087 seconds over the last seven days.
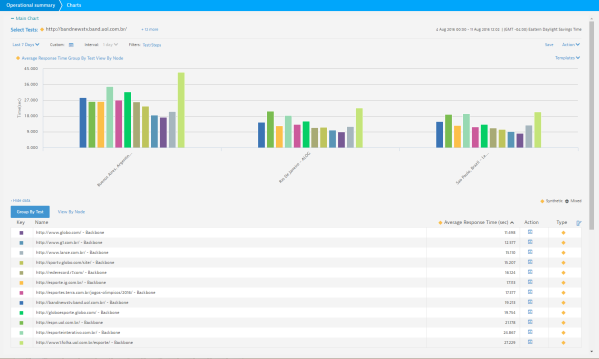
This charts looks at the performance charted by locations from Buenos Aires, Rio De Janeiro, and Sao Paulo. Notice the performance of first place Globo.com, which comes in at 11.50 seconds for average response time. They are the purple bar in the charts above and they are performing best in all three locations.
Looking at this view, we removed the Buenos Aires location and compared the performance from only the Brazilian locations. And the gold medal goes to: https://www.globo.com/

The next category takes us to Olympics sports websites in LATM, where we compared four websites, below, in Rio De Janeiro, Buenos Aires, and Sao Paulo:
Sites:
- http://www.brasil2016.gov.br/pt-br
- http://www.cob.org.br/
- http://www.en.lojario2016.com.br/
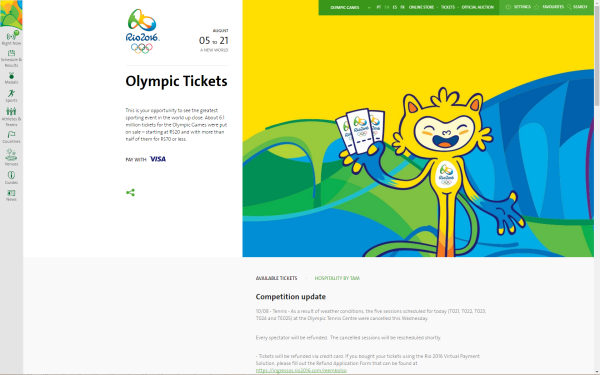
- https://www.rio2016.com/en/tickets
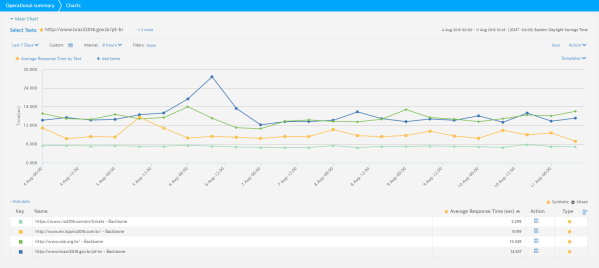
In the chart above you can see how consistent the first place site https://www.rio2016.com/en/tickets is, performing nearly four seconds faster than the second site over the last seven days.
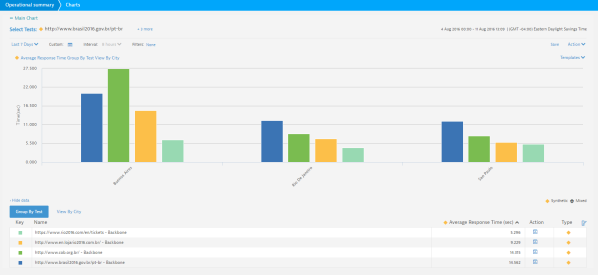
Looking at the three locations we tested in this category you can see how dominant https://www.rio2016.com/en/tickets in all three locations from Rio De Janeiro, Buenos Aires, and Sao Paulo.
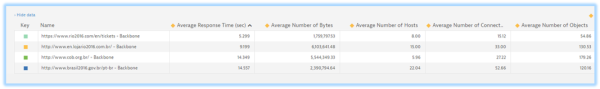
The above charts shows us an inside view at the key areas in which https://www.rio2016.com/en/tickets excelled, propelling them to win a gold medal in this category.
And the gold medal goes to: https://www.rio2016.com/en/tickets
Our next category takes us to Olympics sports media in Italy, where we compared the nine sites below from Rio De Janeiro, Milan and Rome.
Sites:
- http://it.eurosport.com/giochi-olimpici/
- http://sport.sky.it/sport/olimpiadi/home.html
- http://www.cerchidigloria.it/
- http://www.datasport.it/olimpiadi/
- http://www.gazzetta.it/Olimpiadi/2016/
- http://www.guidaolimpiadi.it/
- http://www.oasport.it/tag/rio-2016/
- http://www.raisport.rai.it/dl/raiSport/Page-5cf29627-c684-41b4-bb86-01d9829cfa3d.html
- http://www.sportlive.it/olimpiadi-2016/
In this category the top two sites were within one second of each other, with http://www.guidaolimpiadi.it/ coming in at 5.78 seconds and http://www.raisport.rai.it coming in at 6.50 seconds. Third and fourth place were a mere 0.06 seconds apart, which is incredible when monitoring for seven days and averaged over three locations (Rio De Janeiro, Milan, and Rome).
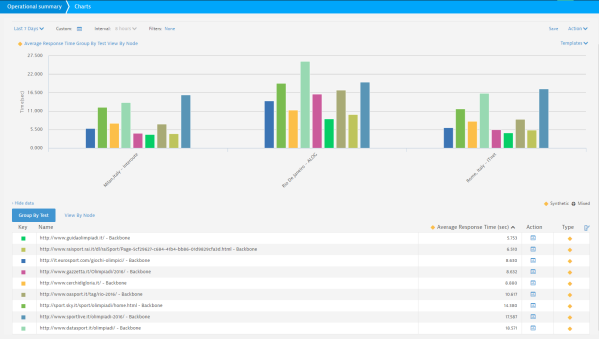
And the winner is: http://www.guidaolimpiadi.it/ which takes the gold with the fastest response time of 5.776 in the Olympic sports media category – Italy.
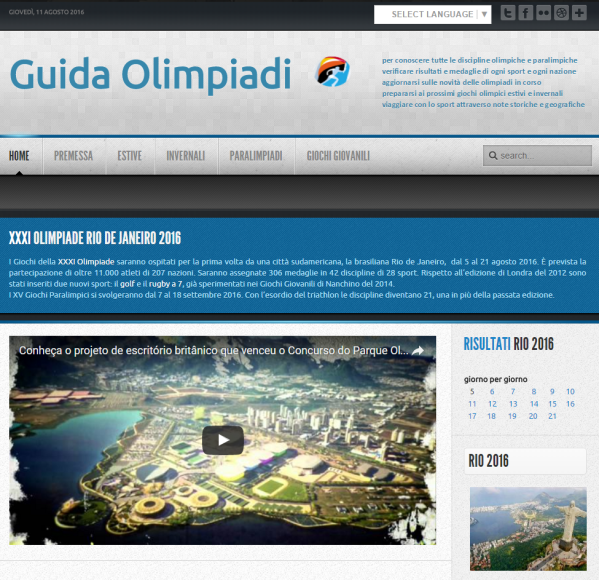
Above is a screen shot of the gold medal finisher in the category: Olympics Sports Media, Italy: http://www.guidaolimpiadi.it/
As you can see, shaving off a just few seconds in response time can go a long way when it comes to accessing these Olympics websites.
Join us next time as we take a global look at Telco’s and carriers to see how they rank in the big leagues.
Update: 6:00 pm August 10, 2016 by Andre’ Chagnon
The Dynatrace Rio Report – Consumer Favorites from Around the Globe
In our fourth installment of the Rio Report, we took a look at top international consumer brands to see how each of their websites have been performing during the Olympics. When it comes to serving up content from the world’s top consumer brands, such as fast food and major device companies, how long should a customer have to wait?
In the international consumer brand category we compared the below sites from the following regions: DACH, EMEA and France.
- http://www.adidas.de
- http://www.bridgestone.de/
- http://www.coca-cola-deutschland.de/
- http://www.ge.com/de/
- http://www.nike.com/de/de_de/
- http://www.panasonic.com/de/
- http://www.samsung.com/de/home/
- https://www.mcdonalds.de/
- https://www.visa.de/
Category: International Consumer Brand DACH (Frankfurt, Munich, Dusseldorf, Dortmund, Hamburg, Berlin; Rio De Janeiro)
McDonald’s was the clear winner in this category coming in with a 3.73-second response time over the last seven days.. The competition for second and third place was tight, with all websites coming in between five and seven seconds. This testing was conducted looking at regions within Germany and Brazil.
In the international consumer brand category for DACH, McDonalds’ golden arches lived up to their name, receiving a gold medal for performance for a stellar 3.7 second-average response time. Coming in second and taking home the silver was Visa, with the bronze proudly granted to GE. Notable sites in fourth and fifth place were Samsung and Bridgestone, respectively.
Narrowing down the view to the top five finishers above, we can see how each are performing within Germany and Brazil. When just focusing on Brazil (below), we see a different view. Interestingly, Visa would have come in first place overall if they would have performed better from within Brazil, but across all of the German locations they were neck-and-neck with McDonald’s.
Within Brazil, Visa went from an average response time of roughly three seconds to over 15 seconds – a likely result of German fans accessing their online Visa accounts from within Brazil. This begs the question: How long should a loyal customer wait for a consumer site?
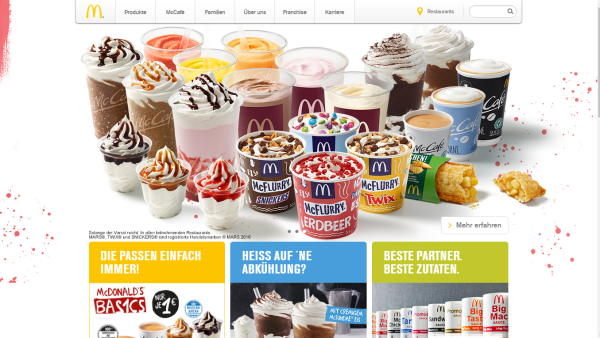
Above you will see the gold medal winner for the international consumer brand category, DACH: McDonalds.de. It’s fitting that the McDonalds.de site would be the fastest in this category as the “I’m Lovin’ It” slogan was developed by the German agency, Heye & Partner. In Munich where the campaign was premiered, the phrase is, “Ich Liebe Es.”
Category: International Consumer Brand EMEA
For EMEA, we examined 23 of the websites below in rhe following locations: Sydney, Australia; Rio De Janeiro; Paris; Seattle, WA; Singapore; Johannesburg, South Africa; Chicago, IL; London,UK; New York, NY; Rome, Italy; Berlin, Germany; Madrid, Spain:
- http://vbo-feb.be/
- http://www.adecco.be/
- http://www.aginsurance.be/
- http://www.attentia.be/
- http://www.brusselsairport.be/
- http://www.dgsport.be/
- http://www.elia.be/
- http://www.ey.com/BE/
- http://www.famous.be/
- http://www.flair.be/
- http://www.fondsbailletlatour.com/
- http://www.goudengids.be/
- http://www.mil.be/
- http://www.omega-pharma.be/
- http://www.sport-adeps.be/
- http://www.systemat.com/
- http://www.topsport-vlaanderen.be/
- https://edfluminus.edf.com/
- https://www.belfius.be/
- https://www.brusselsairlines.com/
- https://www.delhaize.be/
- https://www.eventeam2016.be/
- https://www.loterie-nationale.be/fr
- https://www.nationale-loterij.be/nl
Locations tested from:
Category: International Consumer Brand – EMEA
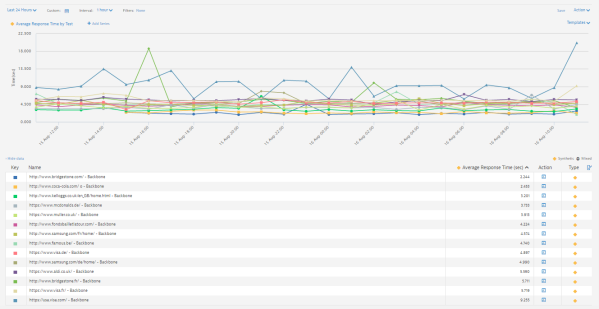
The chart below examines the 23 sites in this comparison. We see a group that is six seconds or faster, another tier at six to eight seconds, and a group that is nine seconds and above.
Narrowing the field we took a closer look at the top eight sites – which all made the cut off under the six second response time mark. These sites were all tested from global locations, including from within Brazil.
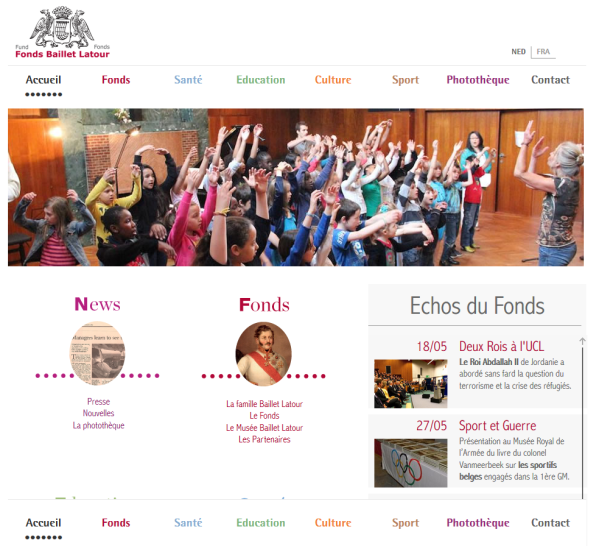
The winner for the international consumer brand category, EMEA, is Fonds Baillet Latour. This site’s response time was the fastest, coming in at 4.52 seconds on average, showing that it was very efficient in a number of key areas.
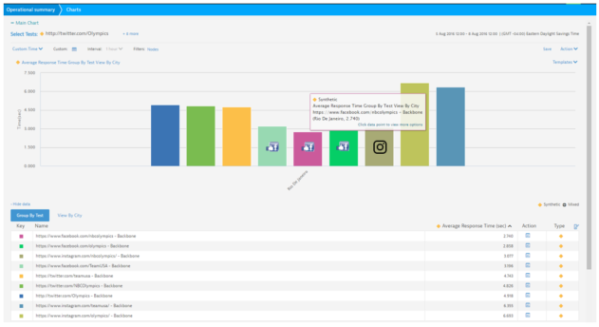
The below four metrics are the number of hosts, number of connections, number of objects and number of bytes. If you can deliver a good balance of rich multimedia content, reuse the number of connections delivering the objects, and manage the number of hosts connections, then this will usually provide you with the training regimen that will give you a chance to reach the podium.
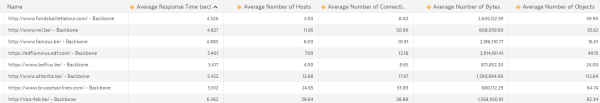
In this chart you can clearly see how http://www.fondsbaillet latour.com received top honors as it had the fewest number of hosts, and used the least number of connections to serve up 60 objects while still providing a rich amount of content (2.7 million bytes).
Above is a view of how the top sites performed around the globe and in Brazil over the past five days.
And the gold meda forl performance goes to: Fonds Baillet Latour!
Category: International Consumer Brands – France
In the international consumer brand category, France, we saw the closet race yet, as Samsung came in first ahead of Bridgestone and Visa. A mere .200 seconds separated first and third place (5.66 seconds to 5.88 seconds).
And the gold medal performance goes to:
Join us next time as we examine the Olympics category in Italy and LATAM.
Update: 6:00 pm August 9, 2016 by Andre’ Chagnon
The Dynatrace Rio Report – Taking a Deep Dive into Sports Sites
In our third installment of the Rio report, we examined top sports organizations – looking at which ones won the race for website speed. We also took a deep dive into how the USA Diving website is performing. Hint: they’re currently performing swimmingly.
In the sports organization category we compared the below sites, from the following global locations: Sydney, Australia, Rio De Janeiro, Seattle, WA, Singapore, Johannesburg, South Africa, Chicago, IL, New York, NY
- http://www.olympic.org/rio-2016-summer-olympics
- http://www.iaaf.org/home
- http://www.teamusa.org/
- http://www.ussoccer.com/
- http://www.fifa.com/
- http://www.pga.com/home/
- http://www.atpworldtour.com/
- http://www.usaswimming.org/DesktopDefault.aspx
- http://www.teamusa.org/USA-Diving
- https://www.usacycling.org/
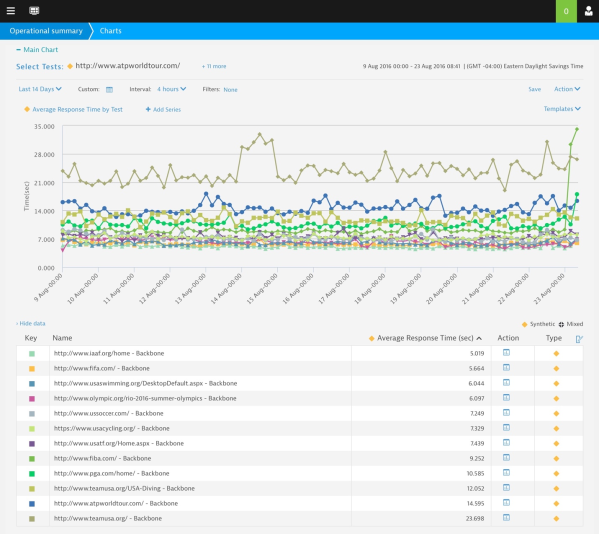
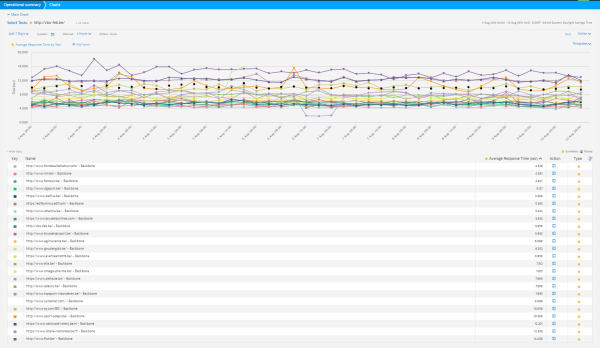
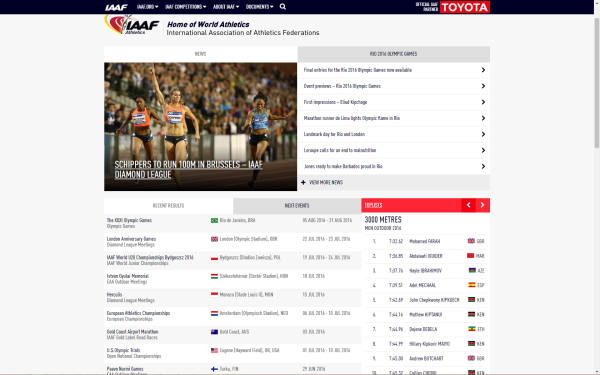
Through our analysis we found that the International Association of Athletics Federations (IAAF.org) website came in first overall, followed by the official Olympics website in second, and FIFA not far behind in third.
Let’s take a closer look at the top four sites: the IAAF homepage, FIFA.com, USA Swimming’s website, and Olympic.org.
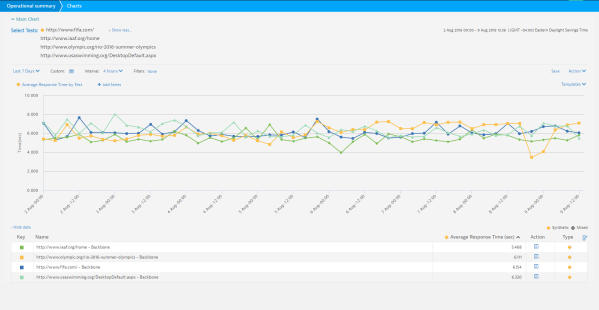
Taking a look at a seven-day timeframe above, IAAF.org comes in first overall, with the Olympic.org coming in at just a half-second behind. The race for third was a close one, as FIFA.com edged out USASwimming.org by the narrowest of margins — 0.166 seconds overall.
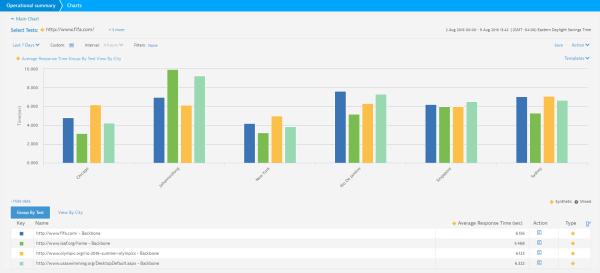
This chart shows above shows the average response time across all of the testing locations, displaying how IAAF.org’s performance in five out of the six locations propelled them into first place.
And the gold medal for the sports organization category goes to: IAAF.com.
In this category one other Olympic site stood out. This site did not make the podium this year. Based on the adjustments that were made leading into the Olympics opening ceremony, we imagine they will be swimming their way there next time around.
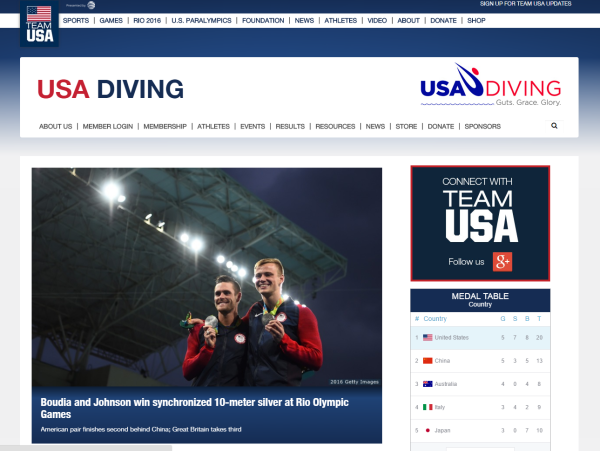
Boudia and Johnson may have taken home the silver at the Olympics, but let’s see how the USA Diving website performed.
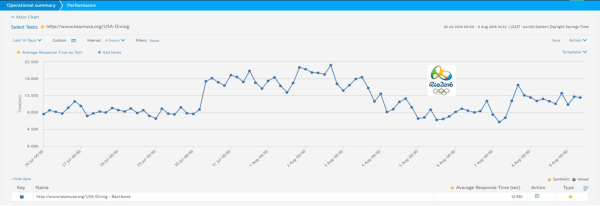
Isolating the USA Diving website we can examine the 14 day trend and see the changes and adjustments that were made heading into the Olympics opening ceremony on Aug. 5.
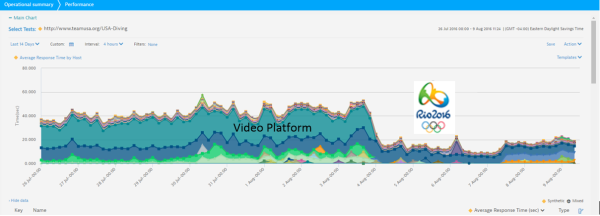
Now let’s take a behind-the-scenes look at what has been happening with the site over the last 14 days, as adjustments were made surrounding the kick off of the Olympics on Aug. 5. Notice that prior to Aug. 5, there was a lot of inconsistency and performance delays with their video platform. On Aug. 5 – just in time for the Opening Ceremonies — they made some adjustments and started to deliver their site much faster.
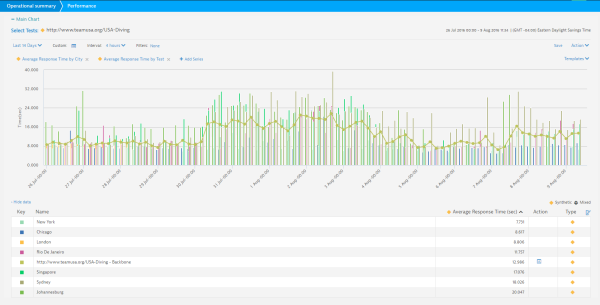
Lastly, this view shows how this really impacted their ability to better deliver exceptional digital experience once changes were made on Aug. 4. As you can see, they were swimming in calmer waters.
As the games press on, so too does our analysis of all of the websites that matter most. Tune in next time as we break down performance of major international consumer brands.
Update: 6:00 pm August 8, 2016 by Andre’ Chagnon
The Dynatrace Rio Report – All Eyes on Facebook’s Winning Digital Performance
As the Games are heating up, so too is social media traffic to Olympic channels, as fans from around the world show their support for their favorite athletes, teams and countries. Here at Dynatrace, we’re also paying close attention to how the speed and performance of digital properties around the globe are being impacted by increased website traffic.
In our second installment of the Rio report, we took an unfiltered look at the social media category, examining Facebook, Instagram and Twitter. Theses metrics were calculated based on the first four days of the Olympic Games (Aug. 5-Aug. 8).
Here’s a look at how Facebook, Twitter and Instagram performed in the following locations: Sydney, Australia; Rio De Janeiro; Singapore; Johannesburg, South Africa; Chicago, IL and New York, NY.
As you can see, Facebook sites are performing best overall in the social media category, looking in from around the world.
It’s interesting to note that the view from within Brazil is different than that of other locations. In Rio, Facebook is performing the best overall, followed by Instagram, which comes in third out of the nine sites being tested.
And the gold medal goes to…
In terms of overall performance in the social media category, Facebook surely wins the gold medal, with Instagram coming in second with the silver and Twitter taking home the bronze. In the single site (event) category from Brazil, Facebook is cleaning up, taking home both the gold and silver medals, with Instagram coming in close third, bringing home the bronze.
Update: 12:00 pm August 6, 2016 by Andre’ Chagnon
The Dynatrace Rio Report – NBC Takes the Gold for Digital Performance
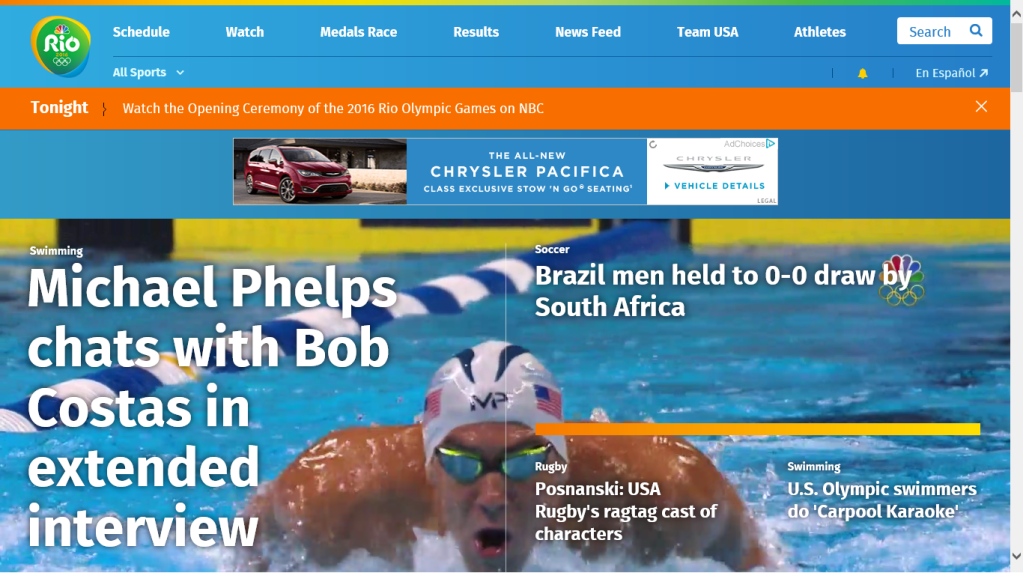
The Games are here and the world is watching. Here at Dynatrace, we’re also watching to monitor how the speed and performance of digital properties around the globe are impacted by the expected surge in web traffic. This could mean that the websites and mobile apps of major social networks, sporting organizations, brands and media/broadcasters might experience slowdowns or errors – causing frustrations for people in Brazil and also around the world who generally expect websites that load fast.
In our first Rio report, we’re analyzing how the major U.S. cable TV networks have been performing in the run up to the start of the Games. The winner it appears is NBC who’s done a fantastic of prepping its website for Olympic digital performance.
Charts and analysis follow below – note that for all tests, we are measuring the time it takes for the website to load (response time, measured in seconds) from networks in the U.S., Australia, Brazil, Singapore and South Africa, across a specific time period to determine the average.
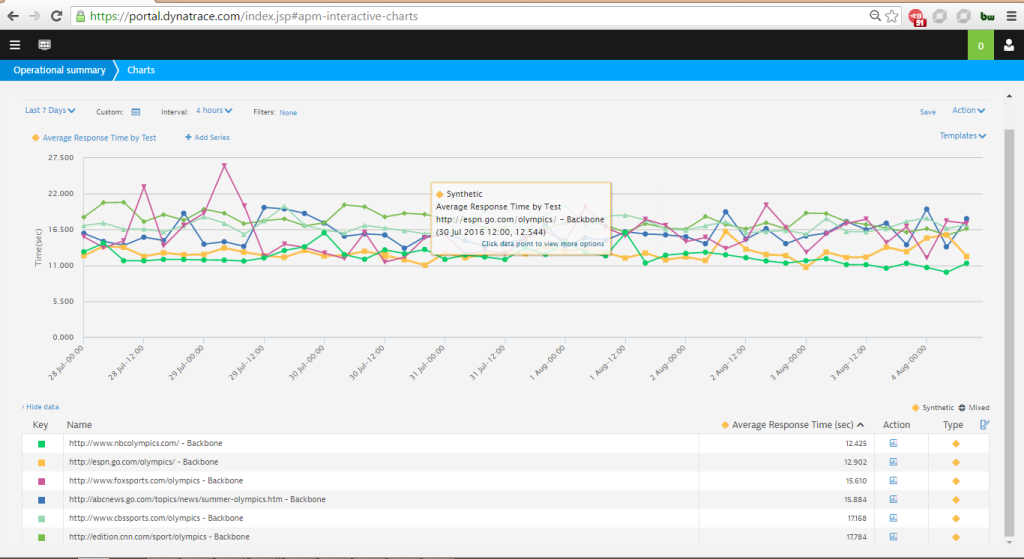
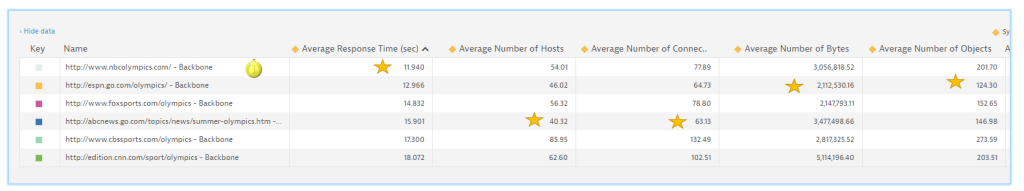
As you can see, during the week preceding the start of the Games, the average response times of the websites of these major broadcast networks ranged from 12.4 to 17.8 seconds.
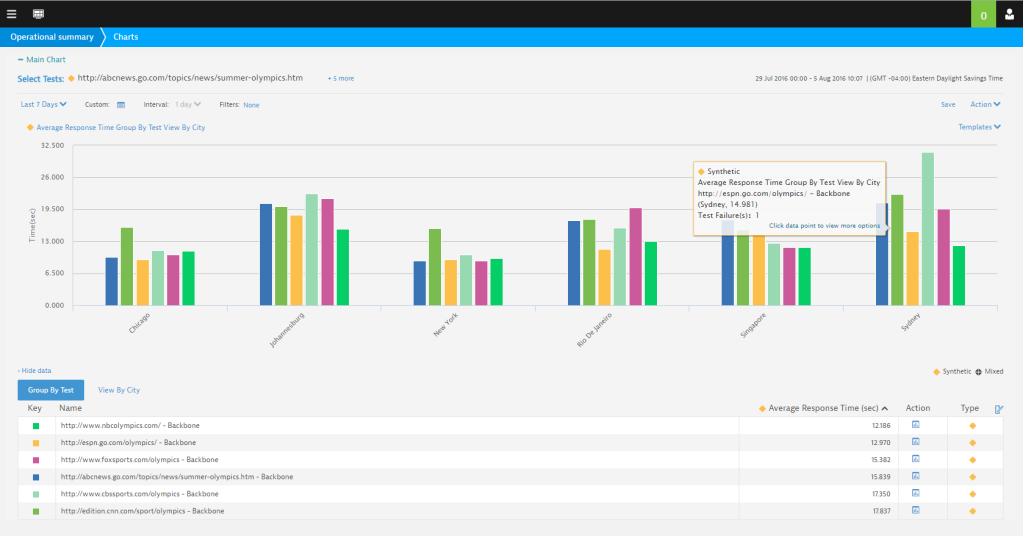
This test examines performance from the view of different cities across the U.S. Notice how NBC’s response times over the seven days averages 12.2 seconds, whereas the other sites vary in speeds.
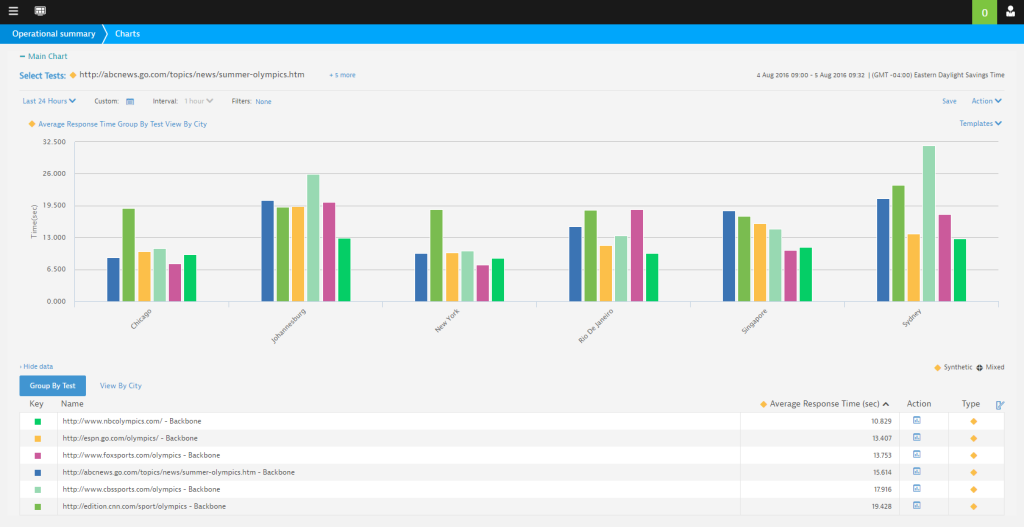
It’s clear when comparing last week to the last 24 hours that all of these TV networks sites have been seriously preparing their sites in anticipation of the start of the Olympics – making adjustments, optimizing content, and pushing this content out to the edges to ensure a better end user experience when the content download’s into the user’s browser. The chart above shows how NBC is optimizing and adjusting levers, achieving a response speed of 10.8 seconds, shaving 1.5 seconds across the board.
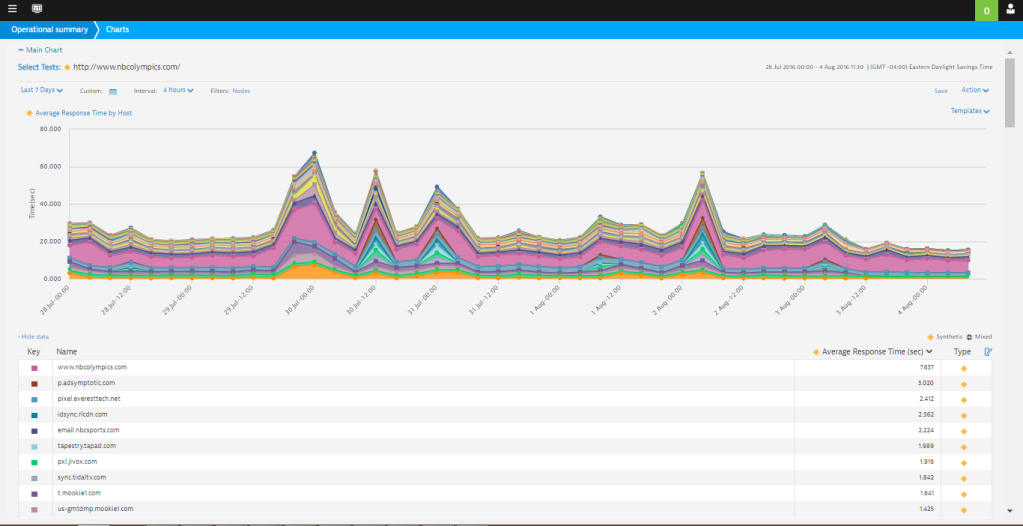
This view digs deeper into the composition of the NBC Olympics web experience. These represent a small subset of hosts that are also delivering content to this site. To put this into perspective, our tests found nearly 50 hosts that are delivering 150 objects which is a nearly a 4,000,000-byte page site. You can look at this as a heat map of sorts, providing a real time view of how all of those hosts are performing. This is pretty incredible when you consider that all of these moving parts have to come together to deliver a rich multimedia experience.
Here is a look at the NBC Olympics site, which is delivering gold-medal worthy digital performance so far. Well done!
This slide analyzes the other media sites and highlights the efficacy that NBC is providing in delivering their site content.
While NBC wasn’t tops for the lowest number of hosts and bytes or fewest connections and objects, it was number 1 in what matters most – response times and crossing the finish line in your browser first. NBC gets a gold medal for the efficiency in delivery of their content.
Update: 8:45 am August 3, 2016
We are days away from the 2016 Summer Olympics in Brazil and reports abound that the state of preparedness is in question. For several weeks now, the team here at Dynatrace has been investigating whether or not Brazil is digitally prepared for the upcoming games. While much attention has been given to the facilities, infrastructure, etc. we started to look at how web and mobile applications will be experienced by users in Brazil during the games. As tourists and Olympians arrive, what will they expect when they start using their mobile devices to access their favorite digital applications? We are looking at data coming from our own local industry benchmarks, local real user data and data from content delivery networks (CDNs) and other providers to gauge whether or not Brazil is digitally prepared.
Starting point to being Digitally Prepared
To start things off we took a look at some long-term trending data from the Dynatrace Industry Benchmarks. This data comes from testing dozens of Brazilian companies (retail and financial) from two locations within Brazil (Rio De Janeiro and Sao Paulo). This dataset represents hundreds of thousands of web requests over a 10-month period. The first metric we looked at was the domain name system (DNS) lookup time. For those unfamiliar with DNS, you can think of this as an internet phone book that allows you to route a browser or phone to the servers providing a website.
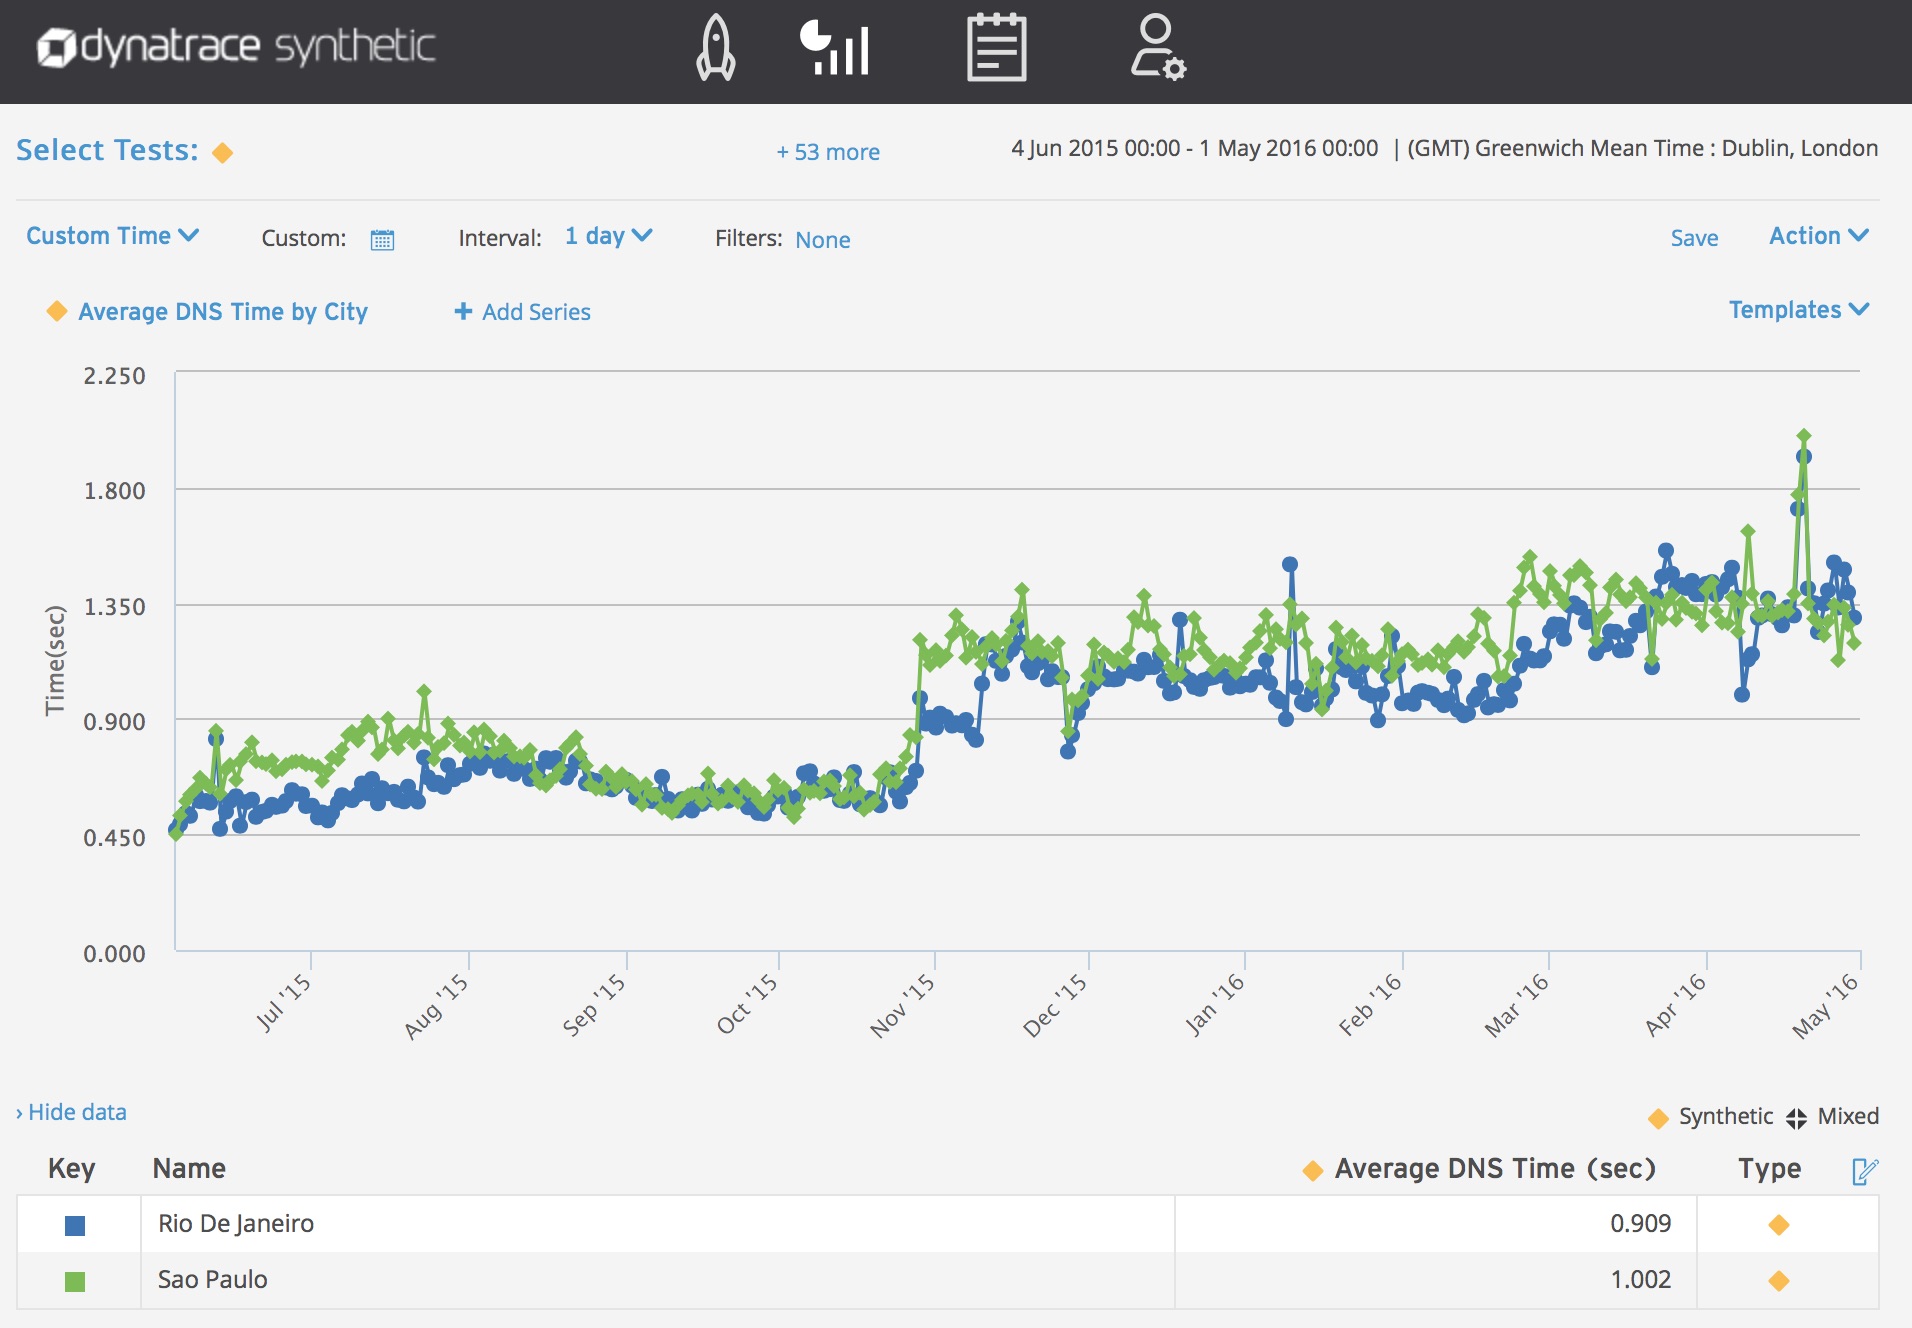
Here we can see that DNS response times are on the rise. While normally DNS response times are measured in milliseconds, here we are aggregating the total time spent resolving DNS for all the requests made loading pages. Given that the pages being tested call between 20-120 different domains every time they are loaded, DNS health may be an issue.
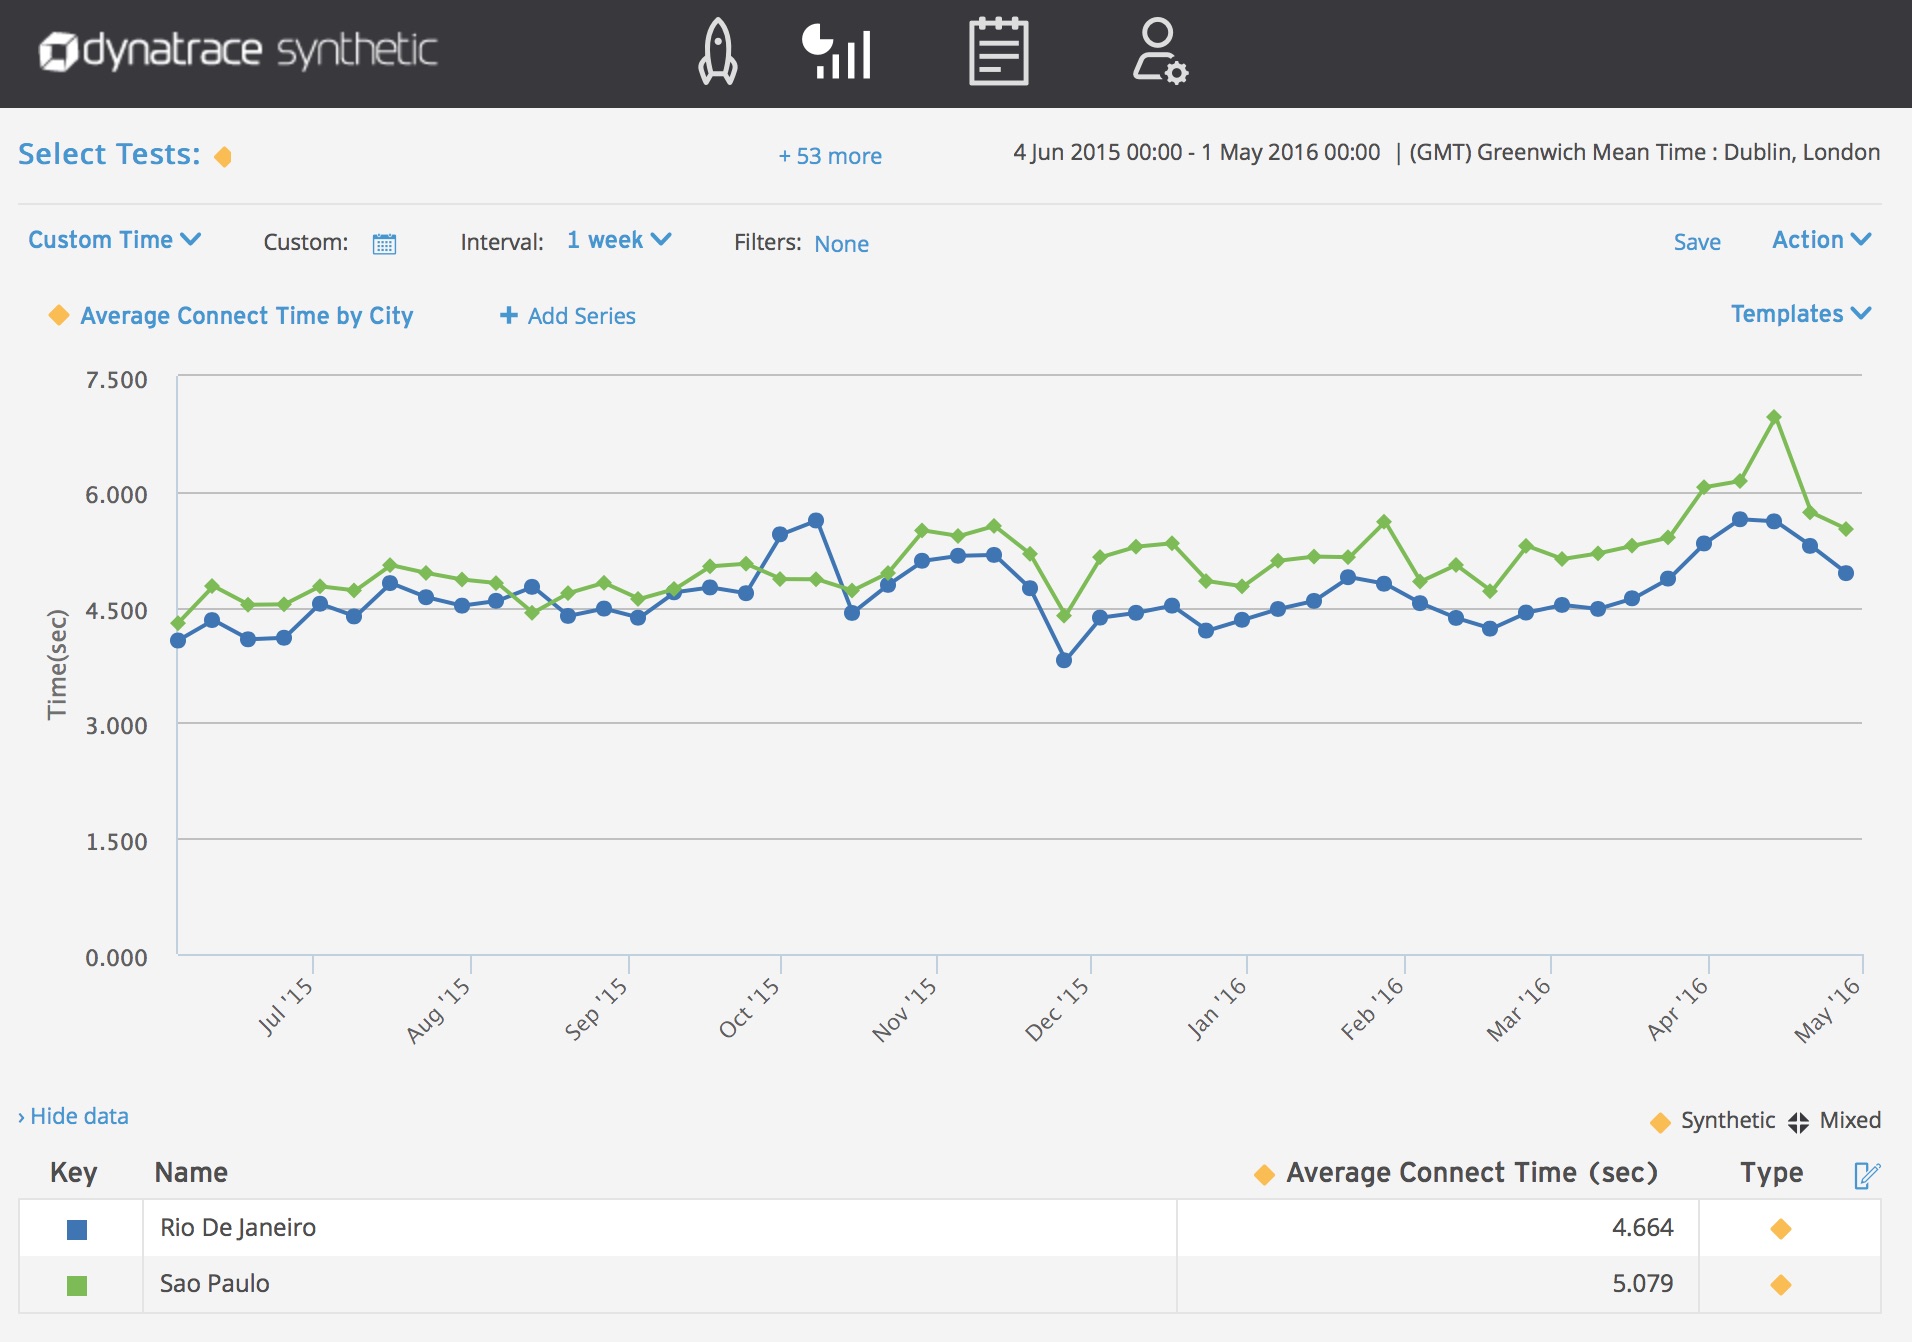
The next metric we reviewed was network latency, specifically connect time. This is the length of time it takes to establish a connection so that the browser or mobile phone can start downloading content. In the past, connect time was solely the domain of IPV4 and HTTP/S 1.0 and 1.1. Now connect time is being impacted by the global shift to IPV6 addresses and HTTP 2. For those unfamiliar, IPV6 was introduced as a response to the world running out of a limited number of IPV4 addresses. IPV6 can introduce some longer response times as the address length is larger and thus the packet size will be larger. Essentially this means pushing more data over already congested networks. While HTTP2 — an updated version of HTTP — can offset some of the impact of IPV6, we are still seeing a slight increase in connect times from Brazil.
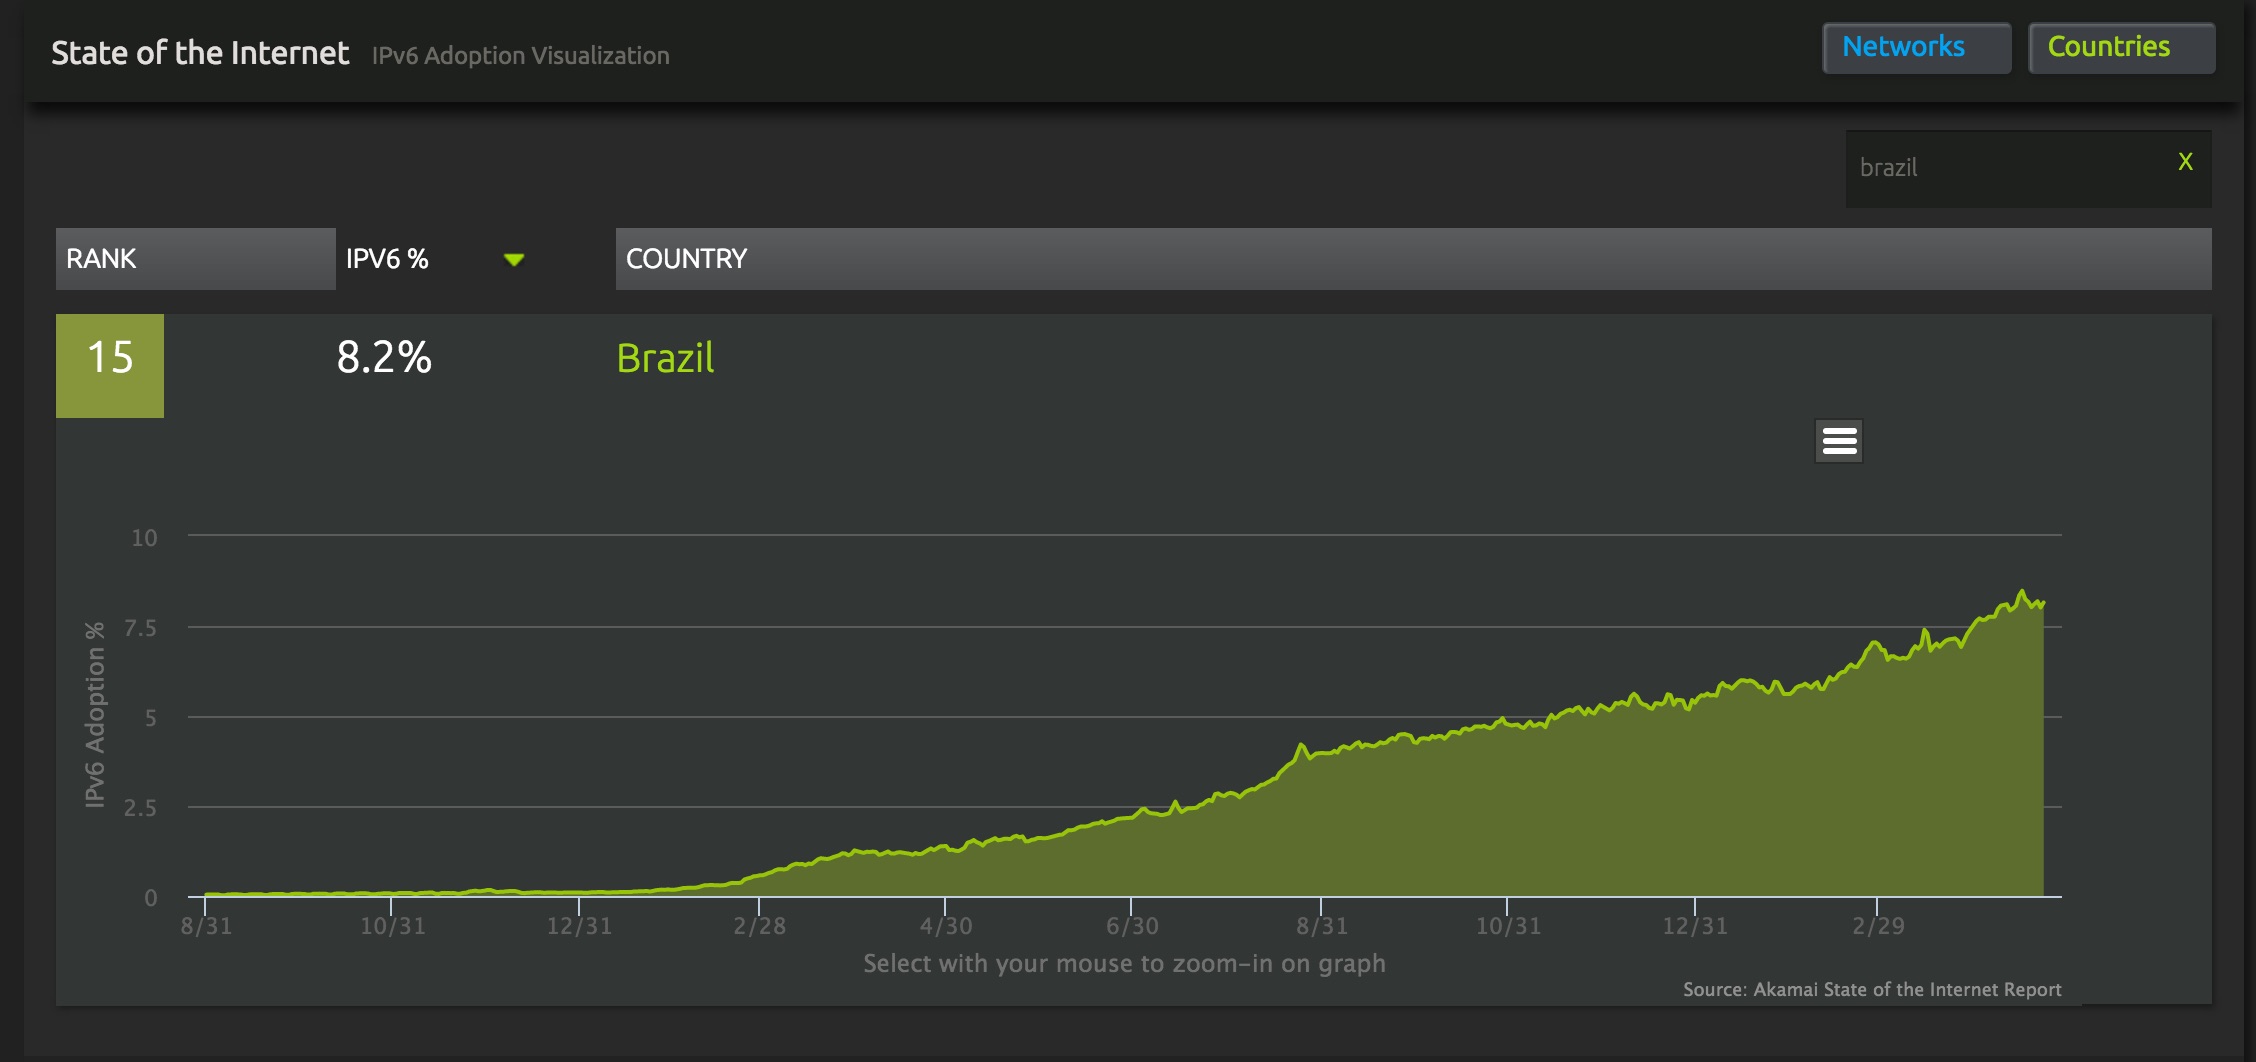
CDN provider Akamai has been tracking the adoption of IPV6 and we are definitely seeing an increase in IPV6 traffic within Brazil.
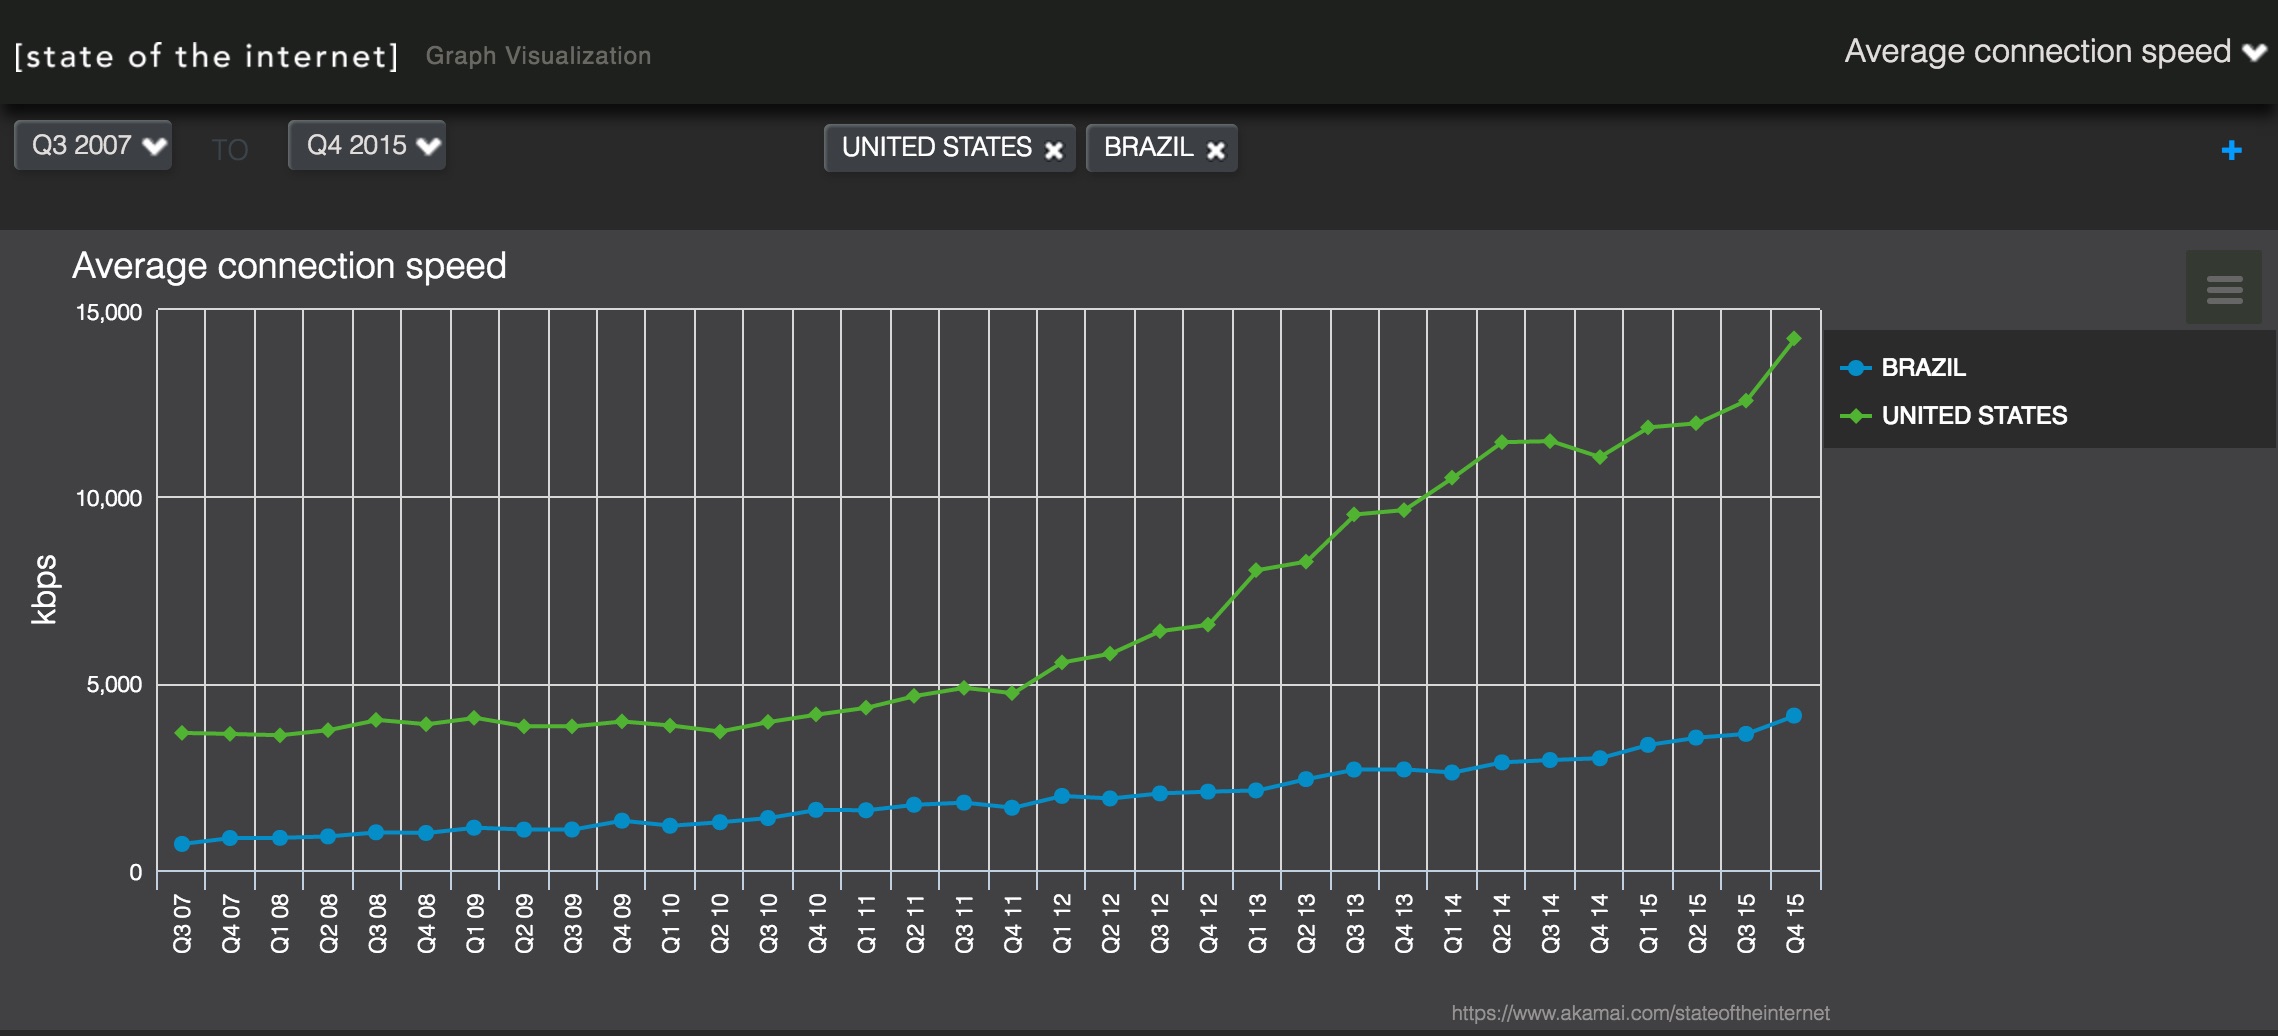
While Brazil’s network traffic is modernizing, it is not doing so at the same rate as other countries. For example, this data (also from Akamai) shows that the average connection speeds within the U.S. are over three times faster than Brazil.
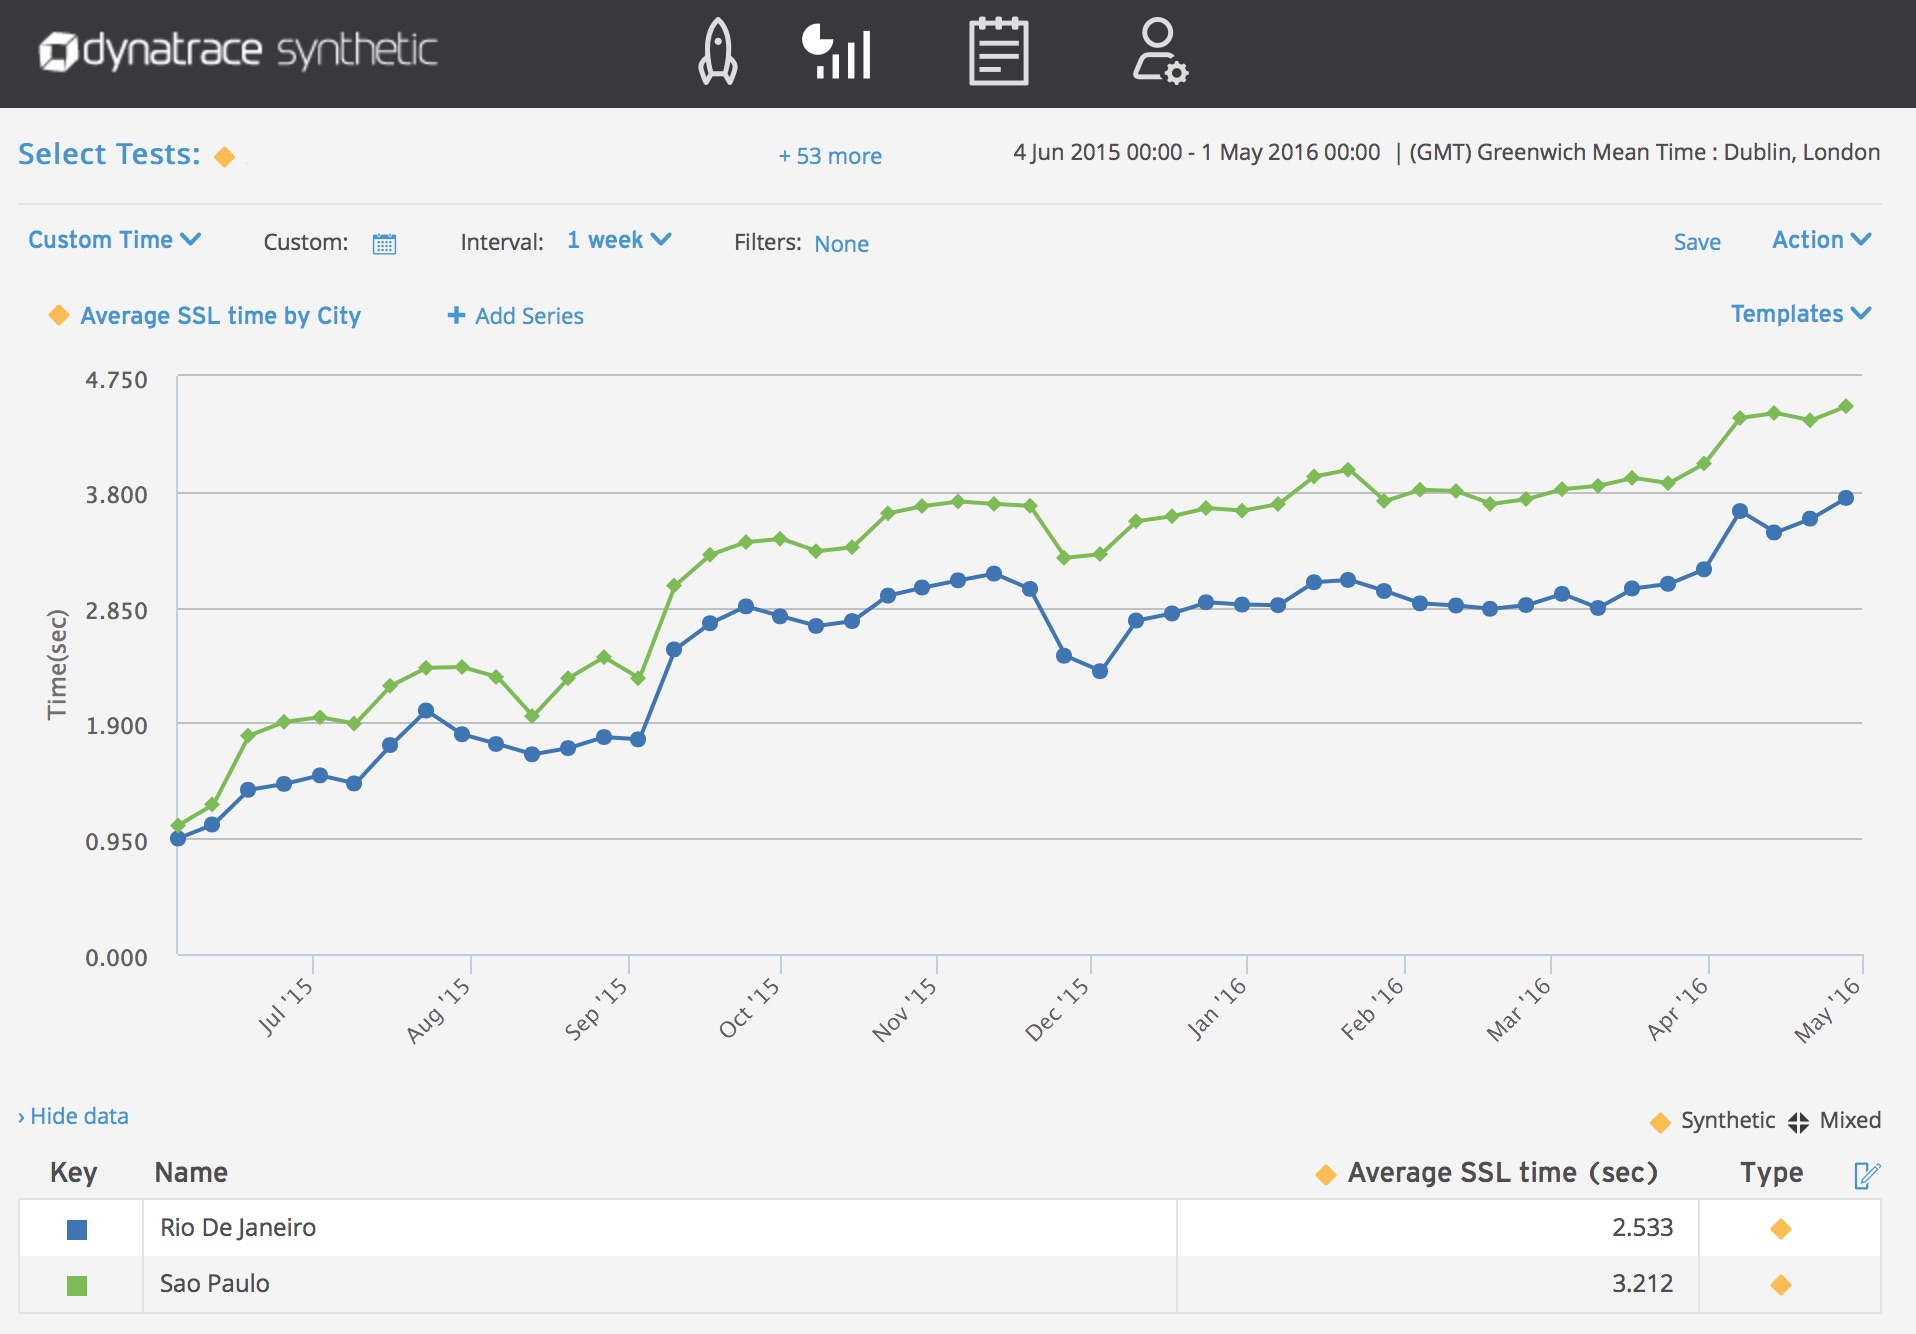
Network infrastructure aside, the general increase in the complexity of applications and web sites is also a factor which can impact end users in Brazil this summer. Below is a look at SSL times for the Dynatrace Industry Benchmarks. As organizations become more security conscious , the impact of implementing HTTPS and SSL on end user’s experience can be seen.
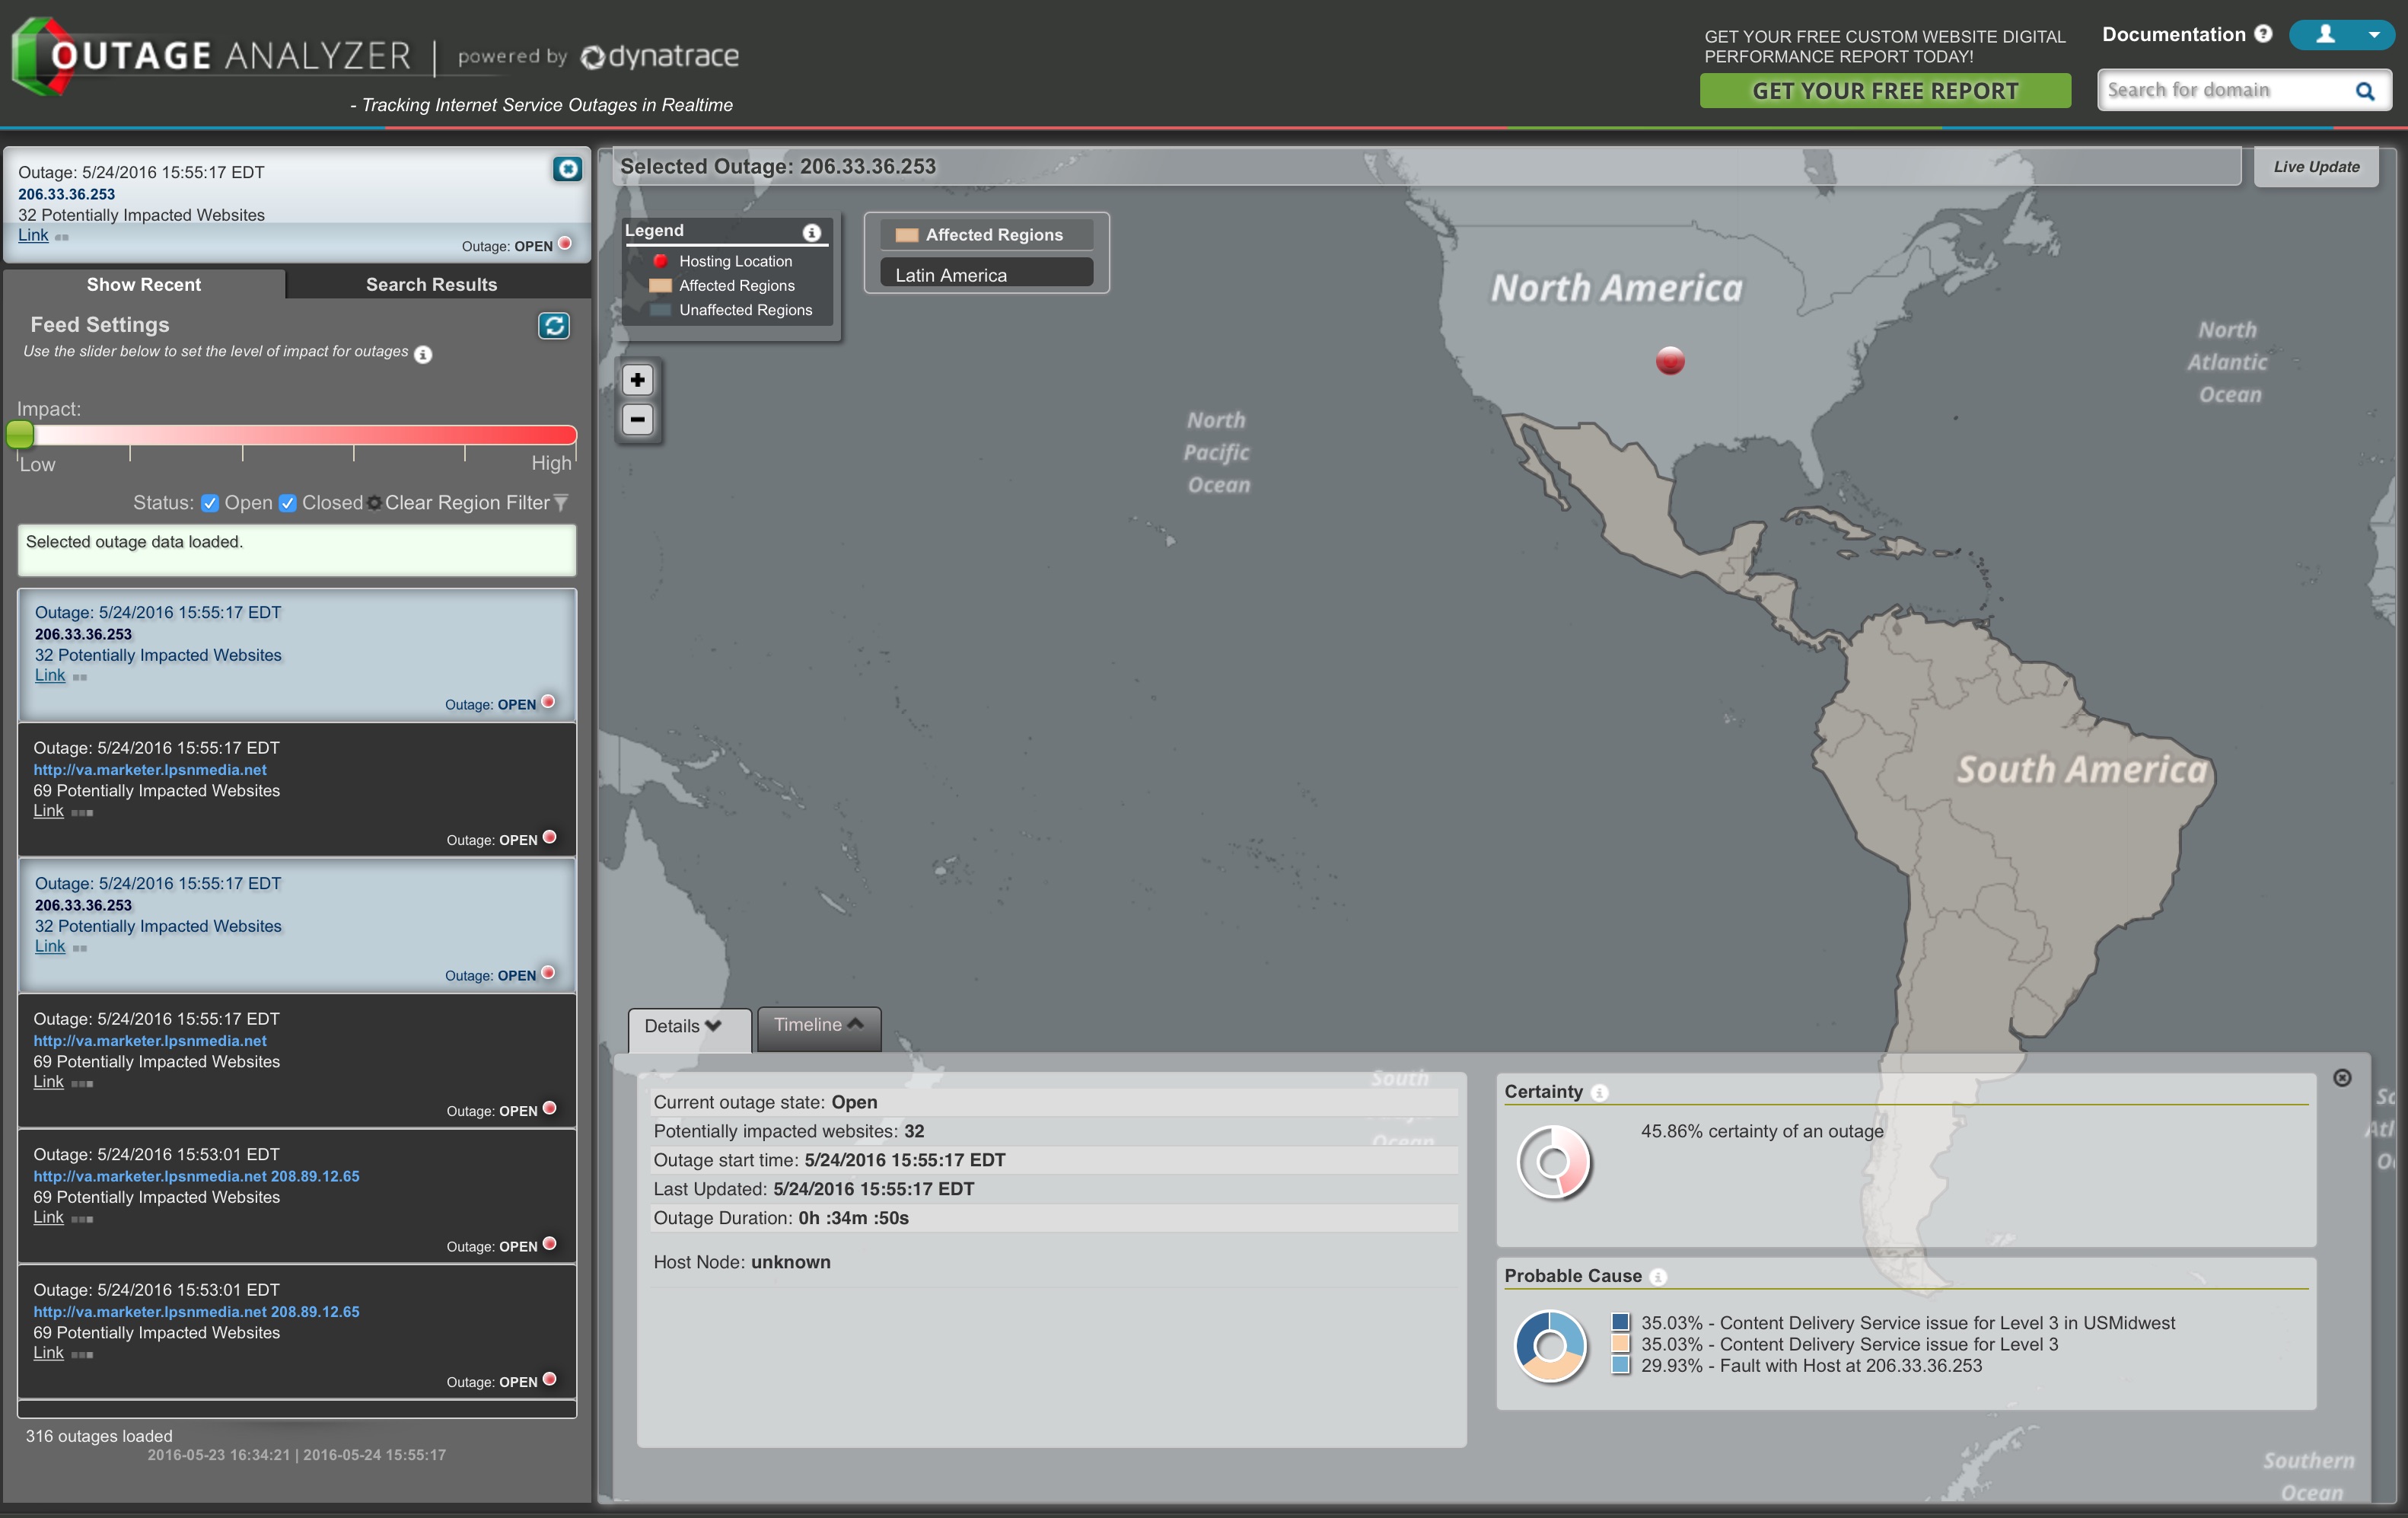
In addition to network-level data, our team has been using the collective intelligence built from the Dynatrace Synthetic Network to track third-parties. These could be CDNs, ad providers, social media content, analytic tools, etc. and how they are being seen in regions like South America. For example, Dynatrace Outage Analyzer reported more than 300 outages in one 24-hour period. For websites that use lots of third-parties this can be problematic.
Digitally Prepared is delivering UX better than “Tolerating” or “Frustrated”
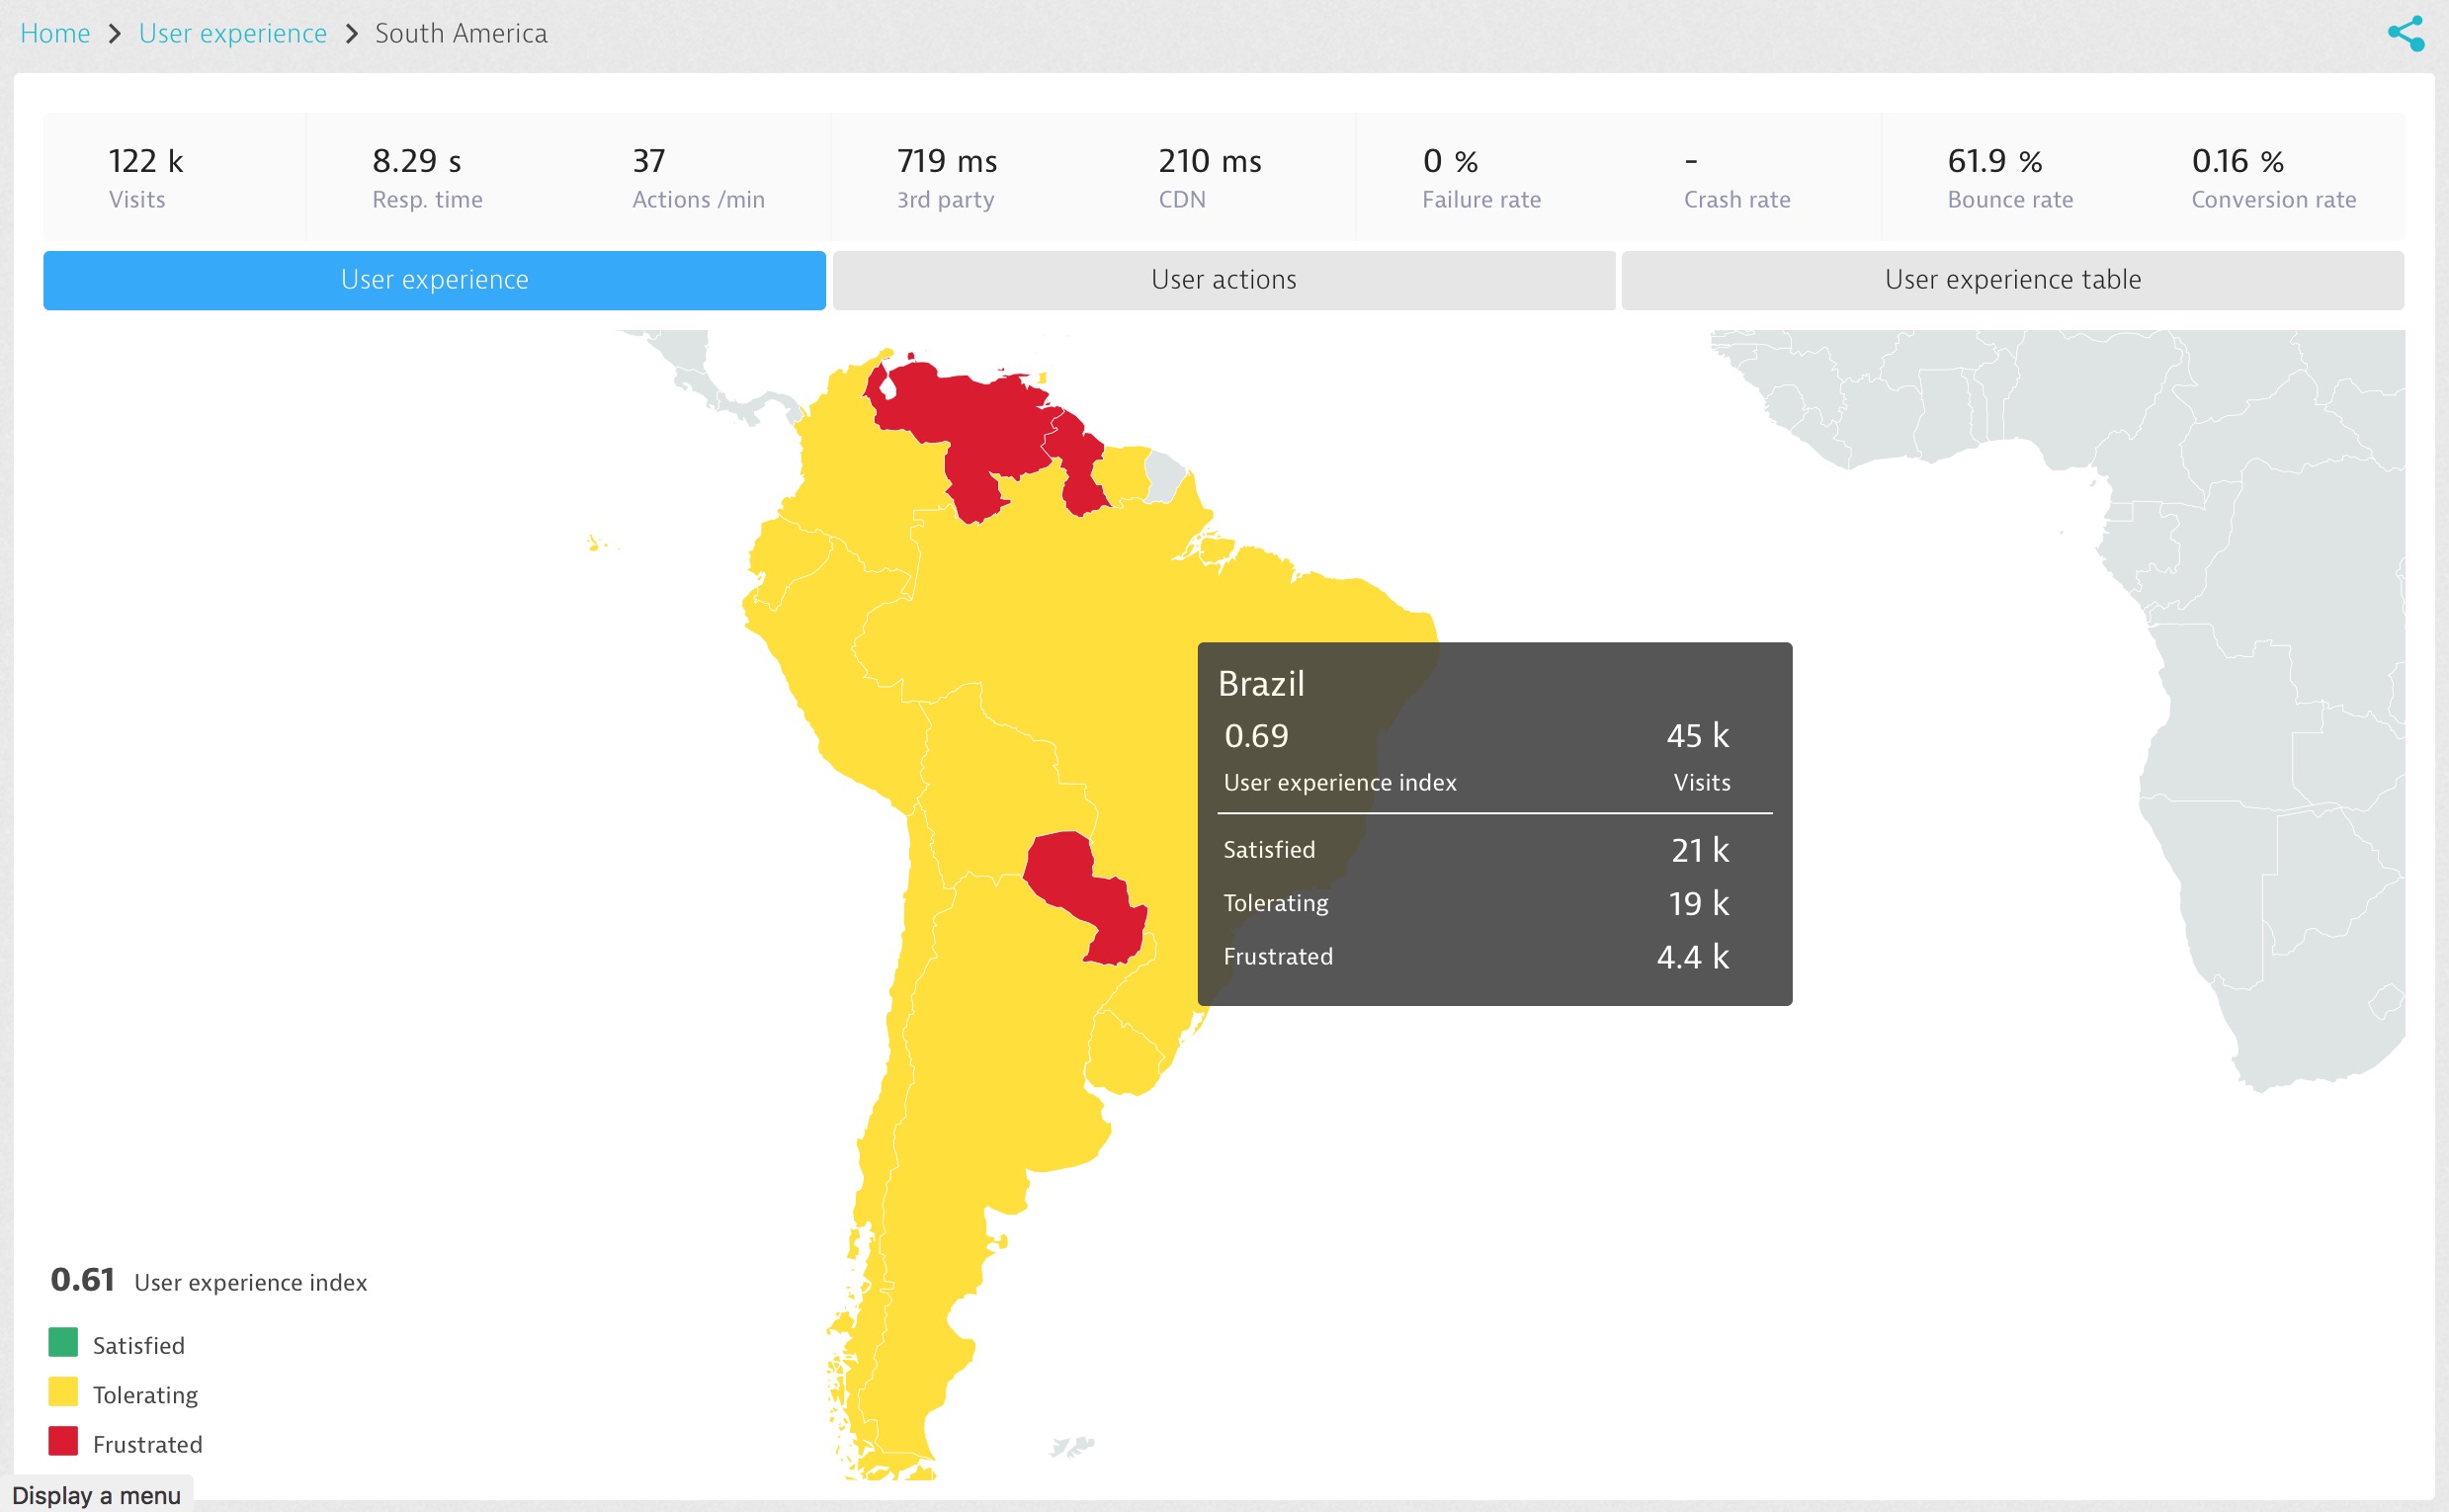
While the Dynatrace Industry Benchmarks and collective intelligence help us understand what is happening in Brazil from a network infrastructure standpoint, the Dynatrace team was also looking at some of our customers’ real-user data coming from Brazil. In the example below we are looking at the real-user traffic from a major hotel chain in Brazil. Here we can see 45,000 visits within a one-week period. During this time more than half of the end users had a tolerating or frustrating user experience as defined by the Dynatrace User Experience Index. Average user action response times were more than 8 seconds and over 60% of the visitors bounced off the site.
Digitally Prepared means strong mobile experience
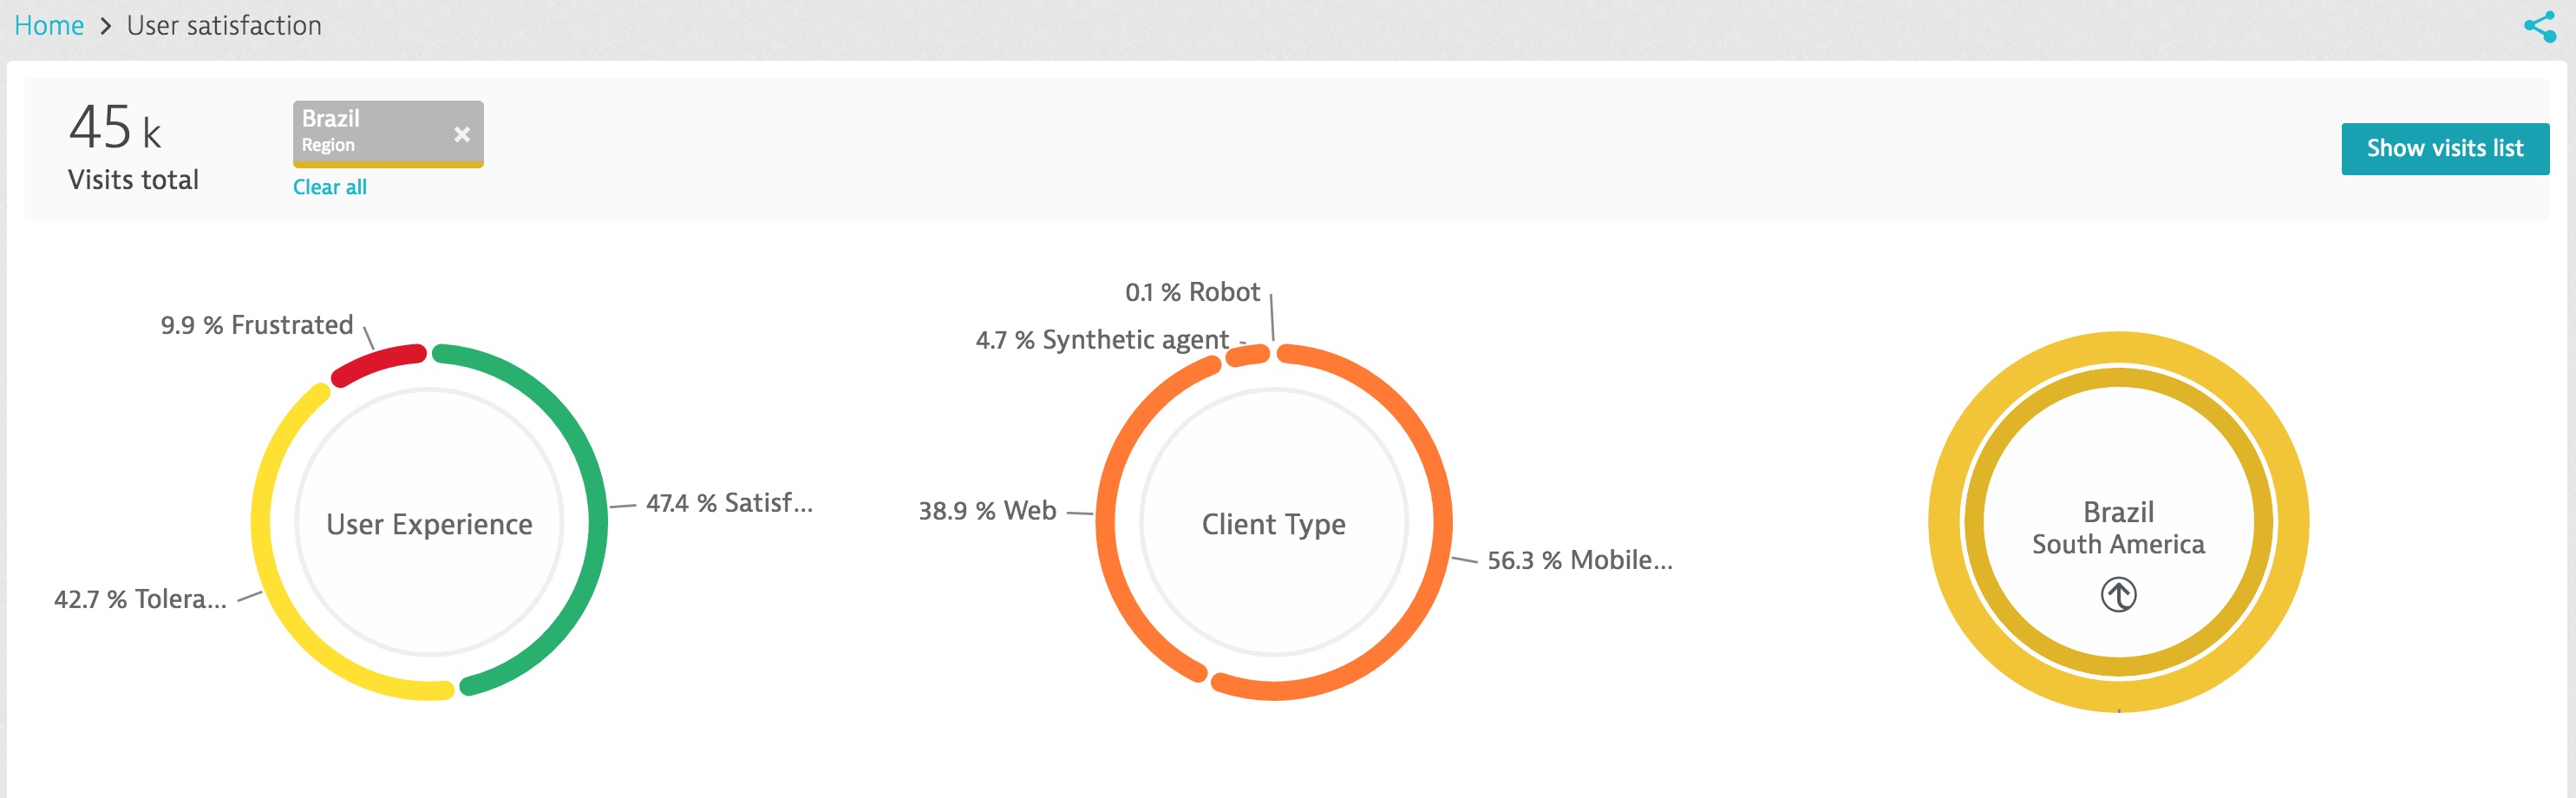
When we look at some of the detail around these real users in Brazil we see that more than half of them were using mobile devices (below). We fully expect to see a drastic increase in mobile traffic during the Olympics as spectators and Olympians begin using their mobile devices once on-site in Brazil.
Now that we looked at some of the real user traffic, let’s look at the performance for some of the sites that tourists and Olympians will be accessing during their stay in Brazil. The following tests were setup to run from both Sao Paulo and Rio De Janeiro. These social media sites will be a top mobile destination as both athletes and spectators share updates and experiences. We also included the TeamUSA site as an example of a support site which Olympians may use.
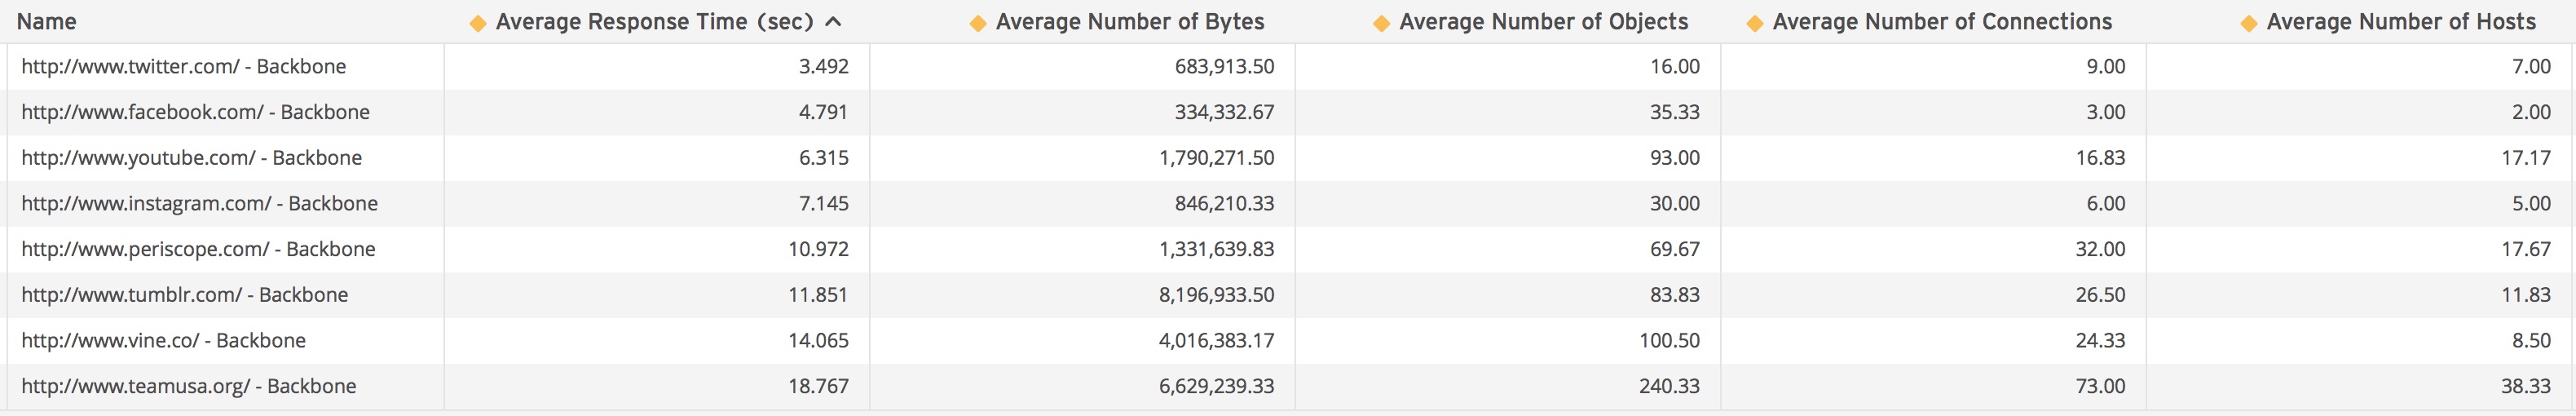
At this point, visitors from North America or Europe who access these social media sites will have a much slower experience than they are used to.
When it comes to the TeamUSA site, the experience from within Brazil may pose some challenges. Below is a result from a Dynatrace Last Mile Peer (this is a software robot running a real machine located in Brazil). It shows how the TeamUSA site loads for an end user. Based on what we discussed above, even something as simple as adding an image for the men’s rowing team can slow down the response time for end users in Brazil.
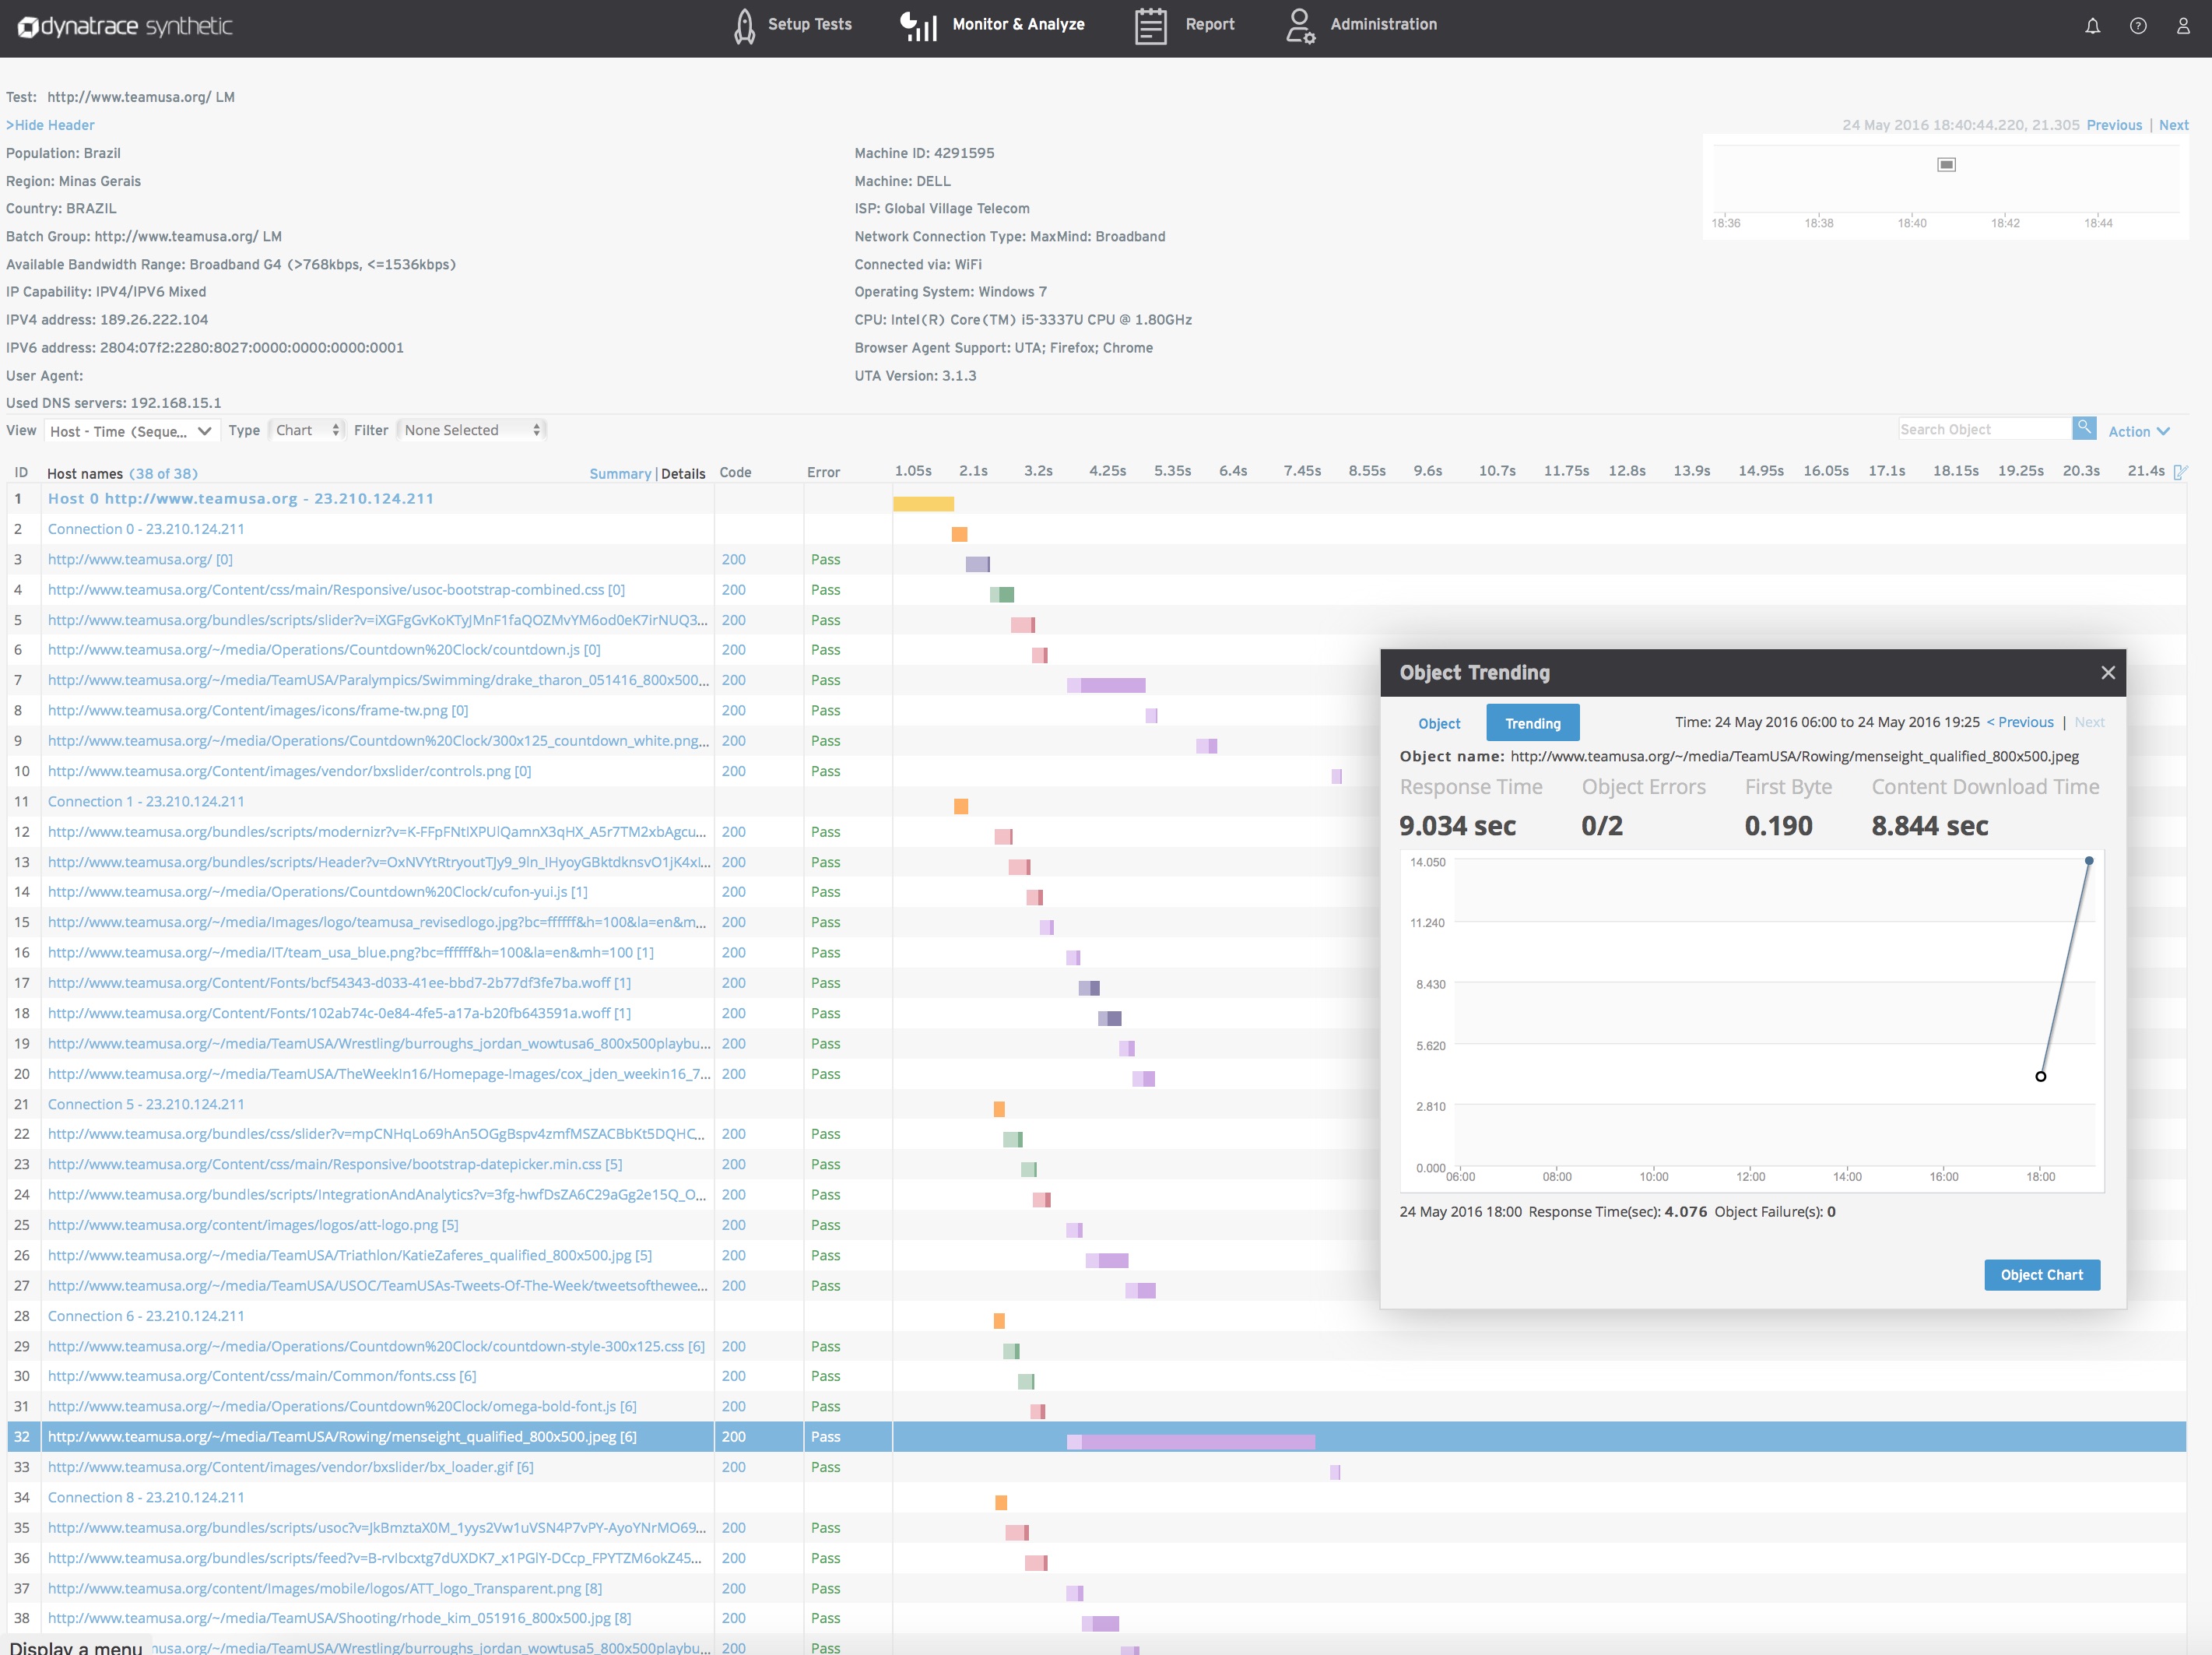
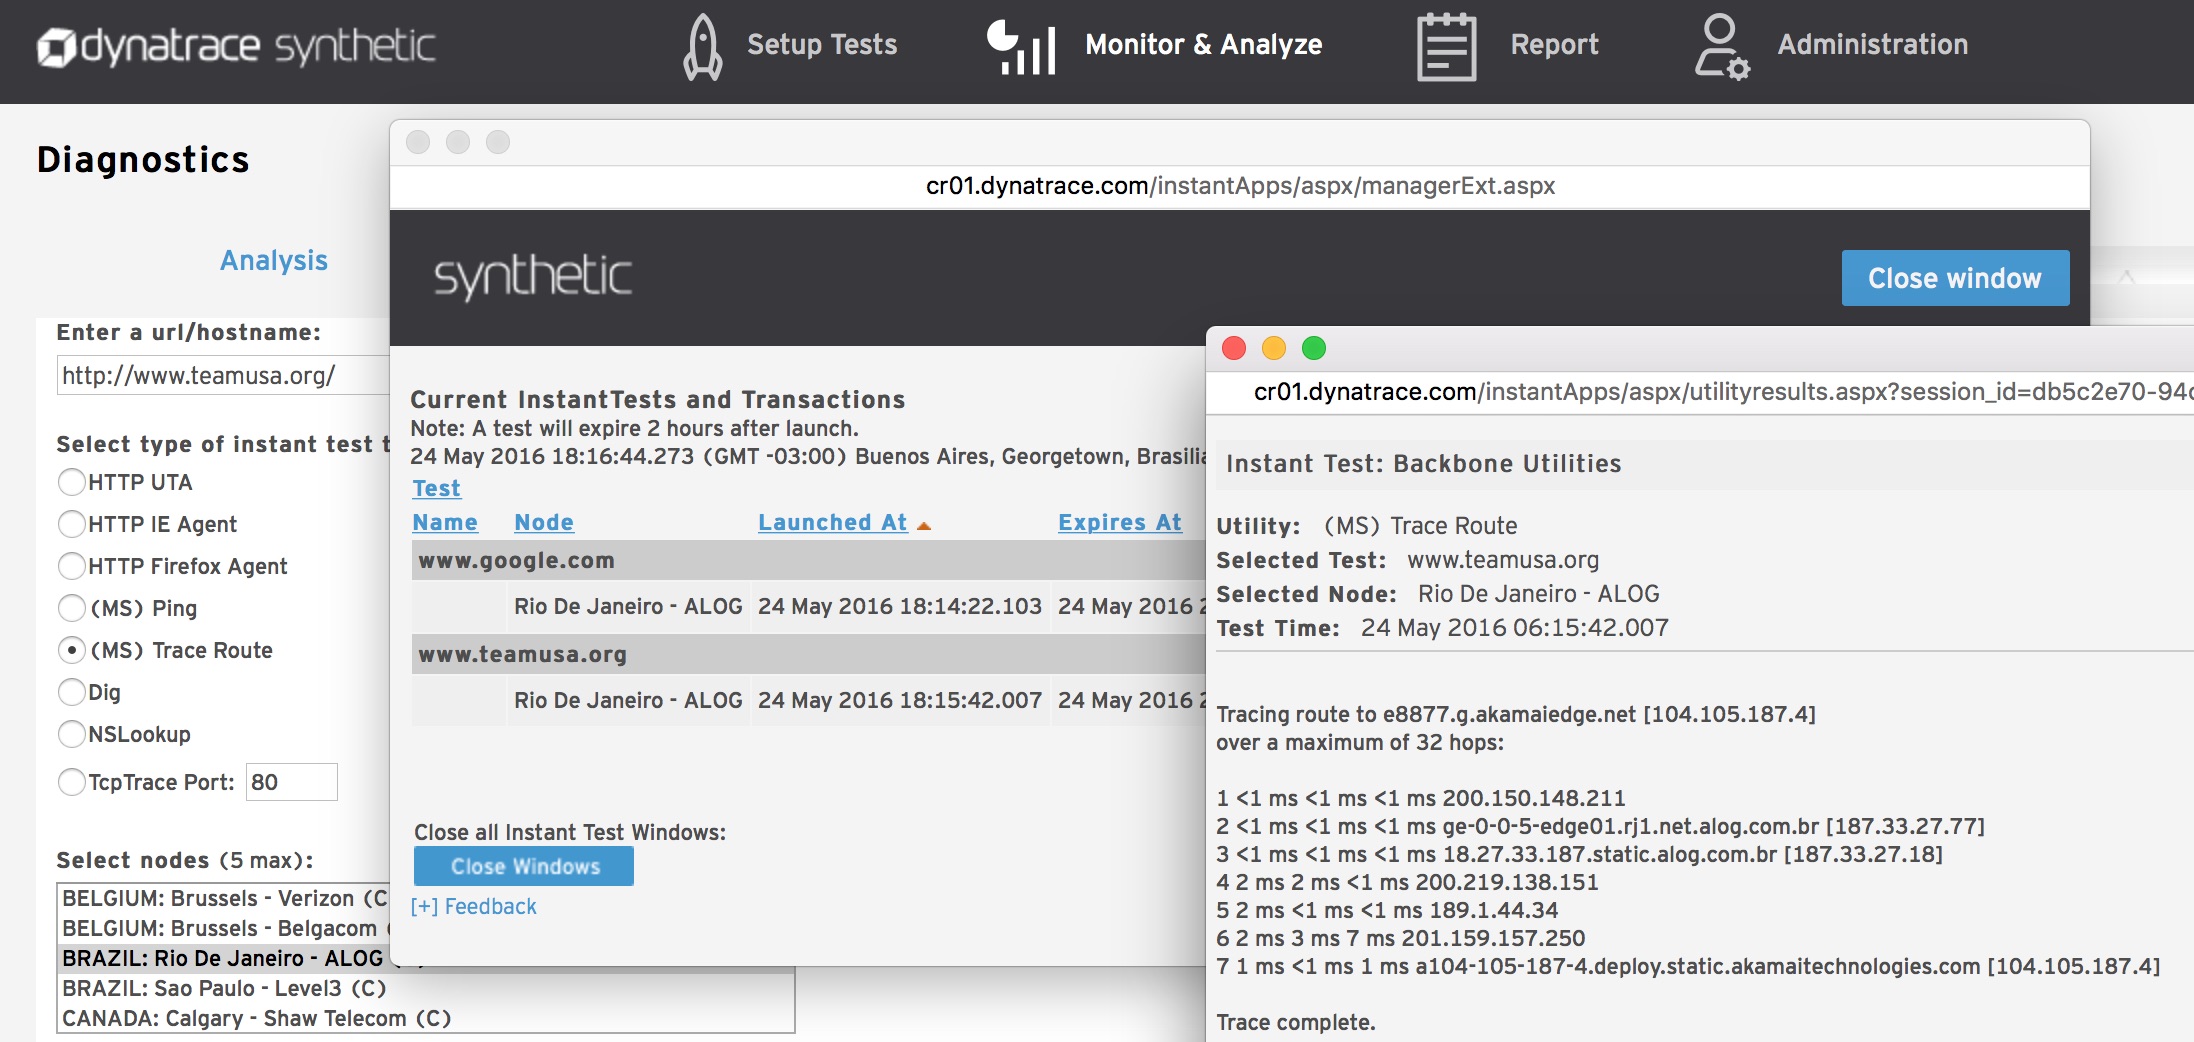
The diagnostic snapshot below shows us that the TeamUSA site is taking advantage of a CDN -this is a good first step. We recommend using CDNs where it makes sense, however all end users are not necessarily located near a CDN’s local point of presence, so content providers should make sure their site is optimized for delivery.
Consequences of failing to be Digitally Prepared
We’ve seen data that calls for some concern. As the Olympians arrive, prepare and begin their competitions, will they be relying on digital services residing back in the countries they came from? Will access to those services be impacted during the Olympics?
What do these challenges mean for end users?
- Slow response times and third-party errors will increase end user frustration.
- Frustrated end users are less likely to convert.
- End users will use social media to voice their frustration.
What do these challenges mean for companies and organizations?
- Lack of visibility may lead to over and under investment in technologies.
- Fewer conversions will mean less revenue being generated.
- Frustrated end users may use more costly channels to interact.
- Frustrated end users can lead to brand damaging feedback.
Getting Digitally Prepared
Leading into the 2016 Summer Olympics we have seen that Brazil may have some digital challenges ahead. Content providers, retailers, social media, sports media, travel providers, etc. need to make sure they are properly prepared before the Olympics begin. Here are some best practices to consider before the Olympics.
- Optimize your delivery for performance. Providers need to understand howto deliver their applications. This can be achieved by reducing page weight, the number of objects, the number connections being made during each session and the number of third-parties. Optimizing the delivery of the retail site is the start of this process, but providers have to look further into how the site is being delivered on the server side as well. Focusing on the client (browser) side or the server side alone is a recipe for disaster.
- Have a plan. Everyone needs a playbook. Providers need to make sure they have a plan in place when things go bad. The plan should not just be a reactive disaster recovery plan (that alone would be a bad plan), but rather a proactive approach that looks beyond disaster recovery and makes sure their sites and applications have been thoroughly tested before a major global event like the Olympics. The plans have to include ALL parts of the organization, it should not just be limited to operations, it has to include digital business owners, development, test and operations.
- Have the right digital performance platform . “Everyone has a plan until you get punched in the face”. Having a site go down during the Olympics is a traumatic experience for a provider. It’s not enough to have a plan, you also need the right platform in place. When things go bad for a retailer we typically see them go into a “war room” scenario. Every team has their own set of tools which typically tell them that what they are responsible for is green, but still the problem persists. Providers need to look beyond tools and use digital performance management platforms that bring teams together, they need a common platform that everyone in the organization can use including operations, development, test and digital business owners. Below is a screenshot of Dynatrace, part of a gap free, full stack monitoring platform.
- Understand the data. Having the right platform in place is a step in the right direction, but you also need the expertise to understand what the data is telling you. Most providers have teams of individuals who all understand their part of the application and have a few “rock stars” who have the big picture view of how it all works together. Modern applications are incredibly complex, with applications having hundreds if not thousands of dependencies. Sifting through log files (which is what we see most often) is the old and most costly way of solving a problem. Providers need to have an understanding of the relationship between application components and external internet factors. While most providers have a few rock stars, it’s important to have a next generation platform to automatically notify that event is occurring, analyze all the dependencies and discover the root cause of the issue.
Dynatrace will continue to monitor Brazil’s digital preparedness leading into and during the 2016 Olympics. Stay tuned here for updates.


Looking for answers?
Start a new discussion or ask for help in our Q&A forum.
Go to forum