
Enable real-time IT and business team collaboration by easily integrating insights from your web analytics tools into Dynatrace. Property packs help you bridge the gap between business, developers, and operations, allowing for better collaboration toward common goals.
Connecting insights from different tools is hard
While Dynatrace provides software intelligence to accelerate your company’s digital transformation, web analytics tools like Adobe Analytics help you deeply understand your user journeys, segmentation, behavior, and strategic business metrics such as revenue, orders, and conversion goals. As an application owner, product manager, or marketer, you need these insights to further refine your product and your go-to-market strategy.
But whenever you see one of your KPIs underperforming, does your web analytics tool give you a clear answer as to why? While reports may tell you that there’s a sudden increase in shopping cart abandonment, they won’t tell you that the reason is a particularly slow web page. And finding that root cause becomes even harder if application and IT teams are looking at business outcomes and user sessions from different perspectives.
To identify what matters most and how to improve performance and business outcomes, you need an easy way to translate your web analytics report into the language of your performance monitoring tool and vice versa. By establishing a common language between your application and IT teams, you can finally work on compatible customer segments and numbers, thus keeping up your conversions and, ultimately, your business success.
Integrate Dynatrace with Adobe Analytics and other tools to establish a common language
To help bridge the two worlds of IT and application teams, we’re excited to ship our first set of property packs for Adobe Analytics and other tools. Property packs make variables and properties of web analytics tools easily accessible in Dynatrace, enabling you to use similar segmentation mechanisms and match individual sessions. This link is established easily, leveraging your existing instrumentation. Break up silos, speak the same language, and collaborate toward the same goals:
- Understand how availability, functionality, and performance are impacting KPIs in Adobe Analytics or similar tools.
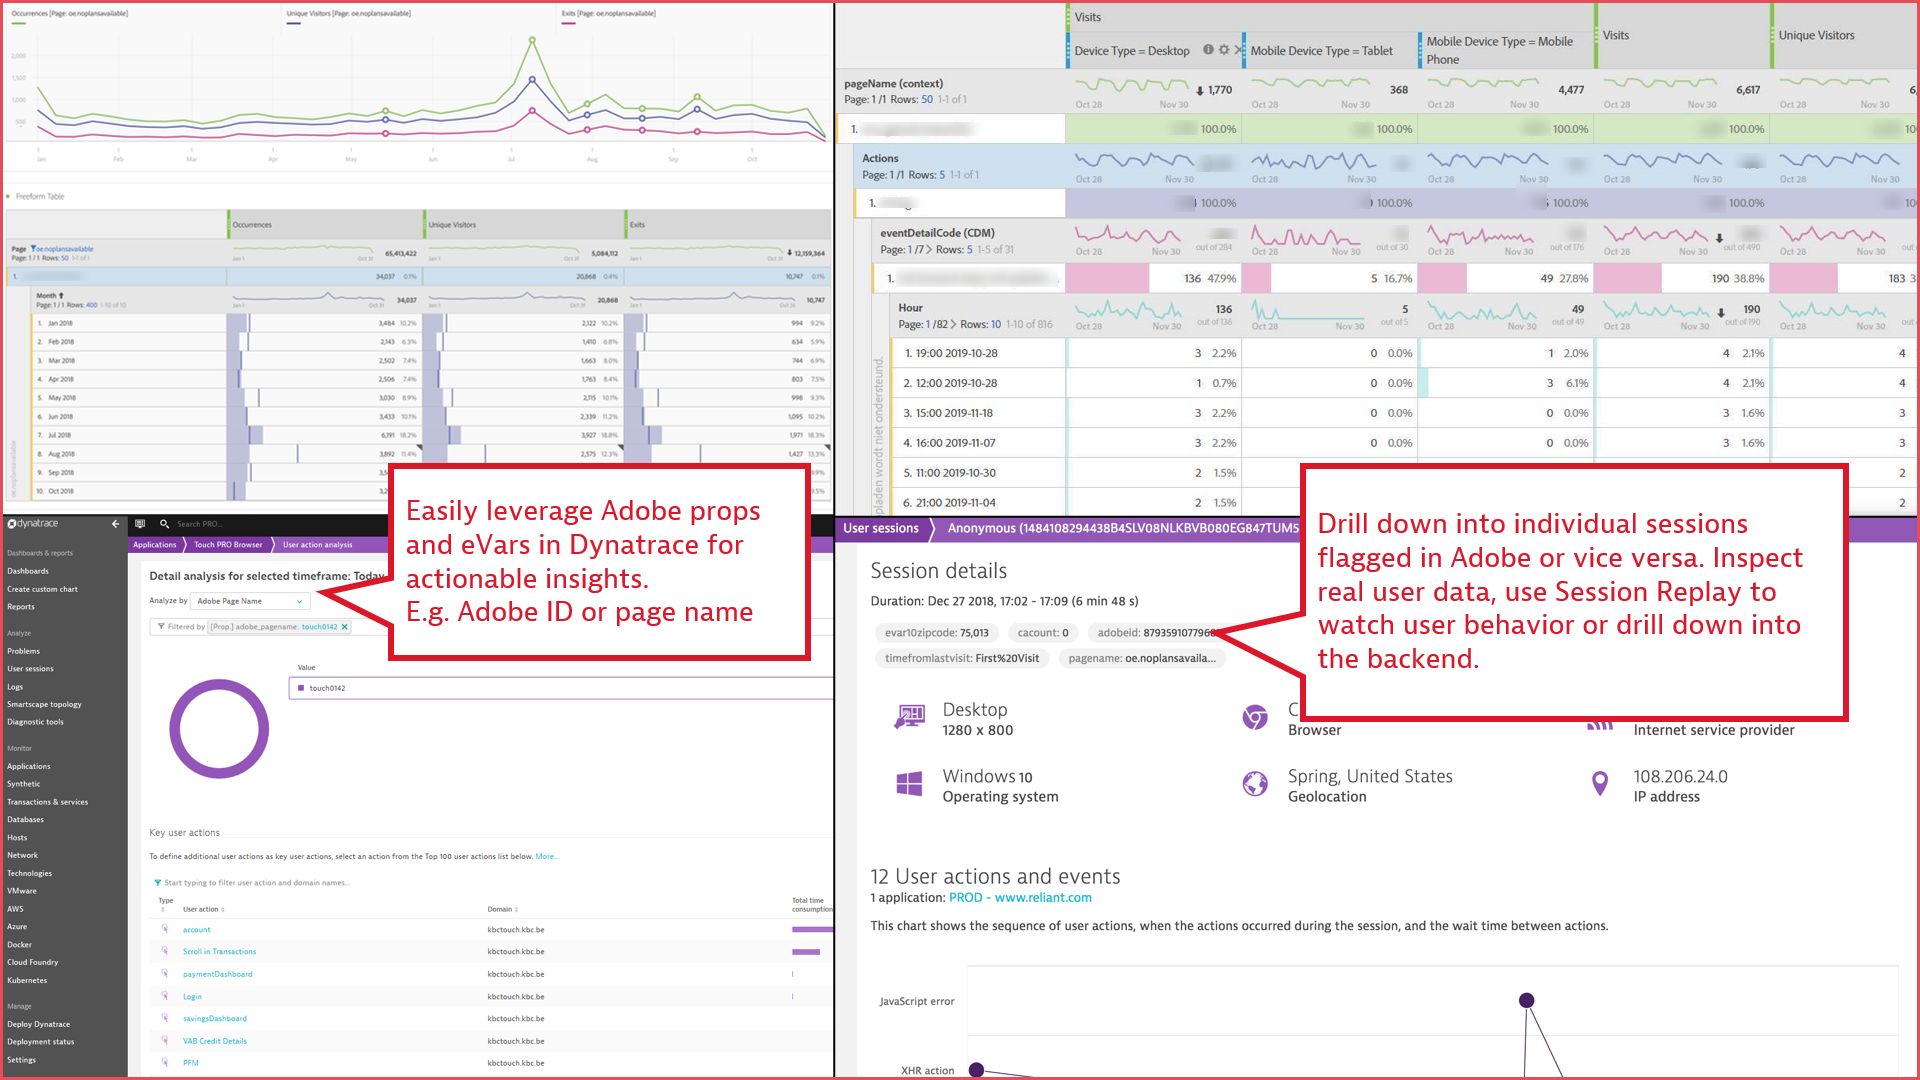
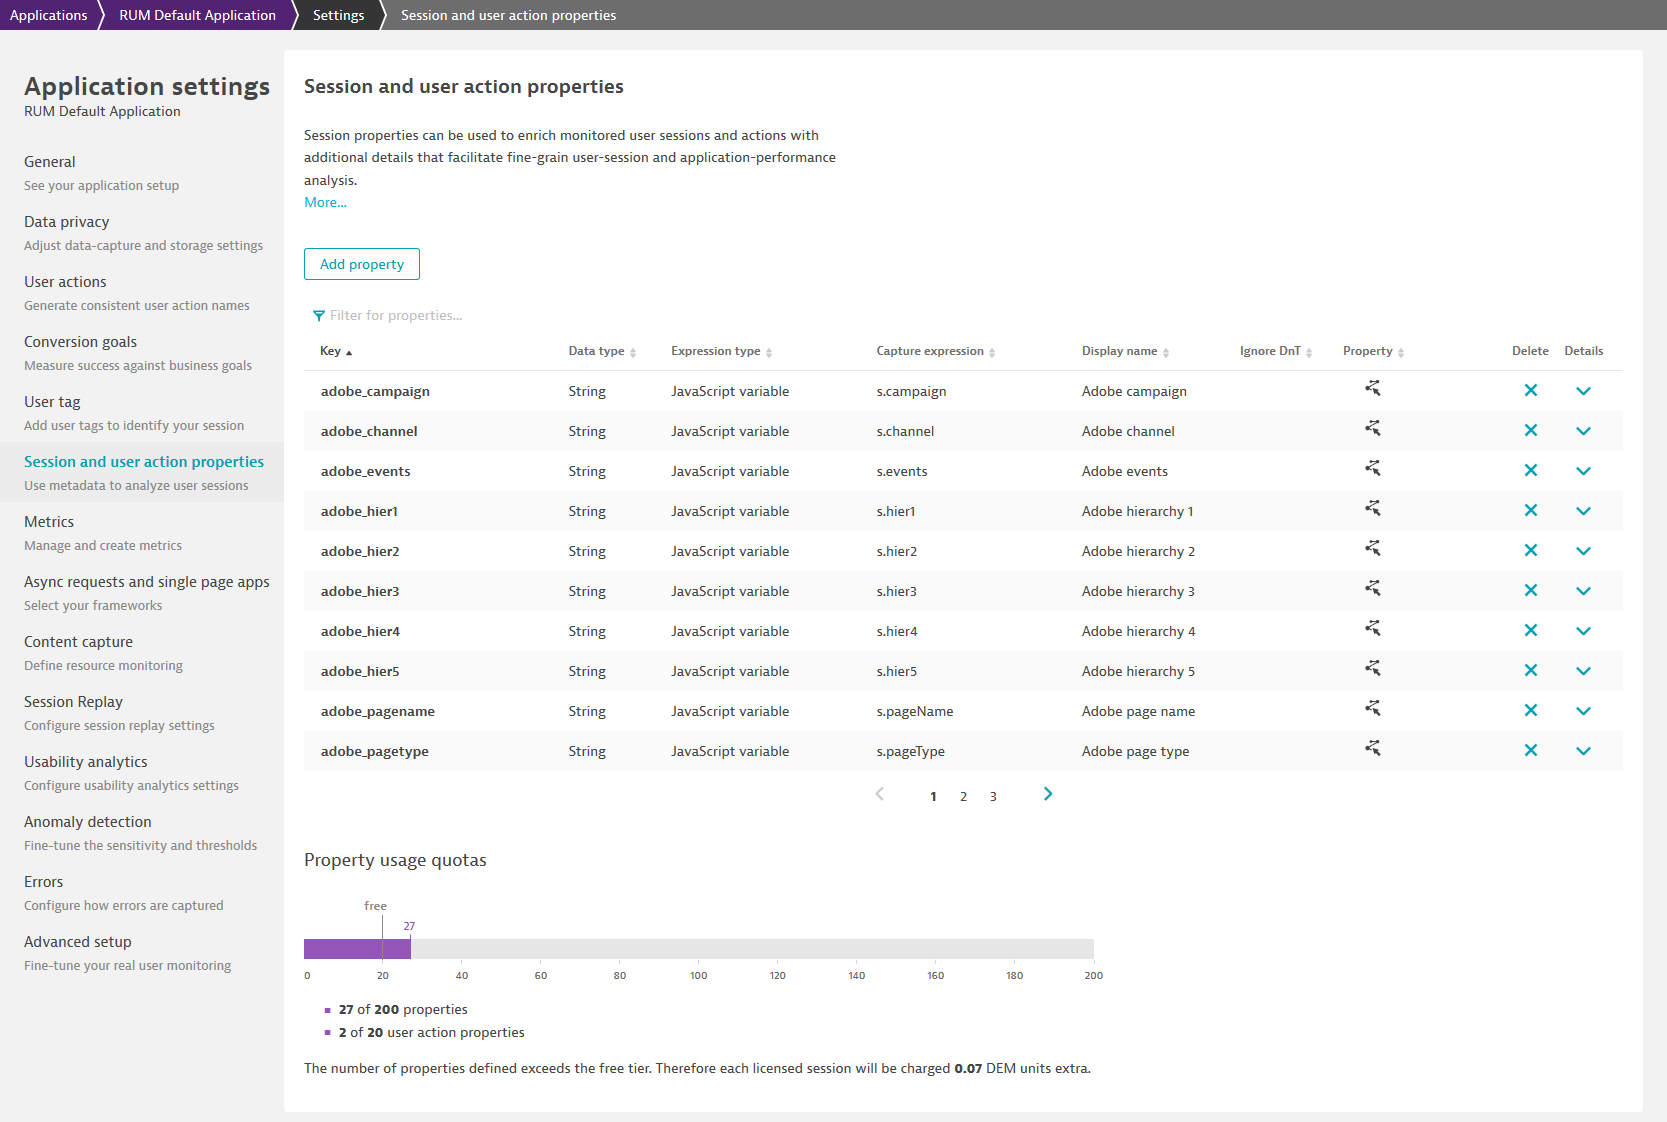
- Share business context like page names and customer segments—integration with Adobe Analytics makes props and eVars such as the Adobe ID and page name available in Dynatrace (see the image below). Thus, you can recreate segmentations and drill down into individual sessions.
- Leverage Dynatrace Session Replay to watch and understand individual user sessions.
- Get real-time answers in Dynatrace to understand exactly why business anomalies are occurring.
Easily integrate your tool of choice with Dynatrace, with a single click
As a first step, we provide one-click integrations for these tools:
- Adobe Analytics—add your most important Adobe insights with one click to link them easily to performance insights provided by Dynatrace.
- Google Analytics
- Intercom (Session ID)
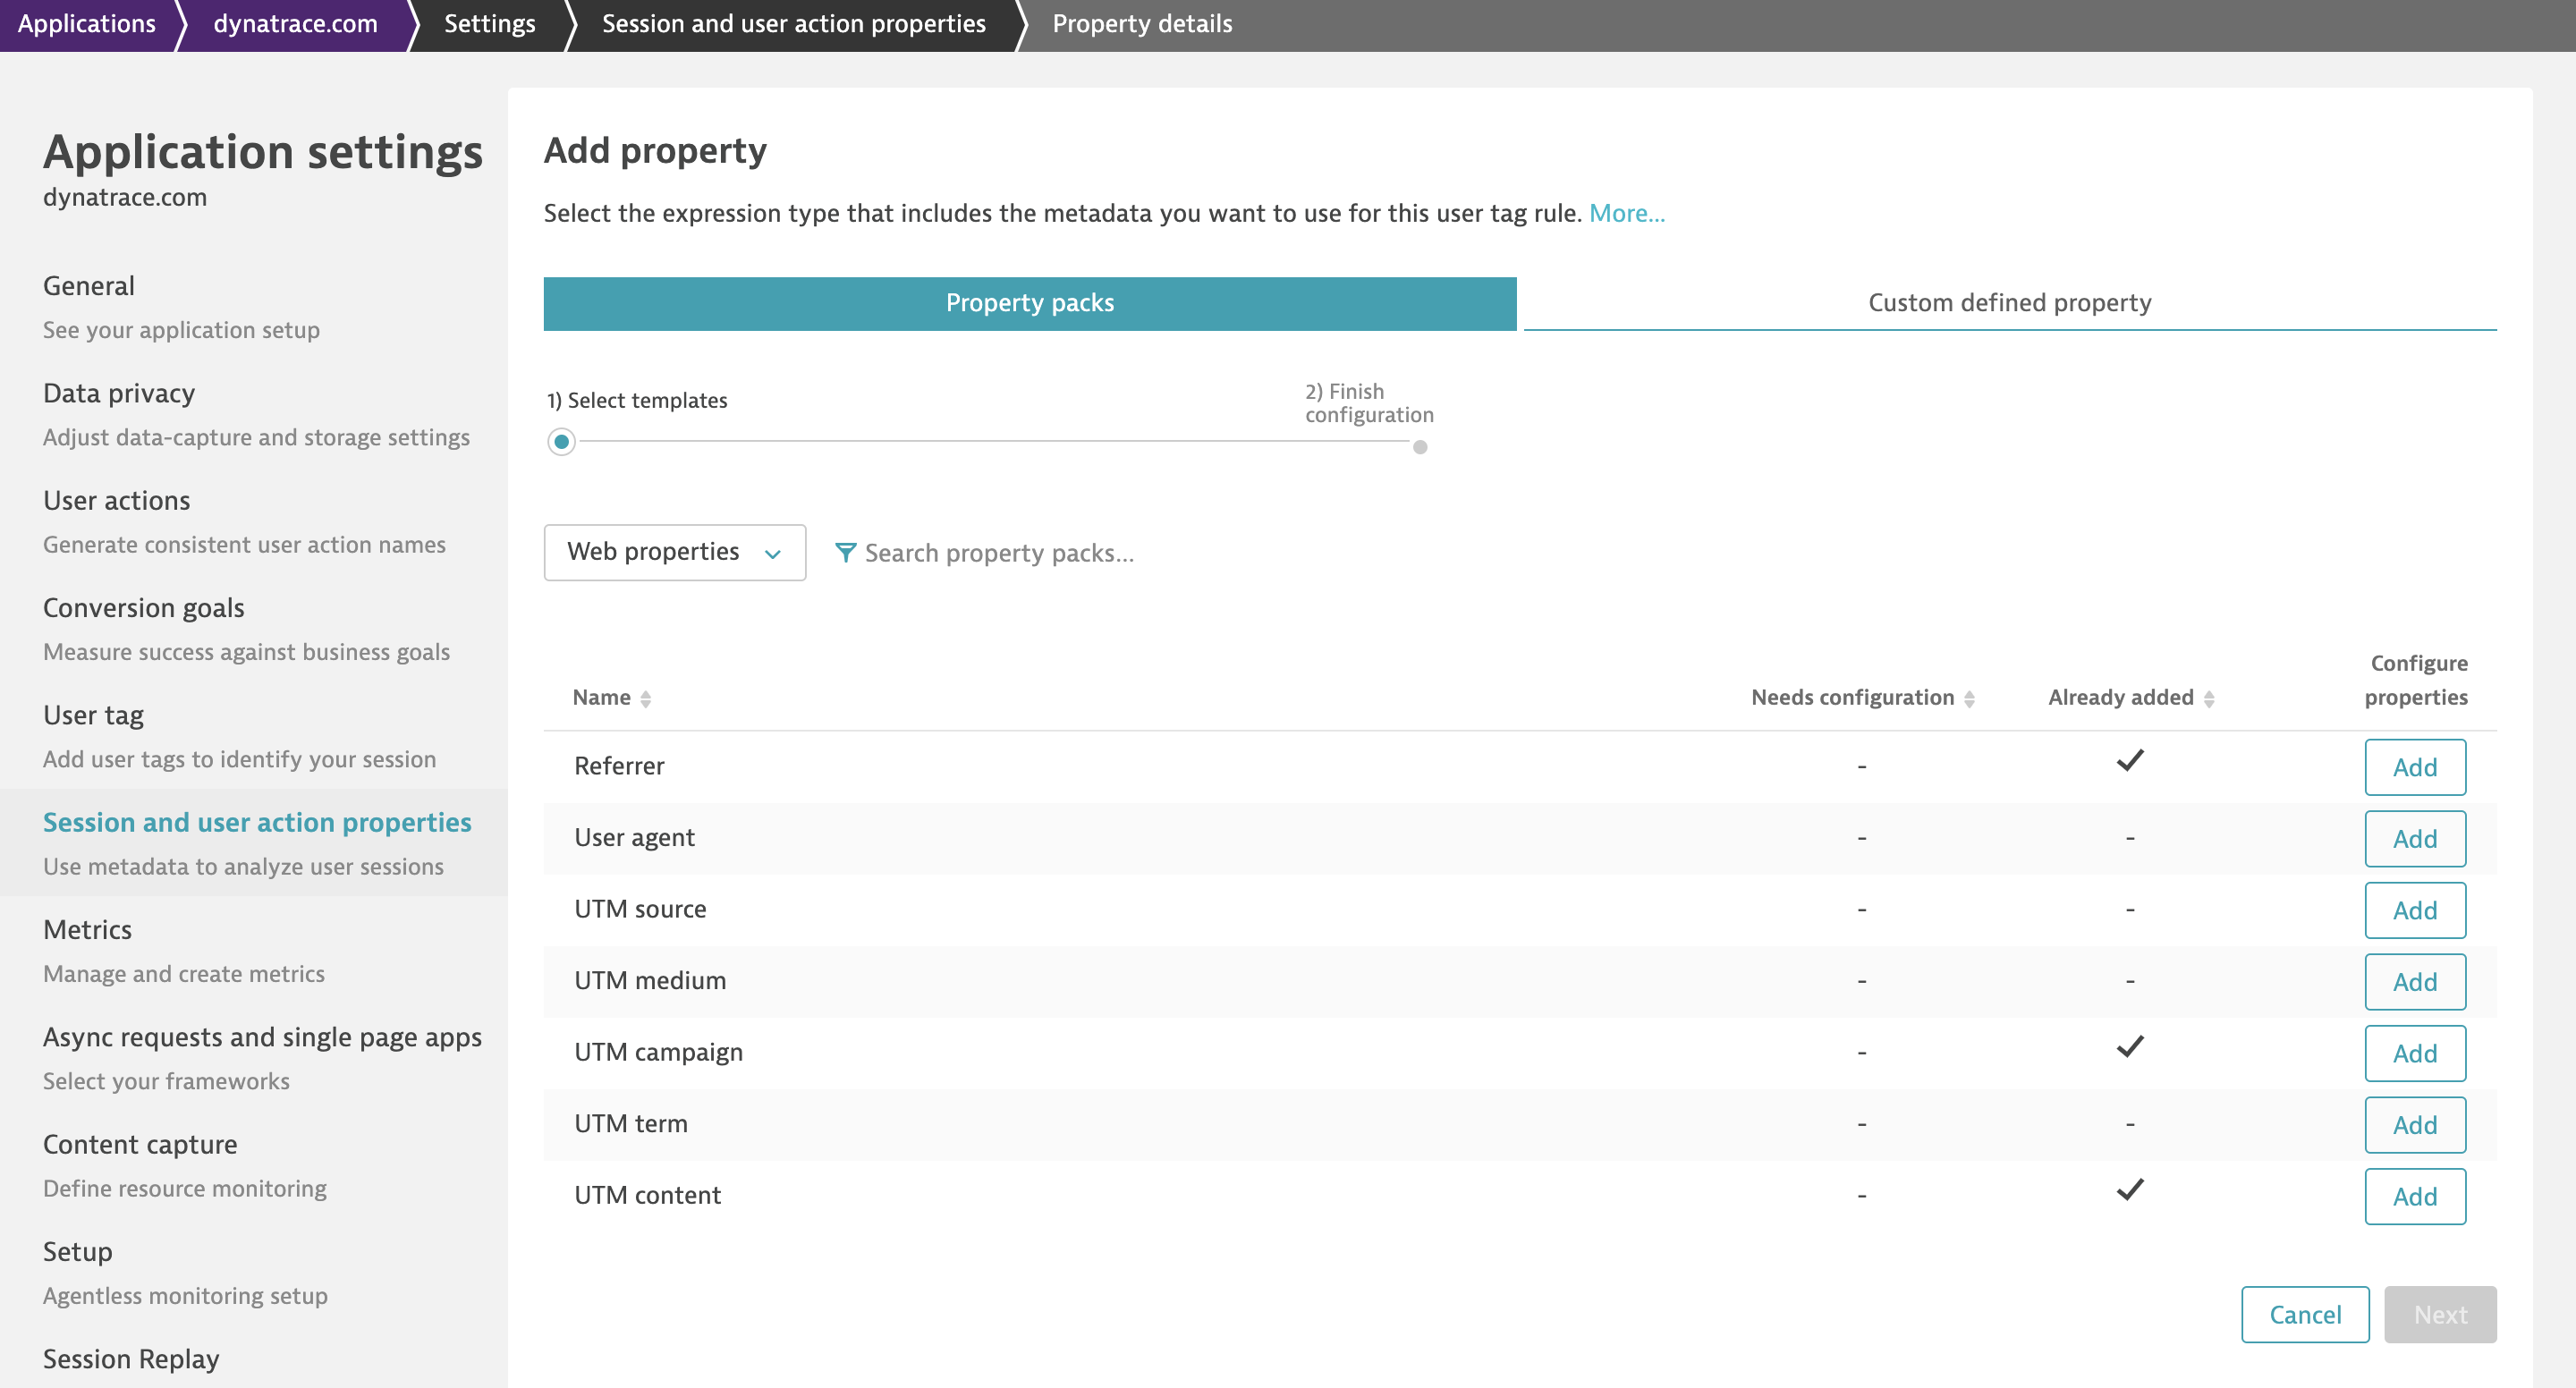
- Web properties (such as UTM parameters, referrer, and others)
Get actionable insights by tying together application performance, user experience, and business KPIs
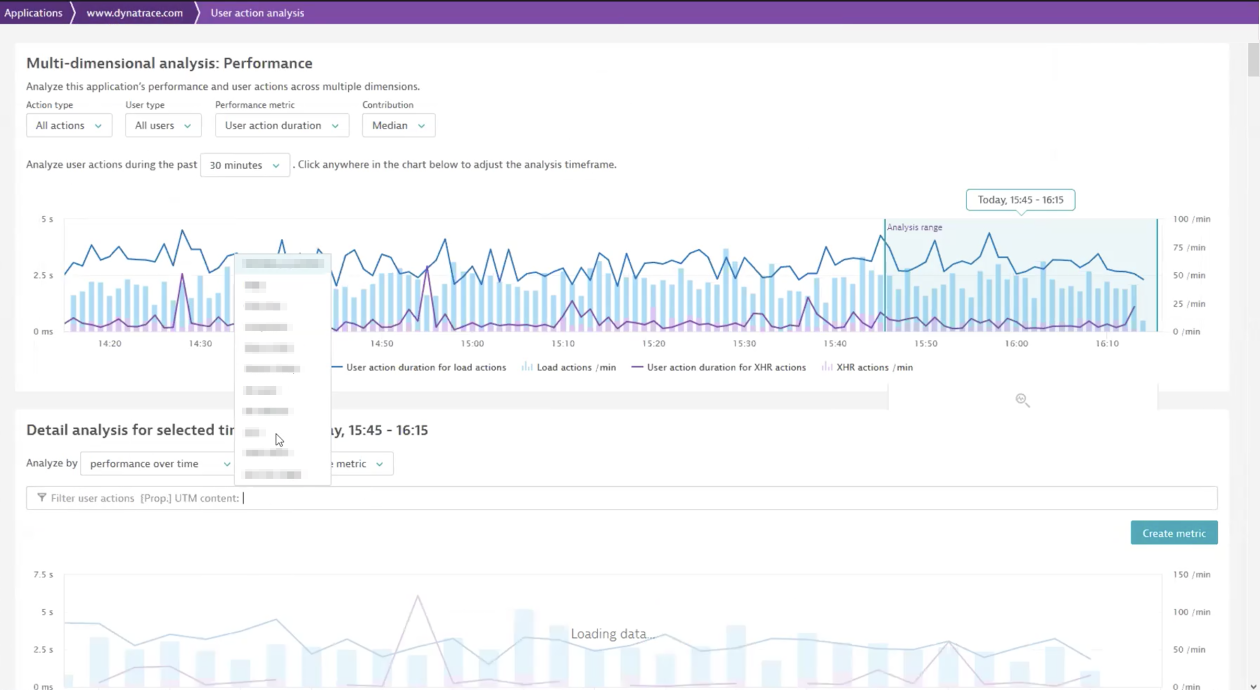
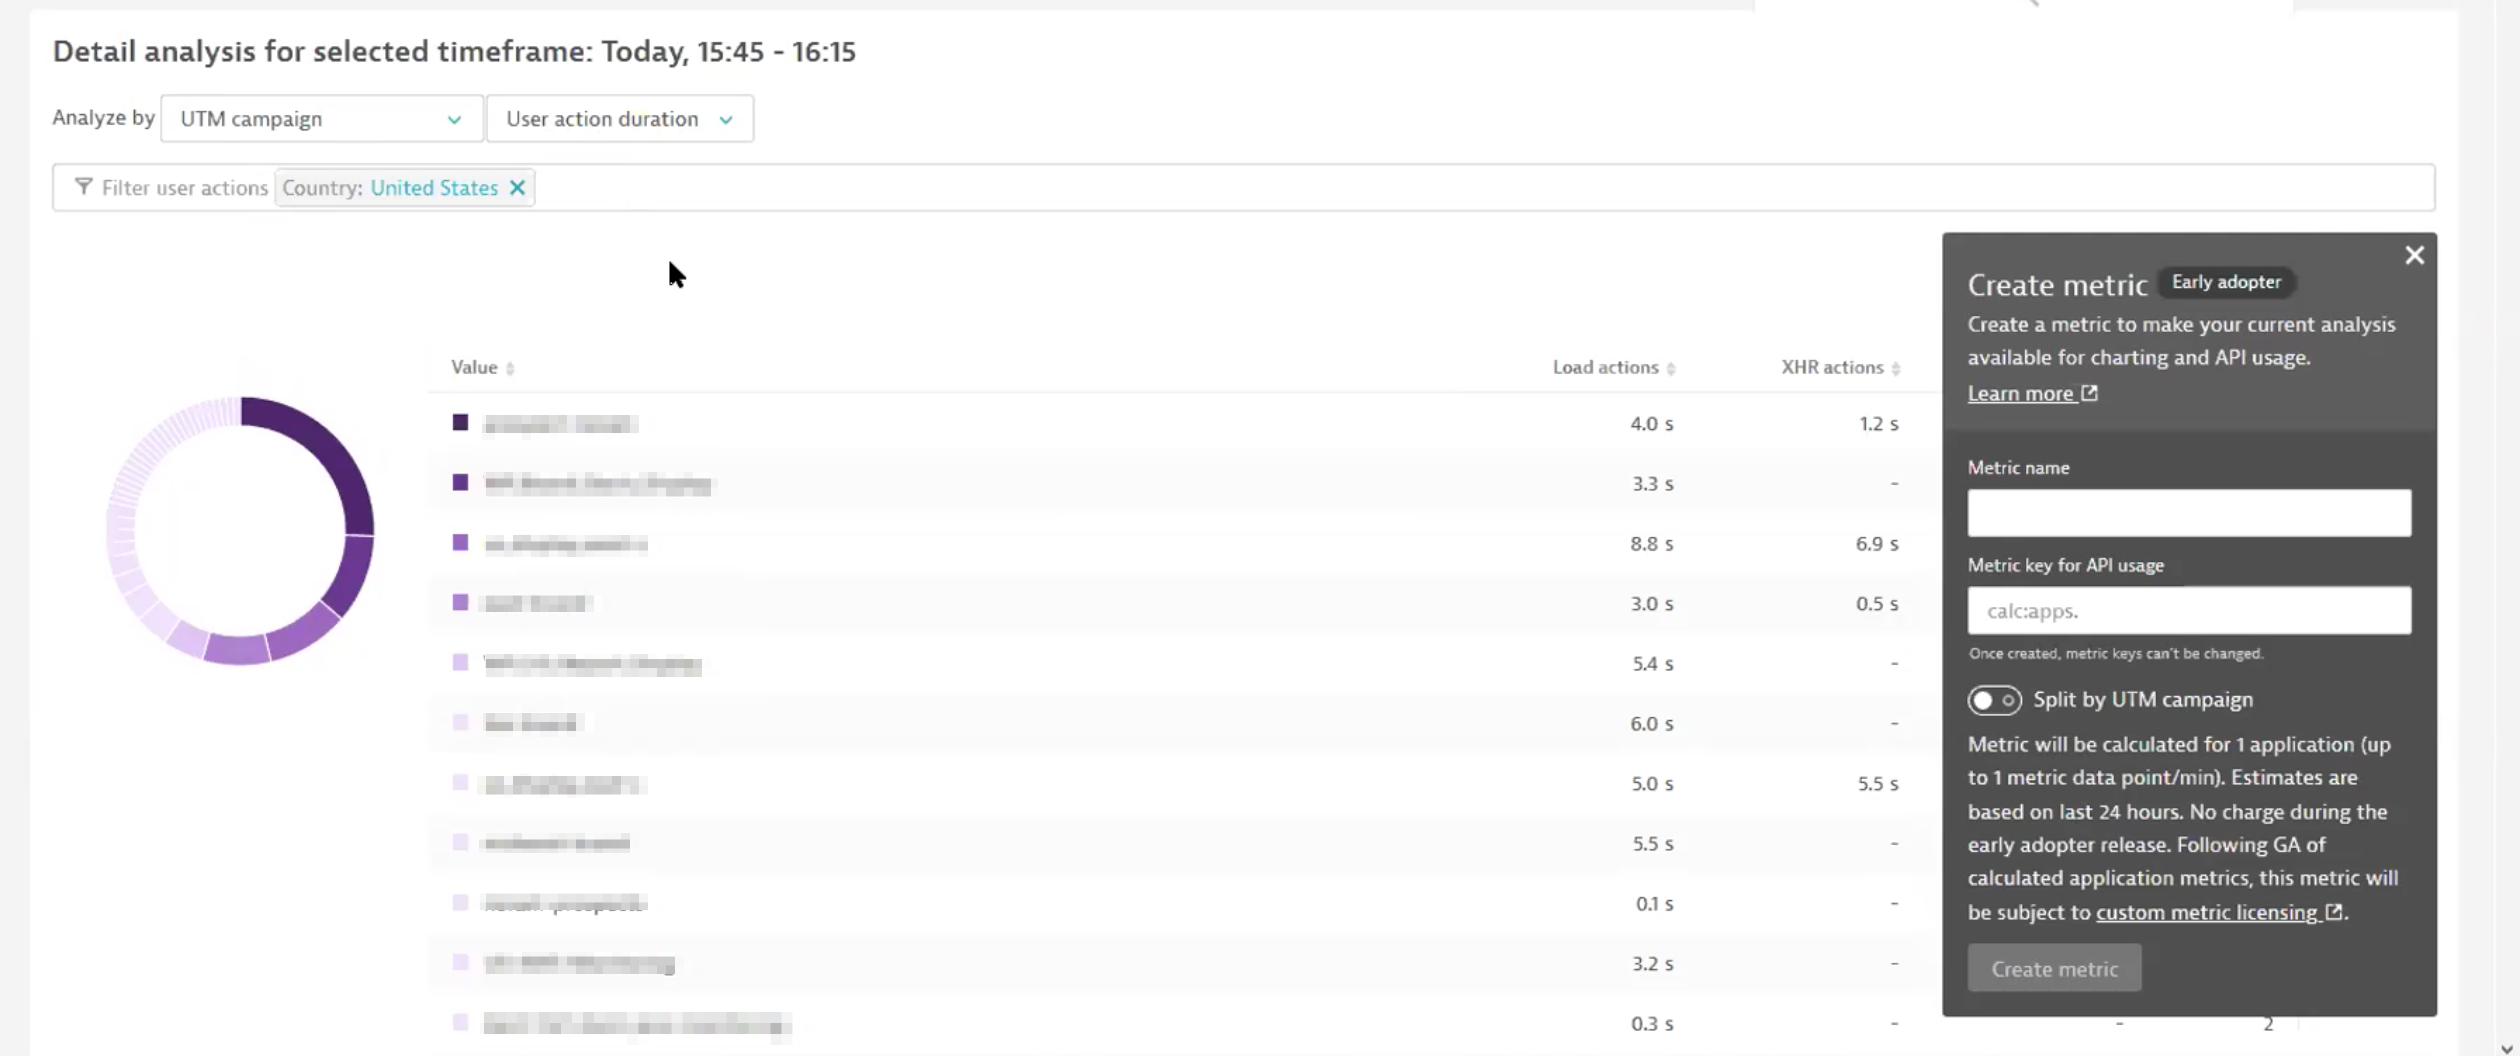
After easily setting up the properties of your analytics tool in Dynatrace, you can immediately use them with our multidimensional analysis (MDA) view. For example, to chart the slowest landing experiences by country for your application (see the image below), you can use the UTM content property in combination with the User action duration key performance metric filtered by a preferred country. And don’t worry, we preserve these filters when you delve deeper into your analysis, for example, by clicking on individual user actions.
You can then choose the key performance metric of your choice and create a new metric from it. This allows you to:
- Have the information available as a timeseries over months or even years.
- Alert based on your new metric.
- Query your new metric via the Timeseries API.
- Build custom charts based on the new metric to use in your dashboards—the image below shows how entering a name and selecting Create metric makes the new metric available for charting.
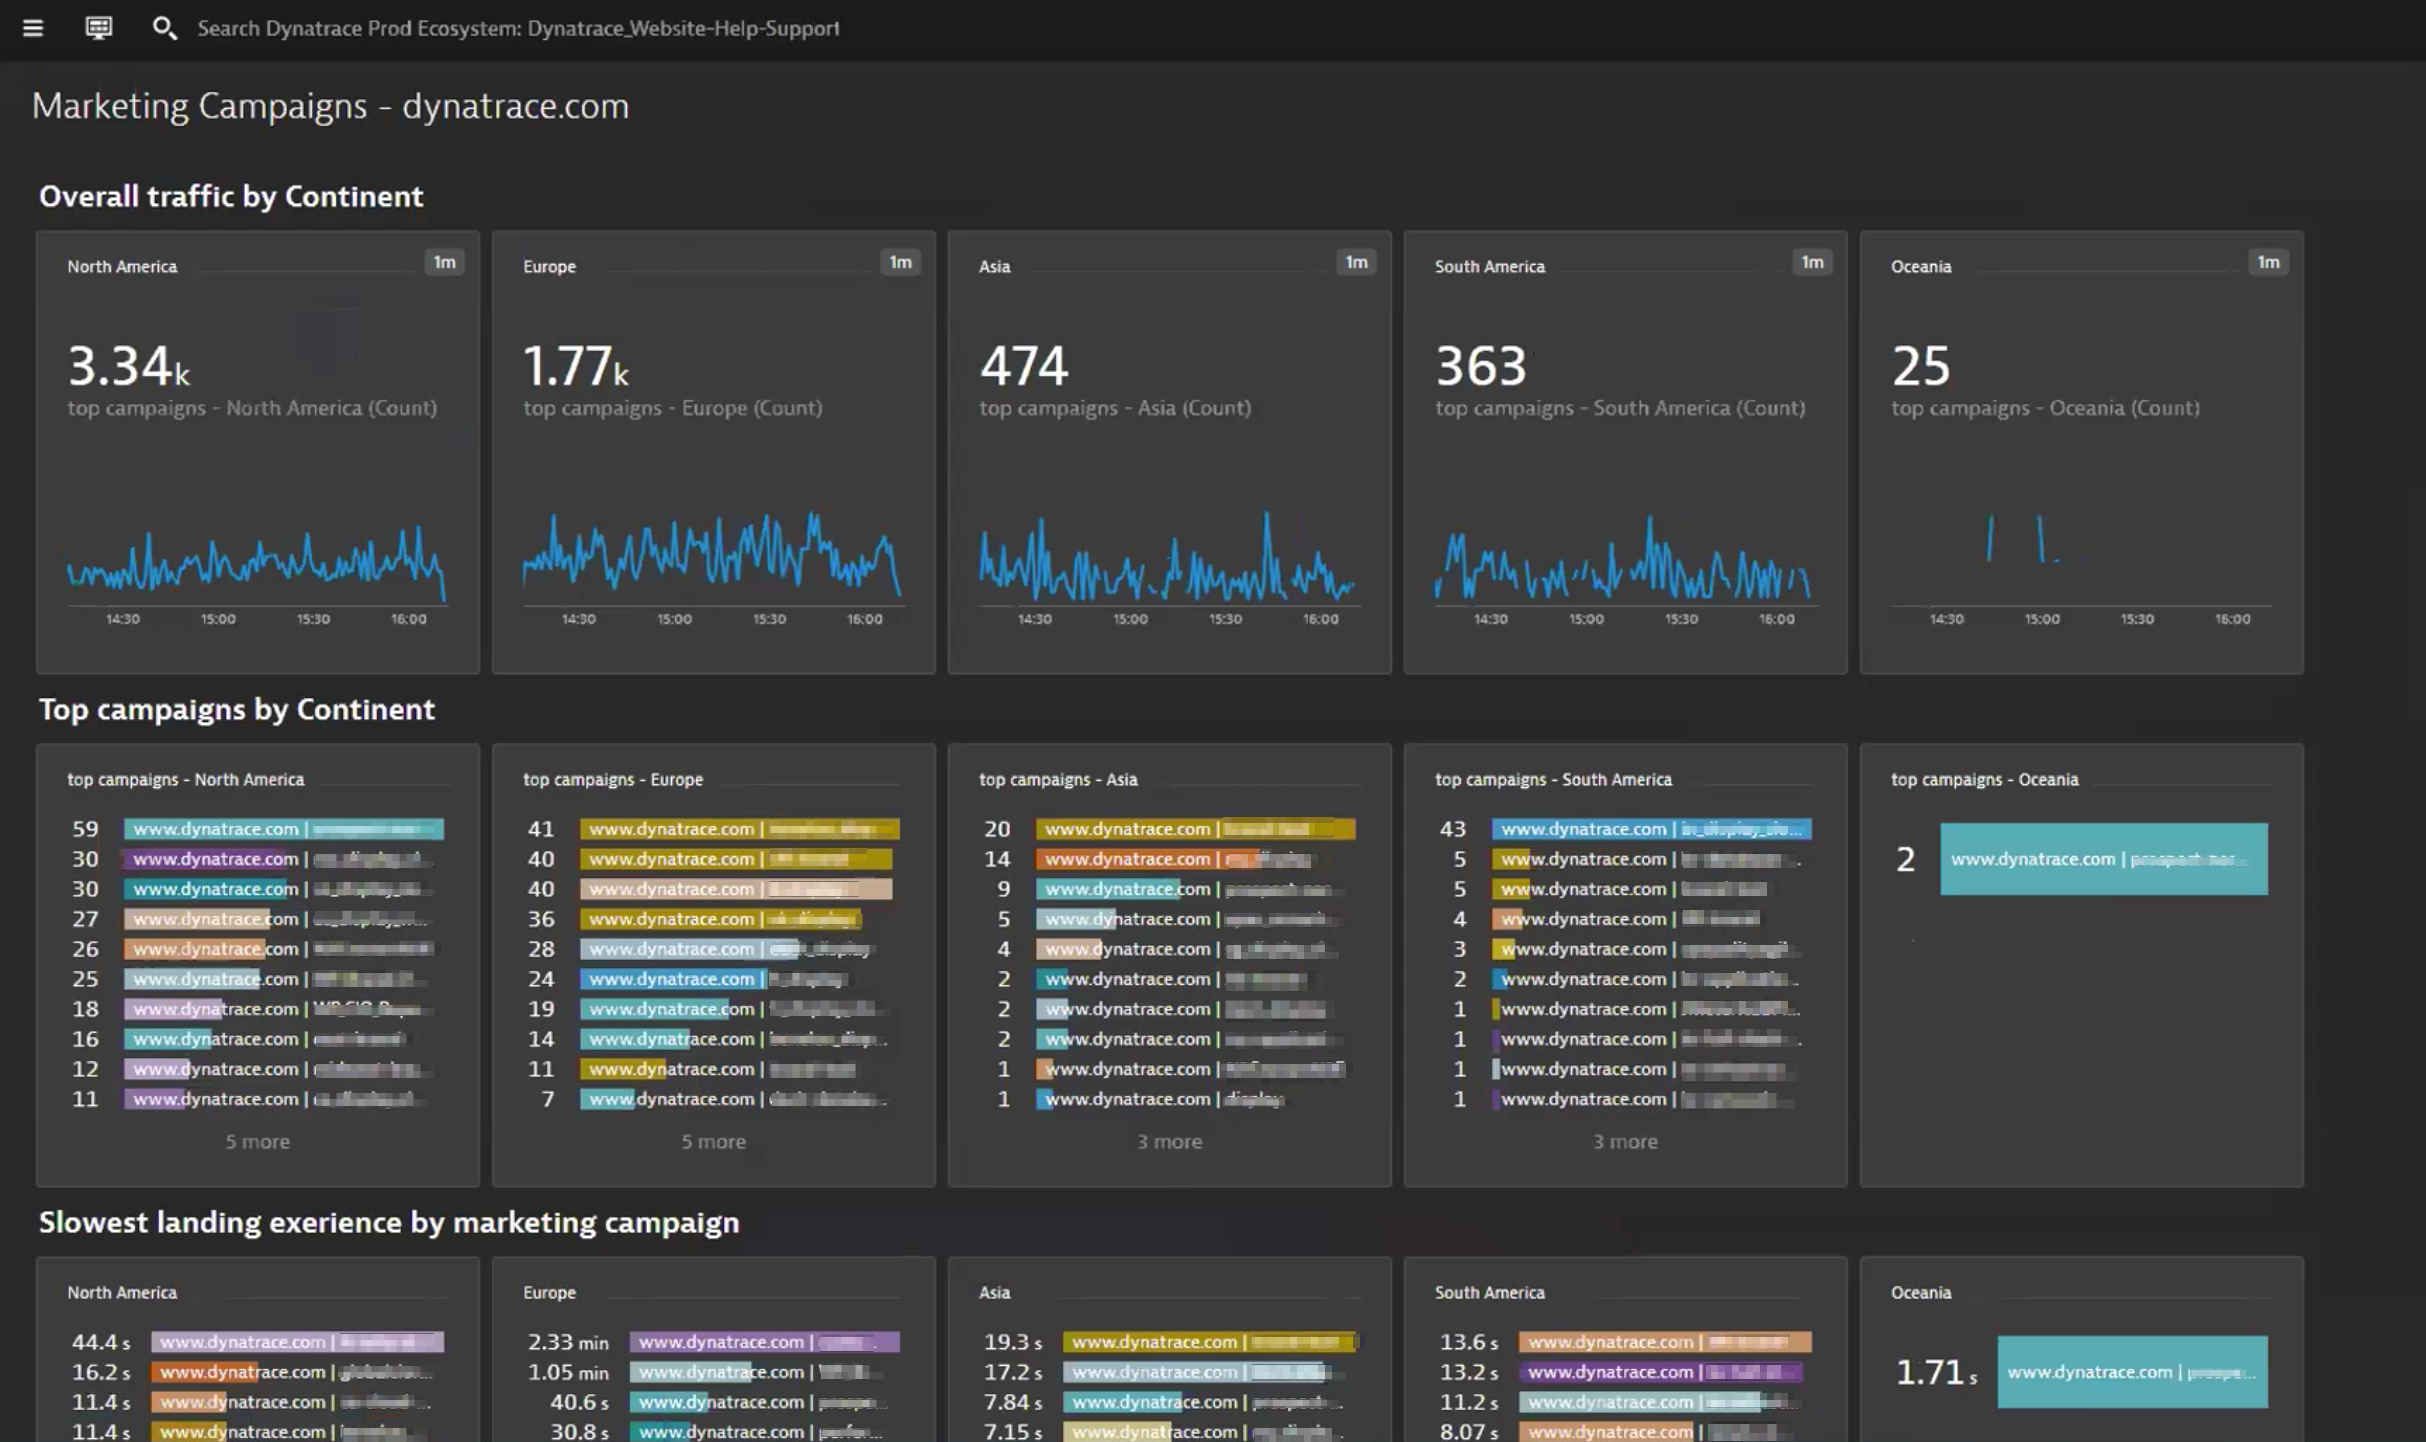
At Dynatrace, we’re already using the Web properties pack in combination with calculated metrics to chart and track the application performance of our marketing campaigns running on www.dynatrace.com.
Get started with just a few clicks
You can start using our new property packs with Dynatrace version 1.192, released for Saas and Managed environments respectively.
How to get started
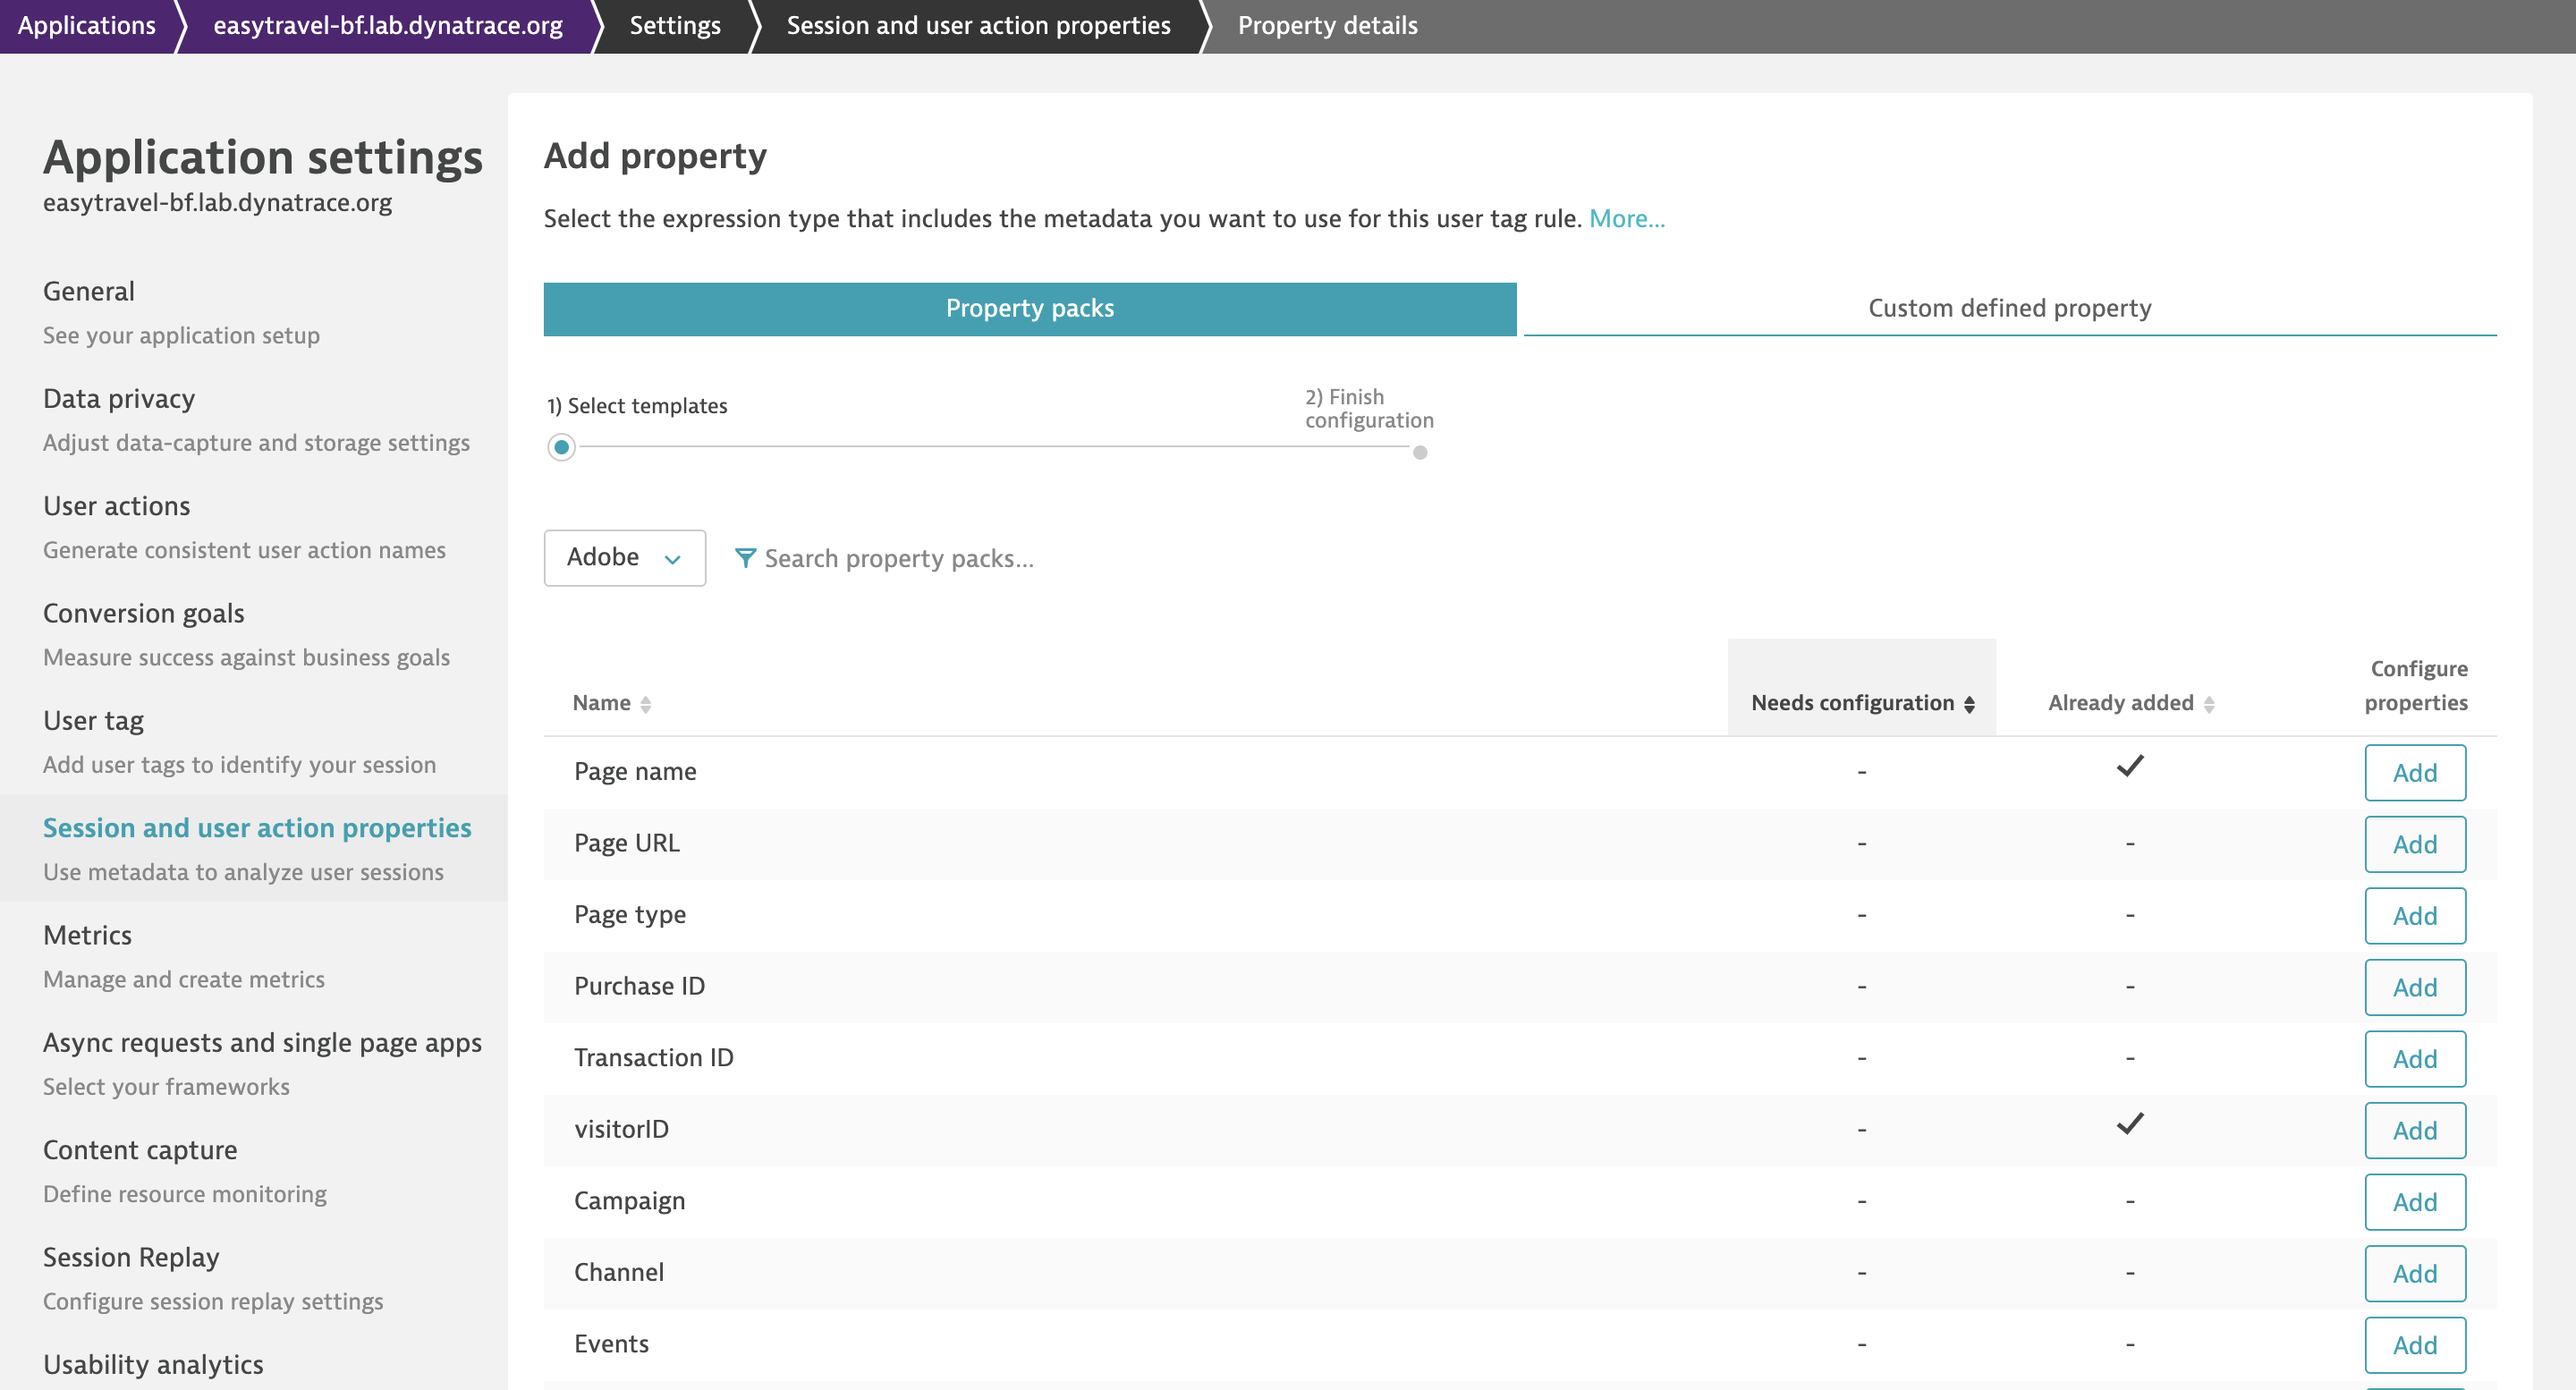
To capture these properties in Dynatrace, all you have to do is to select a property pack and the desired properties in your Session and user action properties application settings.
You can bring as many as 200 defined properties per application to enable your developers, architects, and marketers to speak the same language and join forces to optimize end user experience.
Note: Depending on your hosting type and location, you may only be able to leverage these 200 properties starting with Dynatrace version 1.194.
20 properties are included per application; additional properties will result in additional DEM unit consumption. You can check the new property usage quota under Session and user action properties in your application settings.
Prerequisites
- Dynatrace version 1.192+
- OneAgent version 1.185+
- For double and long properties, your need our RUM JavaScript tag version 1.187+
What’s next
Google Analytics, Adobe Analytics, and Intercom are just the start of the property packs we’re about to make available to you this year. We’re already looking into adding packs for A/B testing, personlization, chatbots, web analytics, ad providers, and CDN tools like:
- AppNexus
- Certona
- Clicktale
- Chartbeat
- Dynamic Yield
- Optimizely
- Cloudflare
- LiveChat
- PubMatic
- Permutive
- Riskified
- Zopim
- and more…
If you have any particular tool in mind that should be on our list for future releases, please reach out to us by posting your suggestion in the Dynatrace Community user forum.
And if you have read thus far…
There’s no doubt you’ll be interested in Part 2 of this blog series, where we’ll show how you can quickly improve customer experience by translating performance insights into the language of your web analytics tool, so stay tuned!


Looking for answers?
Start a new discussion or ask for help in our Q&A forum.
Go to forum