
In the recent years, I have blogged about how Dynatrace Labs approaches certain aspects of software engineering, continuous integration, continuous delivery or as we call it CDF (Continuous Delivery & Feedback).
This current blog post was triggered by a discussion I had with Dietmar Strasser, Acceptance Test Team Lead, in our lab in Linz. Our Acceptance Test team runs tests against the latest builds of Dynatrace in different test environments (dev, staging …). They primarily leverage Selenium as Functional Test tool monitor Dynatrace, the Application Under Test (AUT), with Dynatrace. So – it is Dynatrace on Dynatrace so to say. 😊
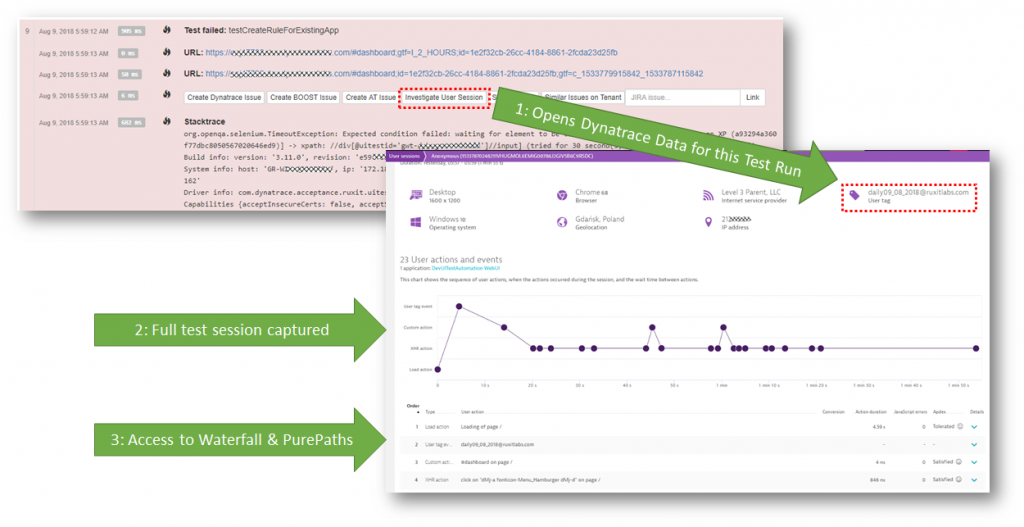
To speed up functional test result analysis Dietmar’s team found a smart and creative way to integrate Selenium with Dynatrace RUM (Real User Monitoring). In case a functional test fails or is slower as previous runs, testers and developers get a customized link in the test result report that opens up a Dynatrace RUM dashboard, showing all data of that specific test run. This data includes every single click including waterfalls, JavaScript exception details and soon a video replay through our upcoming Session Replay feature. This link eliminates the manual step of searching for the relevant RUM data, which saves time during triage and also reduces the need to educate new hires on how to navigate and search through the captured data in order to find what they are looking for!
The following screenshot shows how this looks like in the test result report the Acceptance Team generates: It’s really just a single click!
This integration is part of their fully automated Acceptance Test Environment and is therefore available for every test executed. The following diagram shows which tools they are using, how they are integrated and where Dynatrace comes into play it comes to monitoring:
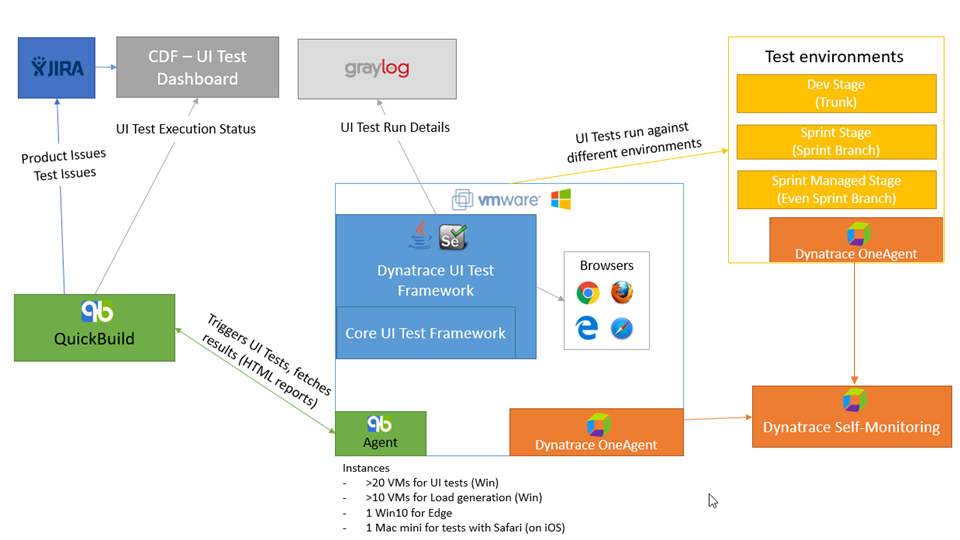
While other teams within Dynatrace engineering have moved to Jenkins, the Acceptance Testing Team still uses QuickBuild, which was historically used more broadly within Dynatrace. The team has built several integrations over the years that enable the level of automation they have. In this moment there would be no real benefit for them to move to a different CI platform.
Based on the diagram above, you can see that Dynatrace OneAgent’s not only monitors the different Test Environments (Dev, Sprint, Sprint Managed). Dynatrace is also used to monitor the VMs that run the Selenium tests to detect any potential issues with the VMs. This allows them to eliminate bad test runs caused by an unhealthy test environment. I personally consider it as a best practice to monitor all your tools and systems, as you don’t want to troubleshoot issues based on a flaky test framework!
Alright! Are you ready to learn more? Ready to try it yourself?
If you are familiar with Dynatrace, the OneAgent and Dynatrace RUM, you can skip the next section where I give a quick overview of how Dynatrace works and how the Acceptance Test Team instruments their test environment. After that, we discuss integration options with Selenium – or in that respect – with ANY other functional testing tool that drives a browser.
Step #1: Enabling Dynatrace in the Acceptance Test Environment
If you do not yet have Dynatrace in your environment, simply sign up for a Dynatrace SaaS Trial or reach out to our teams and ask for a Managed (On Premises) trial. Once you have access to your Dynatrace web interface, simply follow these steps to install a OneAgent on those machines where your Application Under Test (AUT) will be running. Feel free to watch my “What is Dynatrace and How to get Started” YouTube Tutorial or any other tutorials we have on our YouTube channel that show you how to monitor applications running on physical, virtual, cloud hosts, containers, Kubernetes, OpenShift, CloudFoundry or in any other PaaS or even SaaS platform. Once installed, Dynatrace OneAgent will automatically instrument your application and automatically enables Real User Monitoring without having to modify and code or configuration files!
Validate data gets captured correctly!
I always recommend validating that Dynatrace captures RUM and backend data in the way you expect it. That can either be done by running parts of your functional test suite or by simply opening a browser and manually hitting a couple of pages of your application you want to test.
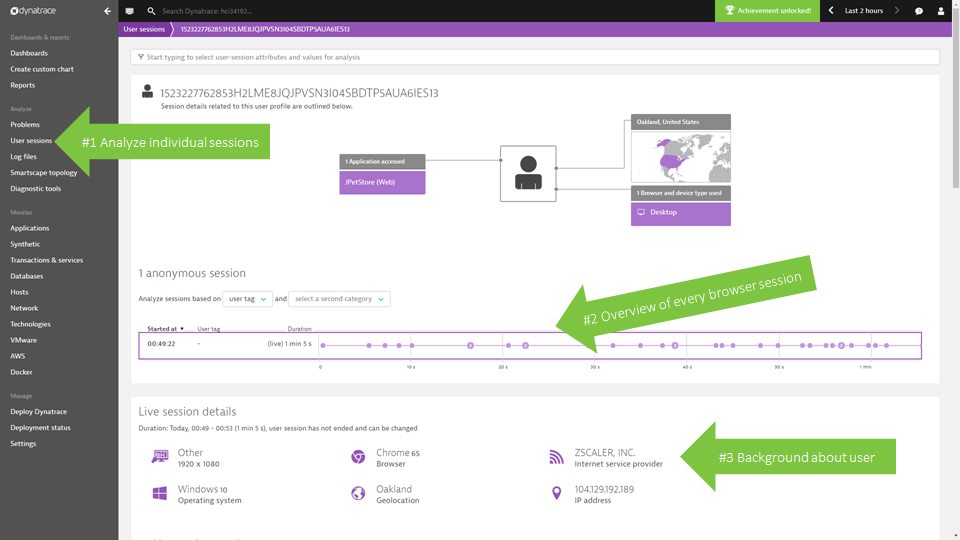
After that is done navigate to the User sessions dashboard, pick your just simulated user (it may take up to 1 minute until your user session shows up) and explore the data captured:
There are several configuration options available that allow you to optimize how and what type of data Dynatrace captures, e.g: if your web application uses certain JavaScript frameworks (Angular, jQuery, …) you can enable support for those. Have a look at the Real User Monitoring doc pages or watch my YouTube video on Getting Started with Dynatrace RUM.
Configure User Tag Capturing
If your application has a login form, you can instruct Dynatrace to capture that username and assign it to the captured user session. This makes it easier to identify a specific session, e.g: identify your test user from other users on the system. You can configure this in the application configuration settings by either specifying a CSS Selector, JavaScript variable or the name of an HTML Meta tag to be evaluated by the Dynatrace JavaScript agent. More details on how to configure user tag capturing in the documentation pages or in my YouTube video on Advanced Real User Monitoring.
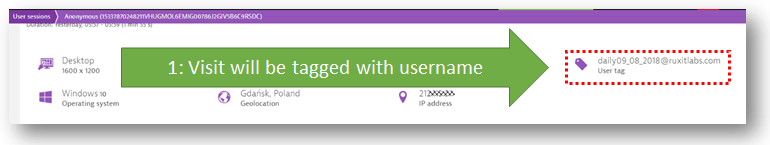
From now on every test (manual or automated) that gets executed against your application under test will automatically be captured by Dynatrace as a visit and you will be able to easily identify a specific run through username.
Step #2: Integrating Dynatrace with Selenium
Having Dynatrace installed in the test environment where you deploy your AUTs automatically gives you full visibility into every single manual or automated test execution. On top of that we can enable a couple of additional integrations that will make your life even easier:
- Pass test context (test or script names) to the captured Dynatrace user session
- Create links to Dynatrace dashboards for easier data lookup
- Pull data from Dynatrace into your functional test results
Let’s tackle it one by one:
1. Passing test context to a Dynatrace User Session
If you have configured User Tag capturing as explained earlier, you already have additional context information when analyzing captured data, e.g: the test user ID you use when logging in to your site during the test. If you re-use the same user ids for every test run – which I assume is very likely – but you want to do an automatic lookup of test user ABC from test run Sept 30th on Build 256 you can do this by passing a customized user tag to the Dynatrace Visitor.
This is made possible through the Dynatrace JavaScript SDK that is automatically available for every instrumented application. Tools like Selenium allow you to execute JavaScript that runs within the browser context which allows passing this type of context from your test script to Dynatrace.
Here is a helper function I wrote using dtrum.identifyUser. Feel free to use this function for your own scripting or modify it to your needs:
/**
* Passes the userNameTag to the Dynatrace captured Visitor via dtrum.identifyUser
* @param browser Selenium browser object
* @param testUserName tag value for Dynatrace Visitor Tag
*/
function setDynatraceUserTag(browser, testUserName) {
browser.execute(function (tagValue) {
if(dtrum) dtrum.identifyUser(tagValue);
}, testUserName);
}
In the Dynatrace Acceptance Test Team, they generate a unique user tag for each test they run. I am sure you have noticed it earlier when looking at the screenshots, e.g: daily09_08_2018. That session identifies the daily regression suite that got executed on Aug 9th 2018! This convention makes it very easy to open the details of the whole test run or even the waterfall of a single test step and analyze it:
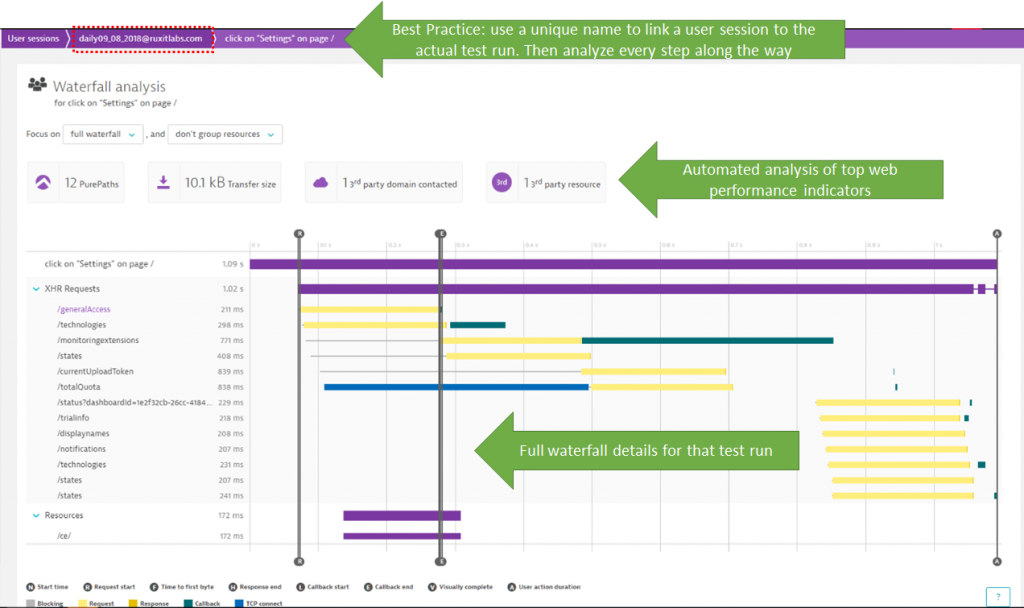
At a recent implementation workshop with a customer, their automated testing team decided to pass the Jenkins Build ID to their Selenium script and add this to the user tag, e.g: LoginTest_JenkinsBuild_23. I am sure you will pick the best approach for your testing processes!
2. Create Links to Dynatrace Dashboards
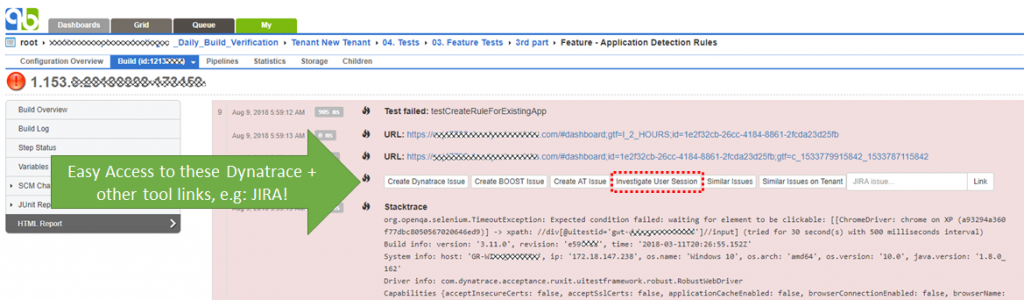
When Dietmar showed me his nicely rendered test results page in QuickBuild I was intrigued to learn more about “the magic” behind the “Investigate User Session” button. Turns out, it is not that hard to do if you know what type of link you need to generate. Dietmar was gracious enough to share the function they use internally to generate that link. It gets called from their Selenium script at the end of each test case execution.
Instead of sharing their code I went ahead and created my own version which I hope serves you well as a template for your scripts. My function tries to get the rxVisitor cookie which is present in case your navigated to a page that is instrumented with Dynatrace. If that is the case, we use that value and pass it via “id=-<rxCookie>” (be aware of the leading minus symbol) to the web dashboard. If that cookie is not present we have a fallback option to search by testUserName.
Start and end time custom timeframe filters can additionally be passed. This option allows generating a general link to all visitors that were captured for your complete functional test suite.
/**
* Generates a link to the Dynatrace Visitor Overview Dashboard for one specific user (if rxVisitor cookie is present) or filtered by username.
* Optionally enables a timeframe filter
* @param tenantURL Dynatrace Tenant Base URL, e.g: https://<LIVEID>.live.dynatrace.com or https://<yourdtserverurl>/e/<yourenvironmentid>
* @param startTime If > 0 will be used as start time for custom timerange filter
* @param endTime If > 0 will be used as end time for custom timerange filter
* @param testUserName If rxVisitor cookie is not available the dashboard link will search for this username
* @param browser Selenium browser object
*/
function generateDynatraceVisitorLink(tenantURL, startTime, endTime, testUserName, browser) {
var rxVisitor = browser.getCookie("rxVisitor");
var dashboardLink = tenantURL + "#usersearchdetailuser";
if (rxVisitor != null && rxVisitor != "") {
dashboardLink += ";id=-" + rsVisitor;
} else {
dashboardLink += ";filtrFilterSessTags=s" + testUserName;
}
if((startTime > 0) && (endTime > 0))
dashboardLink += ";gtf_c" + startTime + "_" + endTime
return dashboardLink;
}
At a recent implementation with a customer, we generated the link as described above and logged it to stdout which eventually ended up in the Jenkins output log. That made it easy for developers to scan the Jenkins console output and navigate to the dashboard that shows exactly the captured user of that test run.
The Dynatrace Acceptance Test team went a step further and produced a nice HTML formatting so that the Dynatrace and some other links, e.g: to Jira show up as buttons in the Quick Build result view. If you want to learn more about their formatting let me know and I get you in touch with them:
3. Pull Data from Dynatrace into Test Results
One of Dynatrace’s strengths lies within its automatic baselining, the anomaly detection and the fact that problem tickets get opened whenever there is an impact to your end users, availability or overall system health. This works extremely well in production or systems that see constant load where there is enough consistent data for baselining.
For environments with more “sporadic” load – such as a functional test environment – I propose to leverage the Dynatrace REST APIs at the end of your test suite execution and pull key data points from RUM via the USQL (User Session Query Language) API as well Timeseries and Smartscape data for your applications and services.
In my recent workshop with a customer we came up with a couple of interesting use cases:
#1: Add Dynatrace Real User Error and Performance metrics to test result
At the end of the test, query metrics such as JavaScript error count, failed request count, size and response time information for exactly the executed test via USQL. If you have passed a unique test user name as user tag you can filter on that value in the USQL where clause. Now we have more out-of-the-box diagnostics metrics captured by Dynatrace in your Selenium Test Result!
#2: Validate Environment Health before starting test execution
Too often test results are invalid because the application was not in a healthy state to begin with. As a pre-test check you can either query USQL or the Timeseries API for current failure rate on the application level or on individual visitor sessions. If you already see a high failure rate in the application of activity of other tests that get executed, then why even bother executing more tests? You can make this decision by simply looking at the Dynatrace RUM metrics!
#3: Query user sessions with similar errors after test failure!
A common question after a test fails is: is it just this test or are other tests failing as well for similar reasons? You can either do this manually after you see that tests are failing by looking up all visitor data captured while your tests were running and looking for similar errors – OR – you use USQL and simply query for all visitors that e.g: also saw JavaScript errors on that particular User Action. In our recent workshop one of the attendees wanted to log out all other visitors that had similar issues than the one the test ran into. Knowing how other users ended up in the same problem makes it easier to fix that issue for all the different click paths!
I am sure there are more use cases we can come up with but these 3 are a good start!
Thanks, Dynatrace Acceptance Team
I want to say Thank You to Dietmar and the rest of the Acceptance Test Team for sharing some of the internals on how they contribute to our CDF (Continuous Delivery and Feedback) philosophy. The key aspect here is that important metrics are easily accessible for every developer in the tools they are using anyway, e.g: Jenkins.
For everyone out there that wants to give this a try simply follow the steps laid out in this blog. It starts with getting your own Dynatrace Trial and installing the Dynatrace OneAgent in your test environment. If you have any questions don’t hesitate to leave a comment or ask our experts through the in-product chat channel or our online discussion forum.


Looking for answers?
Start a new discussion or ask for help in our Q&A forum.
Go to forum