
Synthetic monitoring
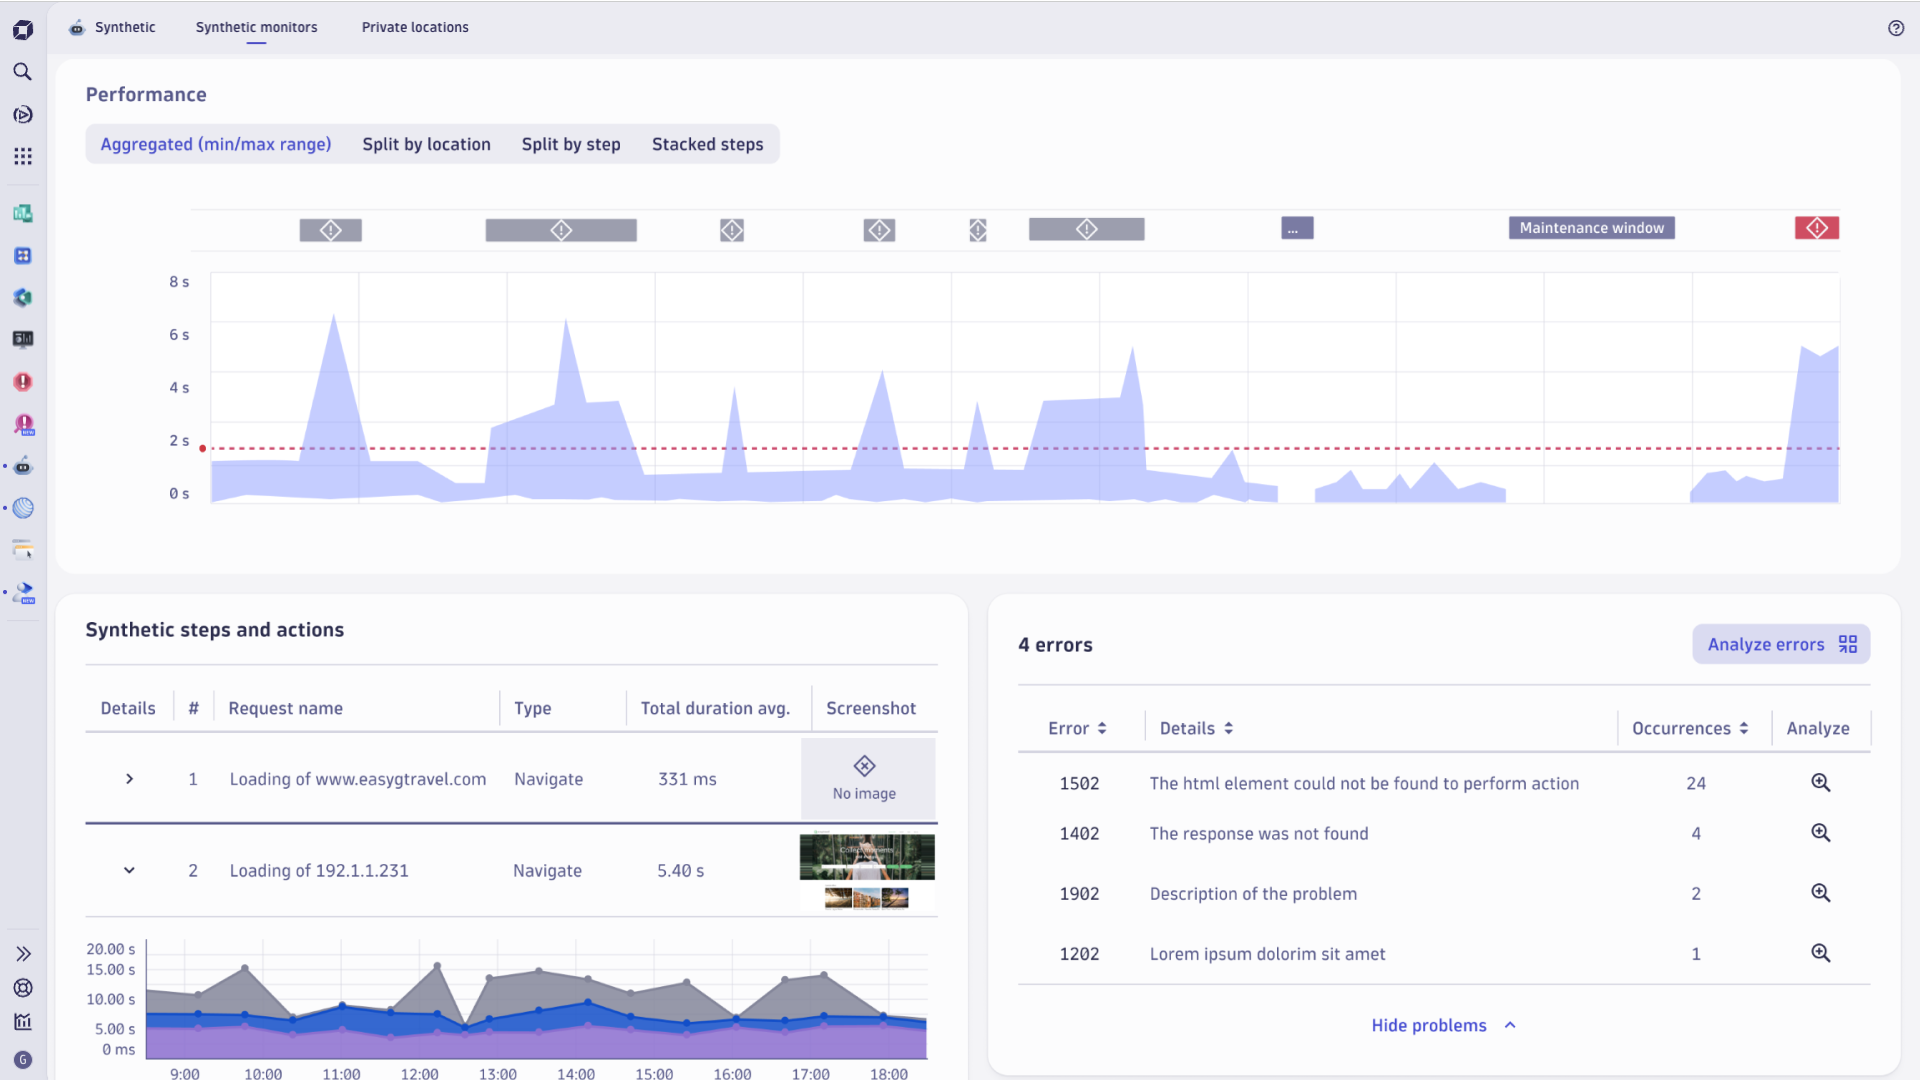
Proactively test and monitor the availability and performance of your application frontends, APIs, and services worldwide, with instant alerts to fix issues before users are impacted.

Digital experience monitoring with Dynatrace
-
Real user monitoring
Gain full visibility into all activity from every mobile and web user, seamlessly connected to the backend.
-
Mobile App Monitoring
Get AI-powered crash analytics and end-to-end visibility into native mobile applications.
-
Session replay
See exactly what your users see with video-like recordings of every user session.
Catch issues before your users do
Dynatrace runs synthetic tests from a global network of public and private locations, continuously validating availability and performance around the clock. The moment something degrades, you get an alert — before a single user is affected.
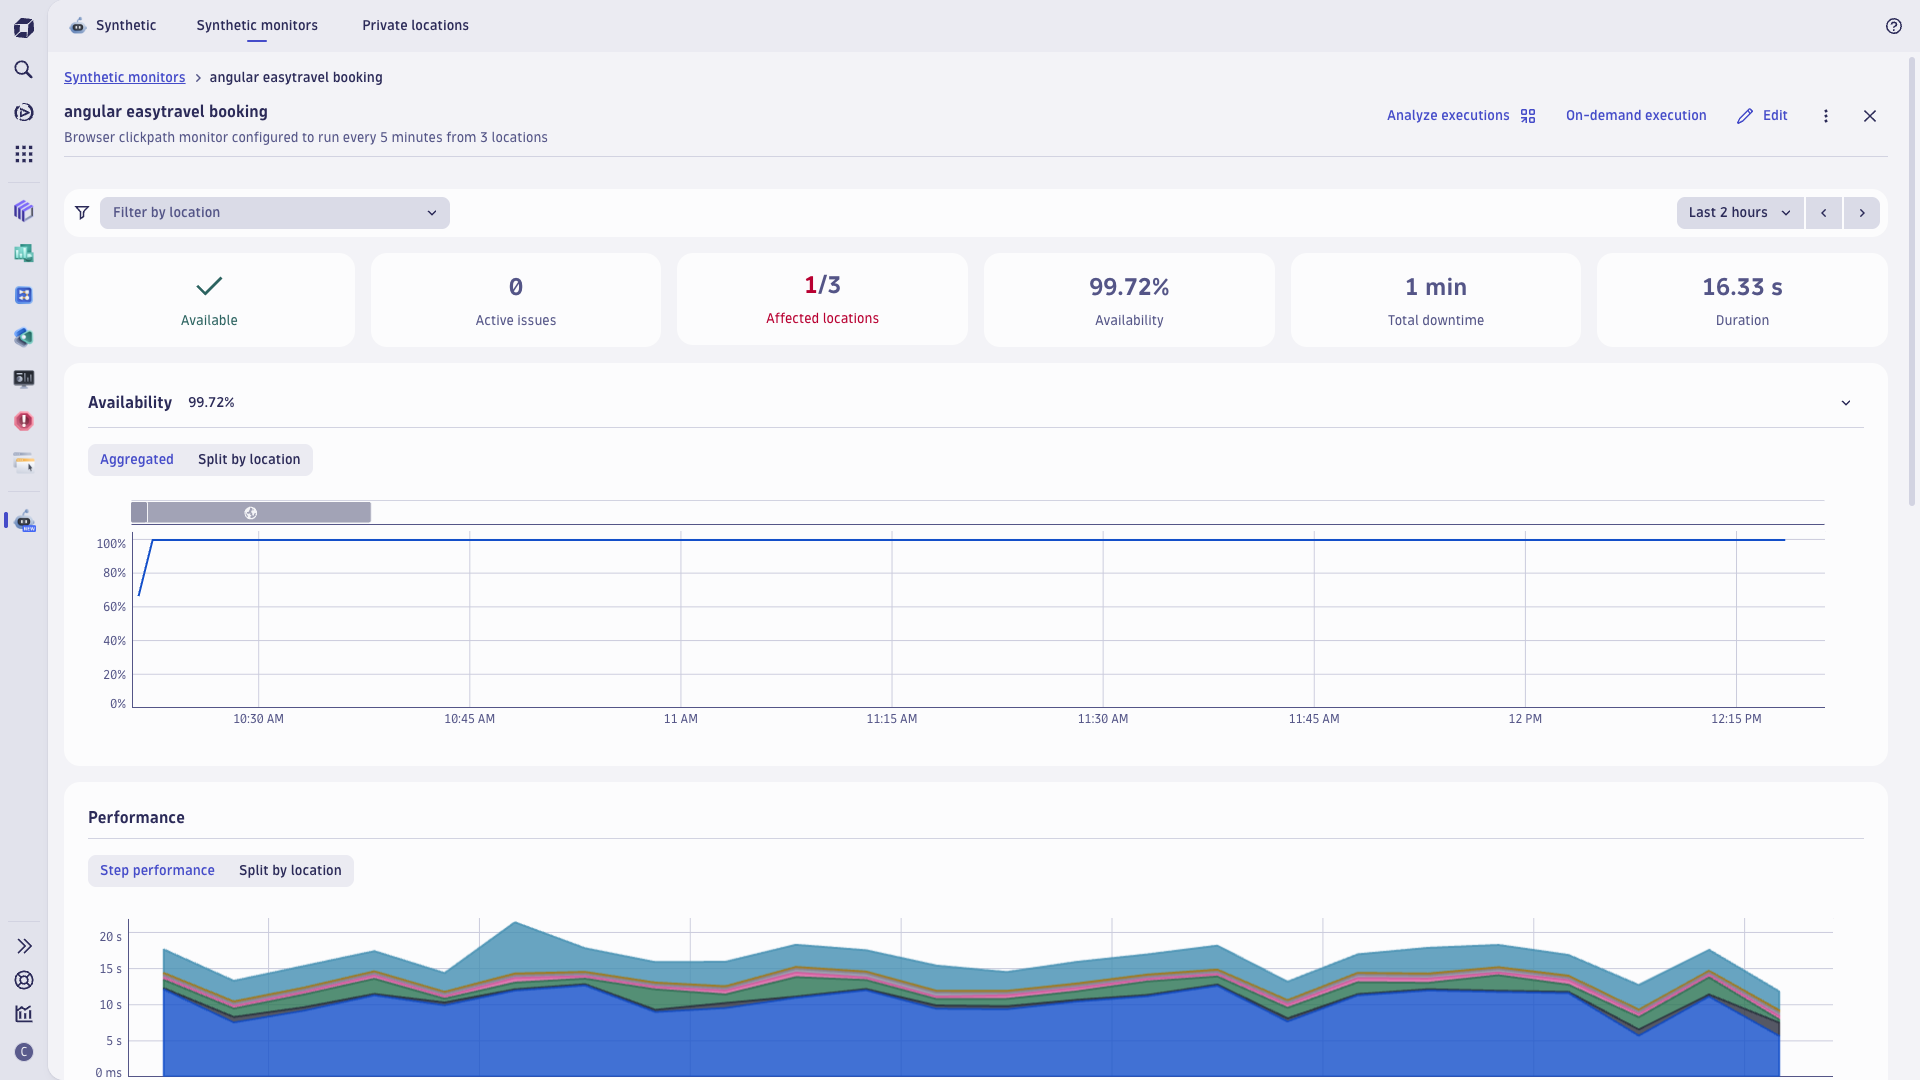
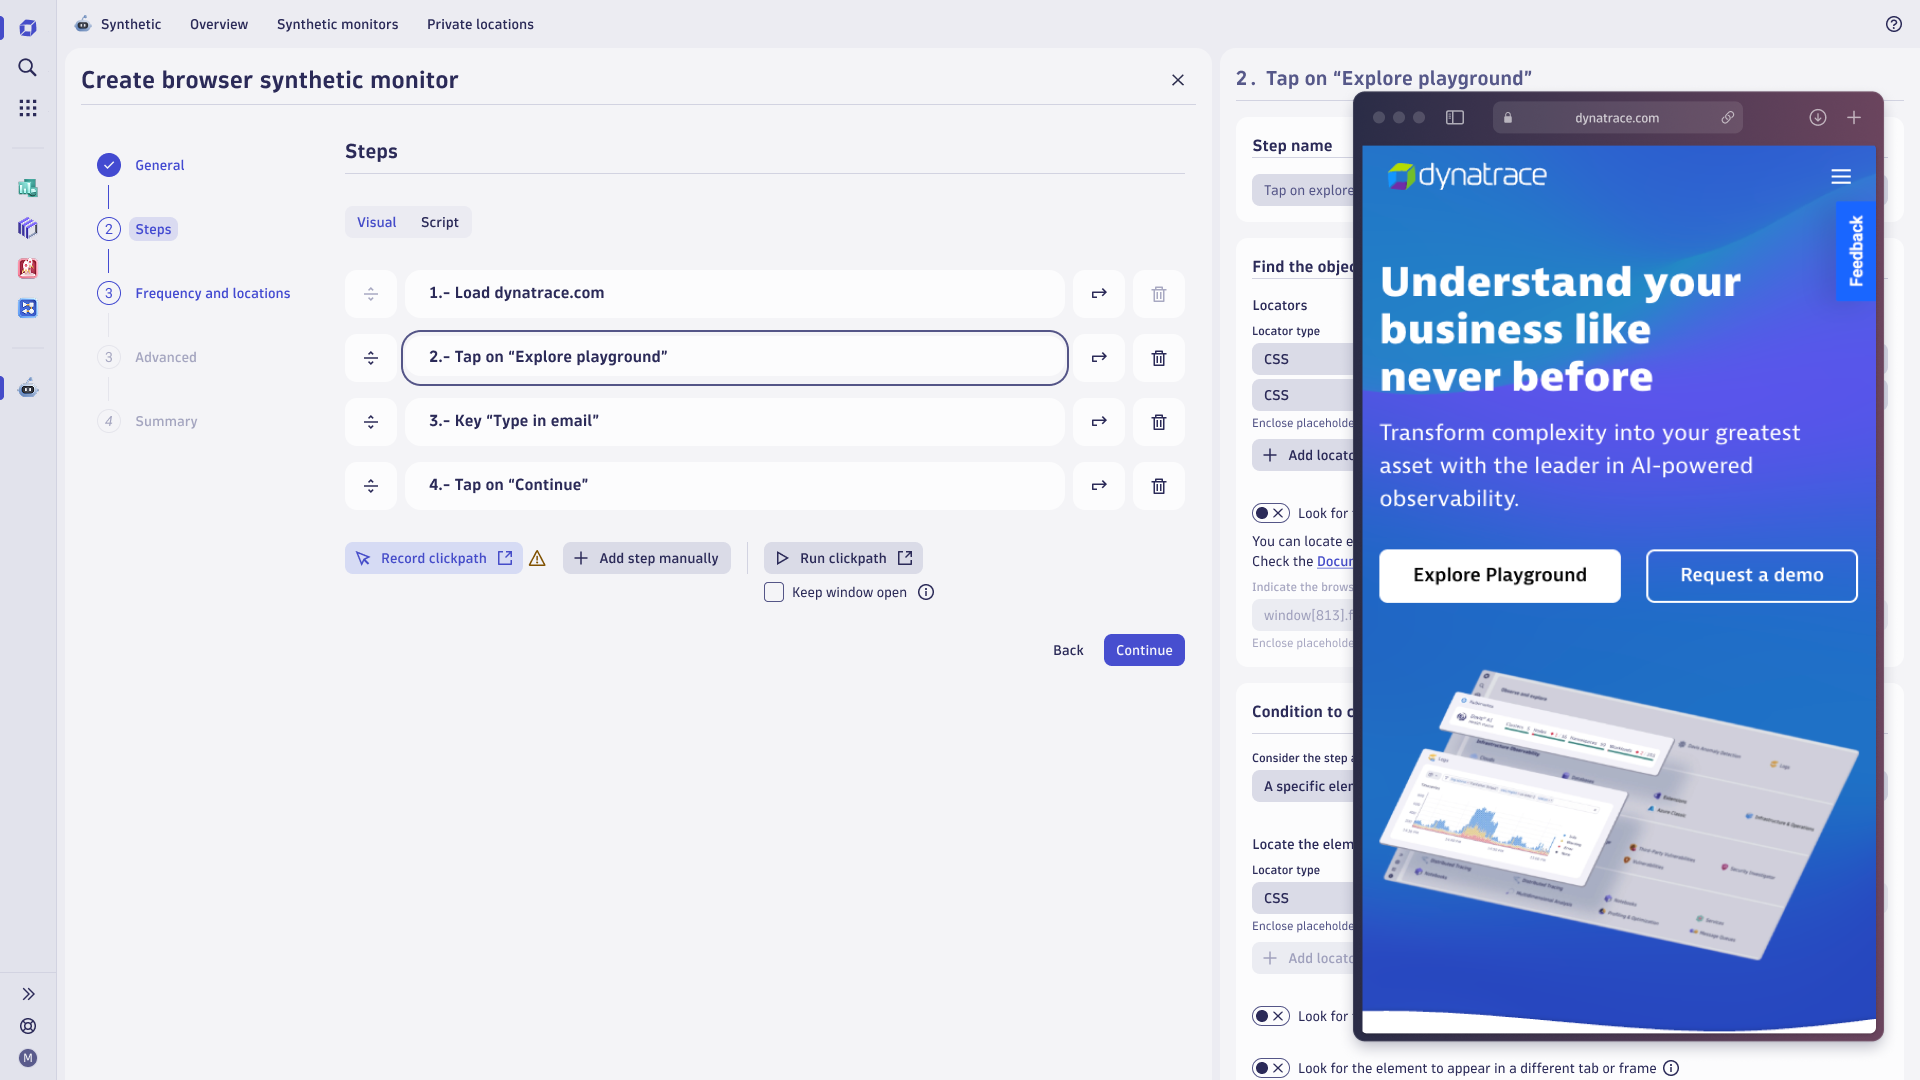
Simulate your most critical user workflows, no scripting required
Use the web-based recorder to capture and replay multi-step transactions across real-world device and network conditions. You get reliable coverage of the flows that matter most — checkout, login, onboarding — without writing a line of code.
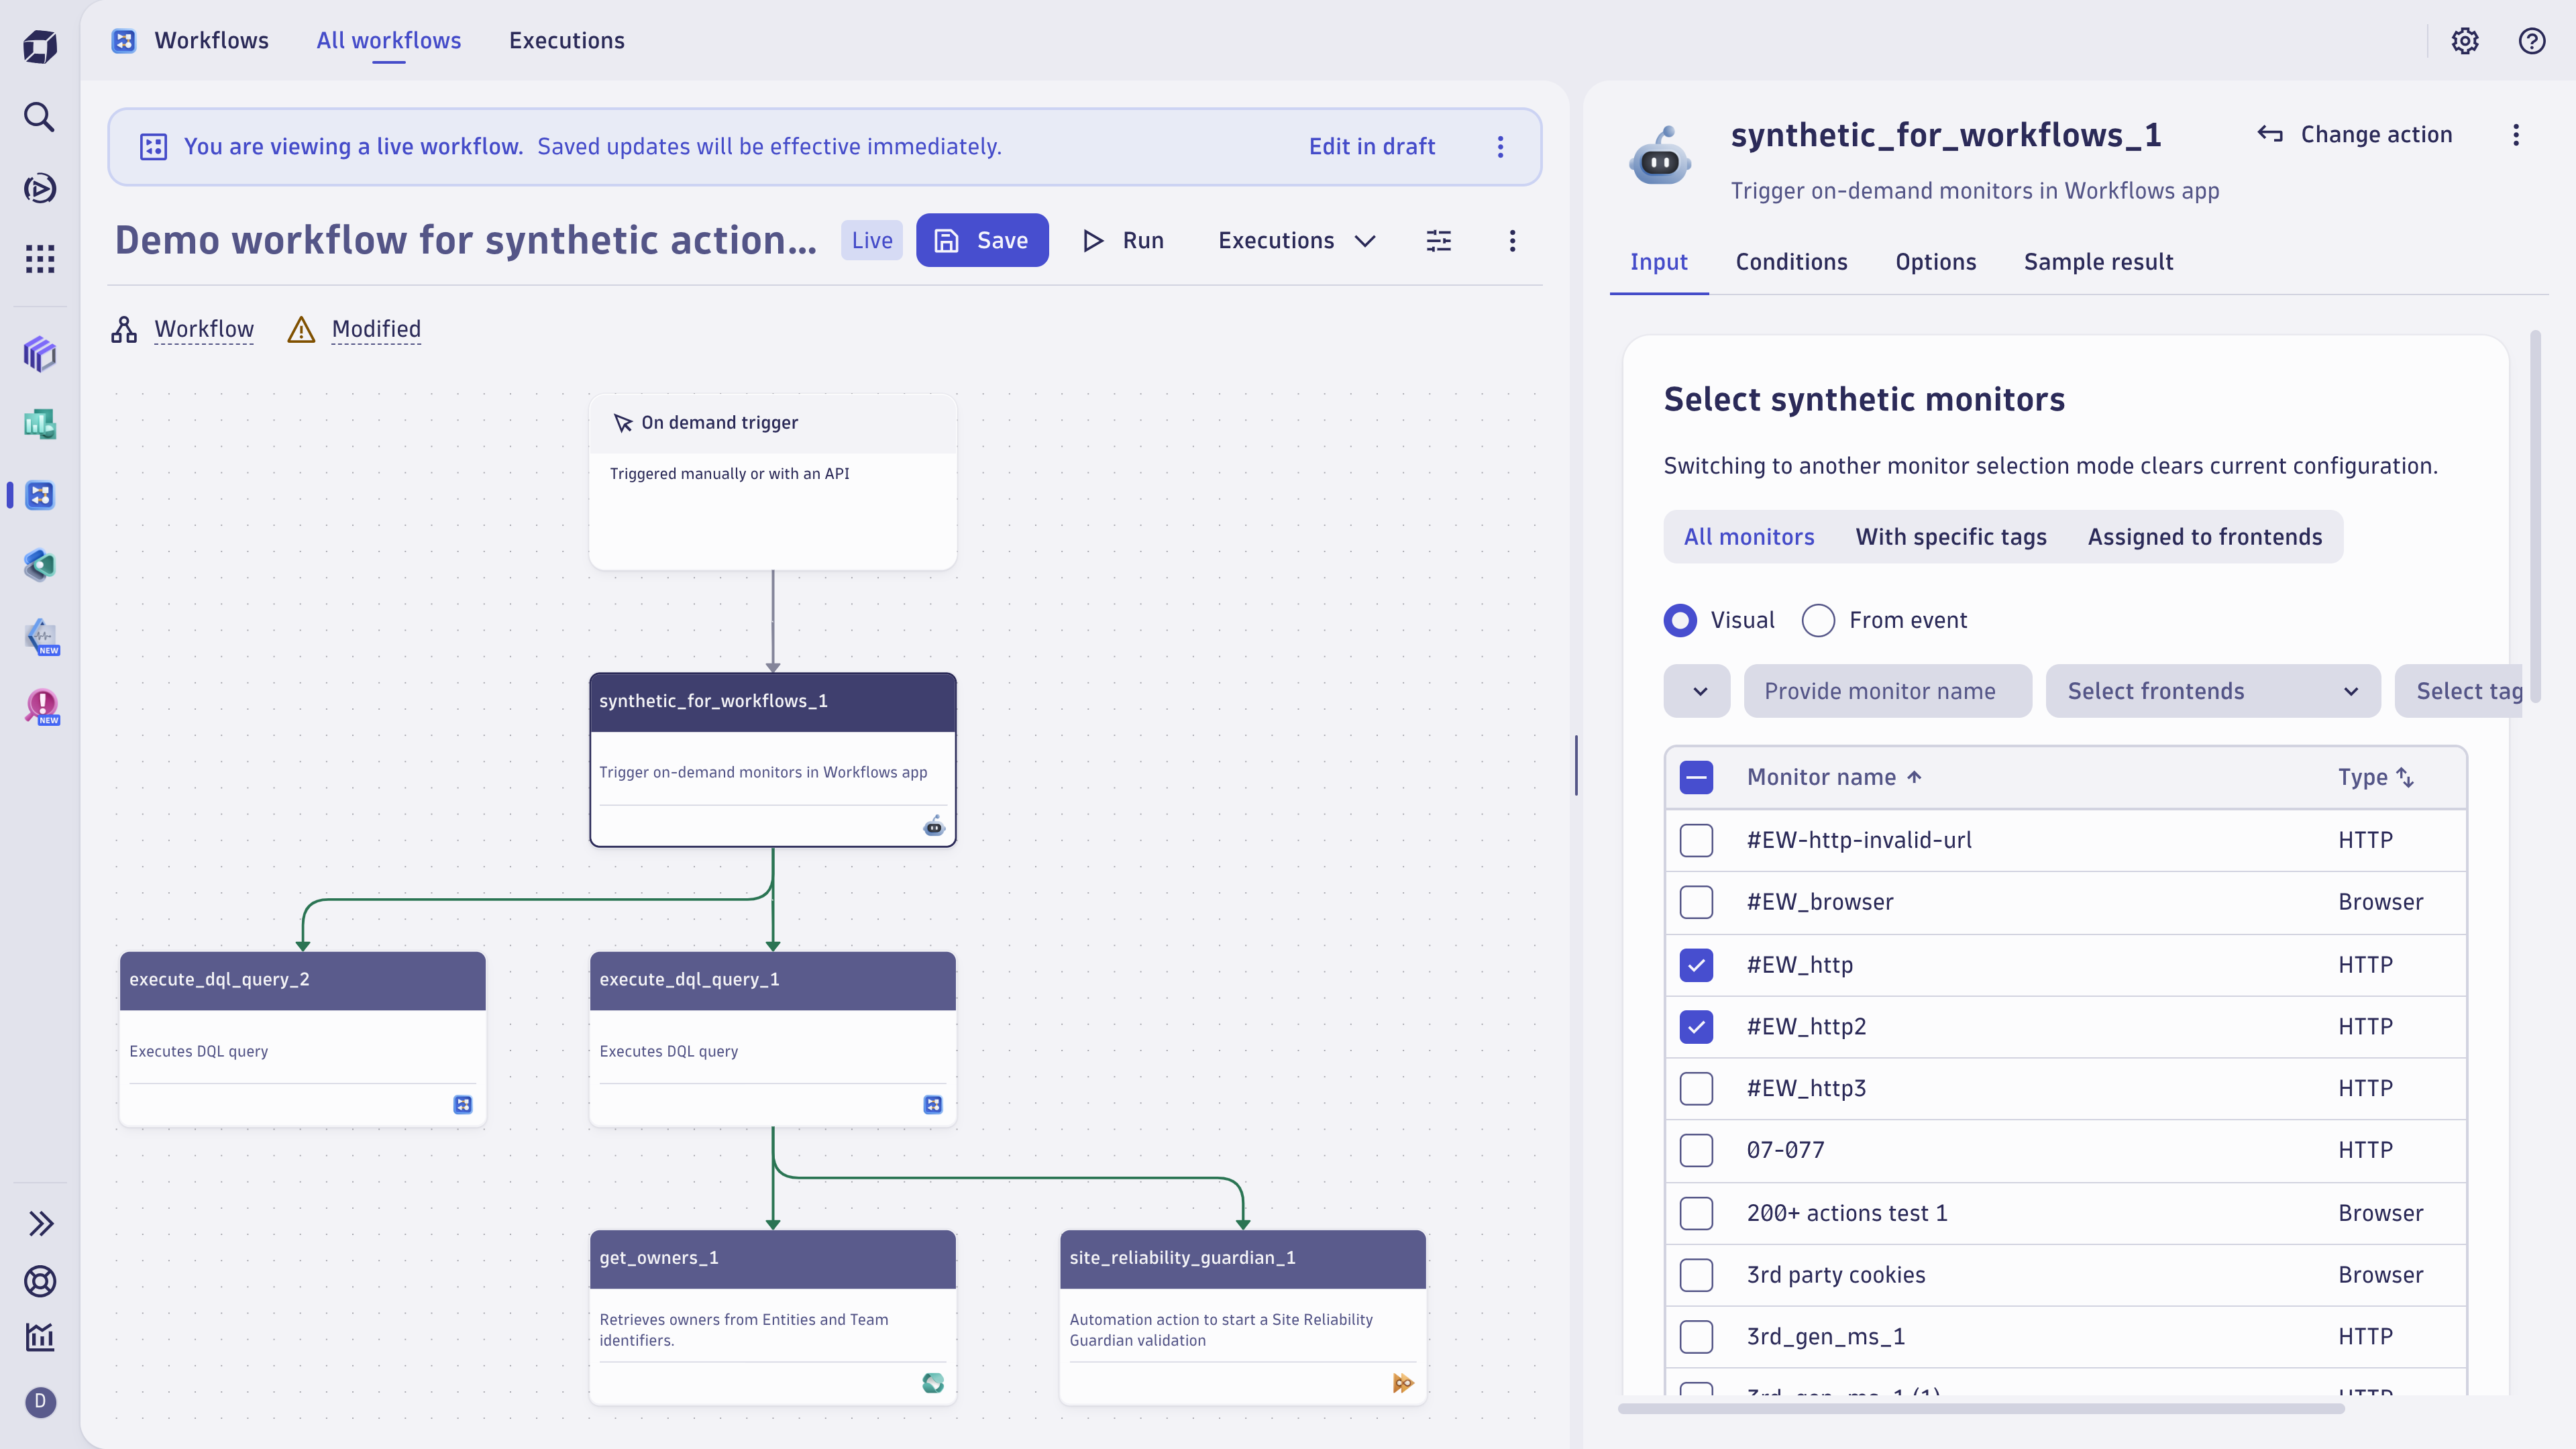
Shift left and release with confidence
Dynatrace integrates synthetic testing directly into your CI/CD pipeline, so you can validate SLOs and catch regressions in pre-production before they reach users. Automated test execution means quality gates happen without manual intervention.

Extend your team’s value with expertise-based data analysis and recommendations
The Business Insights team leverages deep Dynatrace expertise to maximize synthetic monitoring and go beyond application performance to unlock more value to drive business decisions.
Related resources
-
Synthetic Monitoring Documentation
Dive into our Synthetic Monitoring documentation for more details.
-
Synthetic Monitoring Blog
Learn more about synthetic monitoring and why it’s a critical part of digital experience monitoring and observability
-
Drive business value through DEM
Learn how synthetic monitoring can improve your digital experience monitoring strategy and drive business value
Get a free trial

Synthetic Monitoring FAQs
Synthetic monitoring simulates user interactions with your application — from simple HTTP pings to multi-step browser transactions — on a scheduled basis, independent of whether real users are active. Dynatrace Synthetic Monitoring runs these scripted tests from a global network of public and private locations to continuously validate the availability and performance of application frontends, APIs, and services. Because tests run around the clock, engineering teams detect outages, slowdowns, and broken transactions before real users encounter them, not after.
Real User Monitoring (RUM) collects performance and behavior data from actual user sessions as they happen, which means it requires live traffic and only surfaces issues after a real user has already experienced them. Dynatrace Synthetic Monitoring proactively executes predefined tests on a schedule, delivering consistent, reproducible measurements regardless of traffic volume — including overnight, during low-traffic periods, or before a release goes live. Within the Dynatrace platform, both capabilities are part of Digital Experience Monitoring alongside Mobile App Monitoring and Session Replay, and the two data streams complement each other: synthetic monitoring catches issues early, while RUM reflects the full breadth of real-world user impact.
Dynatrace operates a global network of public synthetic locations designed for low latency and high throughput, enabling teams to test from the geographies where their users live. For applications running in private environments — corporate intranets, staging environments, or infrastructure behind a firewall — Dynatrace supports private locations deployable on Linux, Windows, or containers. This means performance validation isn't limited to what is reachable from the public internet; the same test framework applies wherever the application runs.
No scripting is required to build browser-based tests. Dynatrace Synthetic Monitoring includes a web-based visual recorder that captures click-by-click user journeys and replays them as synthetic transactions automatically. Teams that prefer full programmatic control can also write or edit scripts directly. In addition to defining the test steps, engineers can tailor screen resolution and network conditions within each test to simulate the experience of specific real-world device types and connection qualities.
Dynatrace Synthetic Monitoring supports a shift-left approach by plugging synthetic tests directly into continuous integration and continuous delivery workflows. Teams can trigger test runs automatically on every build or deployment, validating that performance SLOs are met before code promotes to the next environment. When a test fails, Dynatrace instantly pinpoints root causes in pre-production, reducing the cost and risk of discovering defects after a production release.
Yes. Dynatrace Synthetic Monitoring provides the continuous, scheduled measurement data needed to track whether application availability and performance targets are being met over time. Teams configure tests against defined thresholds and receive instant alerts when performance drops or availability risk is detected, enabling proactive response before an SLO breach occurs. Because synthetic tests produce consistent, location-specific results on a predictable cadence, the data is well suited as evidence for both internal SLO reporting and customer-facing SLA commitments.
Competitive benchmarking in synthetic monitoring means running the same or equivalent performance tests against your own application and a competitor's, then comparing the results from a common vantage point. Dynatrace Synthetic Monitoring enables teams to benchmark key pages and transactions in real time, comparing performance from the end-user perspective using last-mile and mobile data. This gives product and engineering teams an objective, outside-in view of how their application's speed and responsiveness stacks up in the market.
Network Availability Monitoring (NAM) is a capability within Dynatrace Synthetic Monitoring focused on infrastructure, network, and device-level checks rather than application-layer transactions. NAM includes Ping monitors that measure latency and packet loss, and TCP Port checks that verify whether specific network ports are reachable. NAM is the right choice for monitoring infrastructure components, network paths, and devices where deploying a full OneAgent is not practical or possible — for example, network switches, printers, or edge devices in operational technology environments.
Dynatrace Synthetic Monitoring delivers instant alerts when a test detects a performance degradation or an availability risk, rather than waiting for the next scheduled reporting cycle. Alerts are triggered against configurable thresholds, so teams control the sensitivity — distinguishing transient blips from sustained outages. Because Dynatrace correlates synthetic test results with full-stack observability data, the alert surfaces not just that a test failed but where in the application stack the problem originated, reducing mean time to resolution.
Dynatrace was named a Leader in the Gartner Magic Quadrant for Digital Experience Monitoring in 2025, the second consecutive year it has received that recognition. In the 2025 evaluation, Dynatrace was positioned furthest for Completeness of Vision among all vendors assessed. Dynatrace Synthetic Monitoring is one of the core components of the Digital Experience Monitoring platform that earned this recognition, alongside Real User Monitoring, Mobile App Monitoring, and Session Replay.