
Load Testing—Essential and Not Difficult!
Chapter: Performance Engineering

Load Testing on the Web—It's Global!
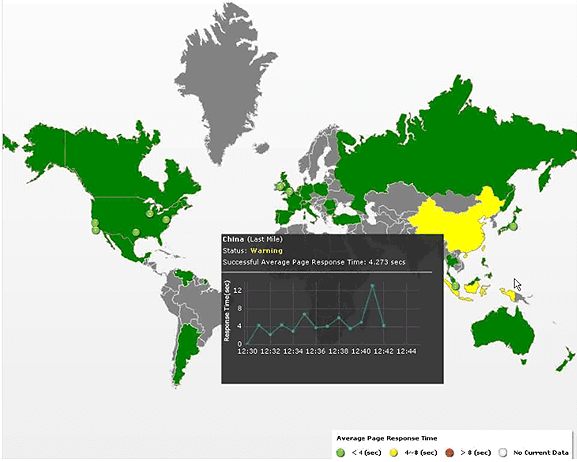
In addition to load testing within the controlled environment of the enterprise IT department, web applications must be performant from just about any geographical location around the world (Figure 3.15). Using in-house load-testing tools to simulate HTTP requests on the protocol level—Load Testing 1.0—will not help us to answer questions like these:
- Can the application perform satisfactorily on all targeted hosts and browsers?
- Does it perform without problem in all geographical locations?
- Will it render correctly on all end-user devices, including mobile phones and tablets?
In short, if you don't know the answers to the questions above, you can't release your product. Furthermore, it's not possible to know the answers without proper load testing! You might ask, if proper load testing is so critical, why do so many companies minimize or completely avoid it? There are all sorts of excuses, including these:
- It seems impossible to test realistic user load.
- We don't have the tools, expertise, or hardware resources to run large-scale load tests.
- It is too much effort to create and maintain test scripts.
- Commercial tools are expensive.
- We don't get actionable results for our developers.
Let's take each of these in turn.
1. It Seems Impossible to Test Realistic User Load
Indeed, it can be difficult to estimate a realistic user load or predict use cases, especially if you are about to launch a new website or service. At the same time, you should at least know how your new service will be used once launched, and how traffic is expected to evolve over time.
Estimating your traffic - It can help to see what your competitors have experienced by using online resources, such as Alexa, Compete, and Quantcast. You can read more about this on Sam Crocker's blog post, 7 tools to monitor your competitors' traffic. Also, factor in how much money you spend on marketing and promotions and what conversion rate you expect. This will allow you to estimate peak loads.
What you know (analytics) and what you think will happen (growth estimates) - Estimating realistic load becomes easier when you are updating an existing site. You likely have end-user data from a tool like Dynatrace, Google Analytics, or Omniture, and you can review a history of request volume in your web-server logs. With this data, you should have a good understanding of current transaction volume, customer behavior, and customer profiles (location, browser, connectivity). Factor in the new features, how many new users you expect to add, and the effect of any new launch promotions planned. Finally, make sure you talk to your marketing folks so that you don't have any rude surprises that bring down the system and waste their marketing efforts and dollars!
Combining all this data allows you to answer the following questions:
- What are the main pages and transaction paths I need to test?
- What's the peak load and what is the current and expected page load time?
- Where are my users located, geographically?
- What browsers do my customers use?
- What are the main browser/location combinations we need to test?
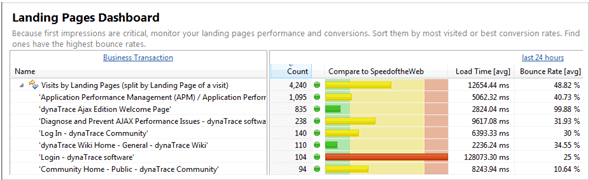
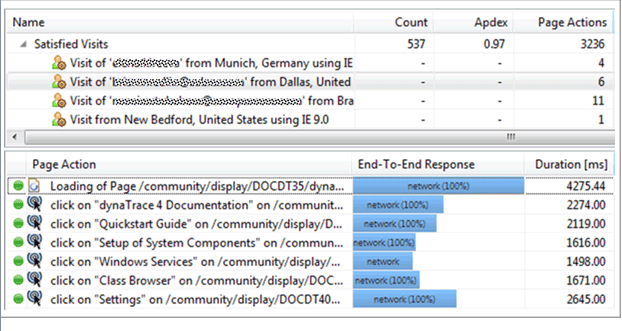
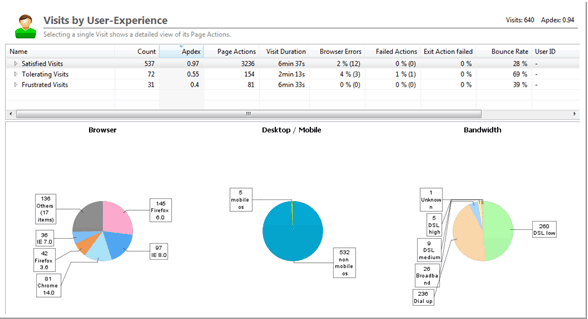
Figures 3.16, 3.17, and 3.18 give you some examples on how we can extract data from services such as Dynatrace or Google Analytics to better understand how to create realistic tests.
Don't forget about CDNs, proxies, network latency, etc. - Not every end-user request makes it to our application environment. Many components impact load times, including connection speed, browser characteristics, latency, content-delivery network, and geographic location. There are cloud-based testing services that can execute load from different data centers using different browsers and different global locations.
2. We Don't Have the Tools, Expertise, or Hardware Resources
In most environments, load testing is not a daily activity, making it difficult to justify the amount spent on commercial tools to generate load, hardware resources necessary to simulate load, and the training investment for personnel. But this is fast becoming an obsolete mindset because a new generation of cloud-based load-testing services obviates the need for such large investments. The key advantages include the following:
- Tools - You pay for only load tests performed, and not for the time software sits on the shelf becoming out-of-date.
- Resources - The hardware resources to generate load are provided and managed by the service provider.
- Skills - The service is staffed by testing experts who generate scripts and maintain the testing environments every day.
3. It's Too Much Effort to Create and Maintain Test Scripts
This might be a valid claim if it weren't for two simple solutions:
- Free vs. commercial tools - While free load-testing tools offer easy record/replay scripting, they don't always support a scripting language sufficient for creating and maintaining custom scripts. A number of commercially available tools make it much easier to solve scripting issues, though you do have to pay for this solution.
- Tools vs. services - For organizations unwilling or unable to use testing tools efficiently, cloud-based load-testing services usually include professional script generation and script maintenance as part of the subscription fee.
4. Commercial Tools Are Too Expensive
Perhaps, but if the alternative is software failure due to lack of scaling, then it's hard to justify cutting corners. As you've probably guessed, cloud-based load-testing services are a viable, and often preferred, alternative. For one thing, any costs associated with this service are for actual virtual users and execution time, so there's no wasted expenditure. We can evaluate this on the basis of cost per virtual user hour. You need only define three variables—test frequency, user load, and service rate—to calculate the actual cost.
5. We Don't Get Actionable Results for Our Developers
It is not enough to run a load test, report a problem to your developers, and expect them to be able to fix it. Imagine you are told that an application fails to meet the performance criteria when loaded to 100 or more virtual users. You must return to the code, add diagnostic log output, and have the tests run again just to produce some actionable data. This leads to an inefficient cycle of testing and retesting that can jeopardize project schedules and frustrate all involved.
This is old-style testing and it's not up to the task of dealing with modern, web-based applications. For this you need an application performance-management solution, which works alongside load-testing tools to provide very specific actionable data. With minimal overhead and without additional code, it's possible to pinpoint problematic database statements, inefficient synchronization code, heavyweight web service calls, and wasteful memory management, as well as a host of other items.
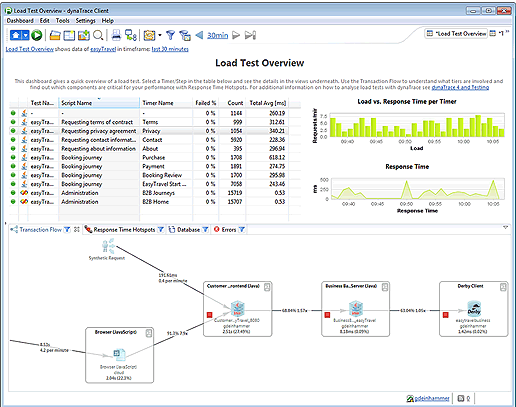
The dashboard in Figure 3.19 shows a exactly whether it is the Web-, App- or Database Server that contributes to response time of executed tests. Clicking on Database, Errors or Response Time Hotspot provides the list of methods that took long to execute, the SQL statements that were called on how long they took to execute as well as which errors happened in the application.
Convincing the Team that Load Testing Is Worth the Effort
You should now be well prepared to convince management and the engineering/testing team to undertake a complete battery of load tests. We've answered most of the common objections and shown that it is both worth the effort and not as difficult as many assume.
Discovering Performance and Scalability Problems—Load Testing at Work
Load testing, properly executed, gives us confidence in the reliability of our applications, but not simply because we know our software has met or exceeded our testing standards. The process of load testing uncovers problems that, when fixed, improve software quality, reveal issues of deployment that can lead engineering to develop best practices, and can help developers identify and avoid potential maintenance issues down the road. Problems exposed in load testing usually appear in four interrelated areas—network, server, application, and third-party components. Traditional load-testing methods are good at exposing the first three, but the fourth requires a different approach, which encompasses the entire application in the test scenario. We refer to this as Load Testing 2.0.
Network Problems
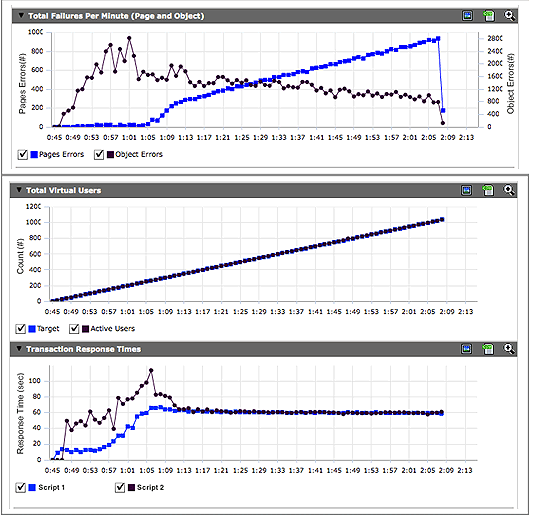
As the most fundamental of the four problem areas, network issues are likely to show up early and catastrophically. Problems range from the simple, such as an incorrect firewall license, to the bizarre. In one bizarre instance, the load test was progressing in a nicely predictable fashion. Response time was increasing with load, when suddenly, response times leveled out. This would not necessarily be a bad thing, except there was also a sudden leap in page errors, as you can see in Figure 3.20.
Immediately, all eyes fell towards the application layer as the customer and the load-testing team assumed this is where issues would arise as load increased. But the team monitoring the application layer reported an odd situation—there was no sign of any traffic arriving on the application-layer systems in the tools collecting data. Tracing the issues out from the application layer, the team could see traffic hitting the edge routers, firewalls, and load balancers, and then vanishing before making the leap to the web servers and application layer in the datacenter being tested.
One final area was investigated. As the test was being performed on only one of the company's datacenters, all other traffic had been redirected to the second datacenter. At about the time traffic stopped reaching the application layer at the datacenter being tested, response times at the current production datacenter started to increase.
How could this happen? This site was not being tested! Further investigation found that the load balancers on the production system were designed to redirect traffic automatically to the backup site above a certain level. When the load test reached that volume, all of the traffic was routed to the system that was currently serving customers, taking that site offline!
Without the network, traffic doesn't flow, data doesn't get delivered, and pages don't get displayed.
Server Problems
Server issues should be treated separately from application issues, as a configuration issue with the underlying server software is different than a problem with the code that is running on that server.
Consider a classic instance—one in which a web server was configured using the default settings. Under a light load, the server started rejecting most incoming connection requests, but allowing just enough through to be suspicious. When the web-server status was reviewed, it was clear that the configuration for maximum threads was set for the default value—in this instance, fewer than 100! A quick configuration on the master configuration that was pushed out to all of the web servers fixed this, and the test was restarted quickly.
Application Problems
Under load, the complexity of thousands of requests per second, each one unique, each one requiring system resources, making database calls, being transformed into different formats for further processing, makes the application and data layers—where incoming requests are executed, processed, and formatted before results are passed back to the client—among the most critical parts of the application.
With modern web applications often composed of multiple complex application and data layers, finding the problem can sometimes be a challenge. For example, one customer took multiple testing cycles and a great deal of investigation to discover the two root causes of a critical performance issue:
- A mystery scheduled job ran at 6 minutes past every hour and slowed the application to the point of being unusable.
- One of the customer's two web-application servers was, because of the client's attempt to save money, also running a middleware server that handled load for the entire system.
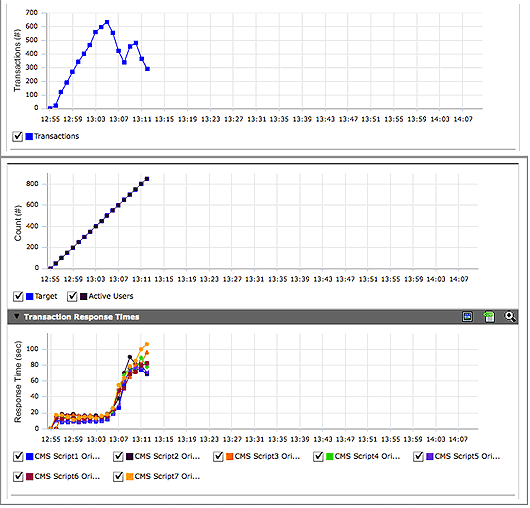
Neither the scheduled job or the overworked middleware server had been caught in previous tests examining components of the system in isolation, and it wasn't until the entire system was brought together and put under load that these issues were detected (Figure 3.21).
In this instance, the application had not yet gone live. But the customer was running the load test at the traffic volumes projected for their upcoming busy season, making this issue more than just two technical concerns. If the application wasn't able to process and deliver the data with speed and efficiency under all loads, these two technology problems could have quickly become a core business problem affecting the revenue of the entire company.
Third-Party-Component Problems
Adding third-party content to the load-test equation is a tricky thing as, by its very nature, this content is external to your organization's direct control. Your team will have no insight into how the application is performing under load other than when performance begins to degrade.
In the delivery of modern web applications, third-party content can take multiple forms. An incomplete list includes the following:
- Content -delivery networks (CDNs)
- Ad providers
- Search services
- Analytics services
- Customer-satisfaction surveys
- Charts and images
- Social media.
Load testing with third-party content included in the content mix can prevent unexpected performance issues from being discovered by your customers after testing is completed. Consider the examples in the following paragraphs.
In a hypothetical example, if the analytics service demands that the tag be placed at the start of the page, and their tag calls are optimized for only a certain volume of traffic, this JavaScript could block the loading of the rest of your content in the customer browser, making the customer unhappy with you, and consequently affecting your brand and potentially decreasing revenue.
The use of traffic shaping or limiters by third parties can be detected only when the entire application is placed under a well-designed load. At a certain traffic volume, the third-party service you have selected to handle search, analytics, or even ad-serving may begin to throttle or reject incoming requests, slowing or blocking critical page elements and affecting overall customer experience. Testing the new volumes with the entire application is one way to prevent these surprises from appearing after the application has gone live.
When load testing third-party content from an external perspective, problems may arise when the third party's infrastructure is incompatible with the testing format you have chosen. A key example of this is the use of distributed load generation from large datacenter or cloud providers. Concentrated load generation from a few distributed centers may sound perfect for testing a CDN, but there is a potential for issues, as this methodology may short-circuit the CDNs ability to appropriately distribute the load based on a customer's IP address. Involving the CDN in the planning and execution of the tests cycles will help overcome this while still validating the effectiveness of the content delivery.
Testing and validating the performance of this outside content allows you to validate all aspects of your application (including those you don't directly control) as able to handle the tested load. In the end, if your third-party content providers lack the ability to scale with your online application, they could quickly go from being a supporting partner to a dragging anchor.
Identifying Deployment Problems Early
Many mistakes are made when deploying an application into production. Let's have a look at an example and look over a check list to avoid things like missing files, misconfigured Web Server settings or outdated JavaScript framework files.
It may seem obvious that when deploying an application, it is important to deploy all of the application content at the same time, including static resources, such as CSS, JavaScript, and image files that can easily be forgotten, causing a cascade of errors (see Figure 3.22).
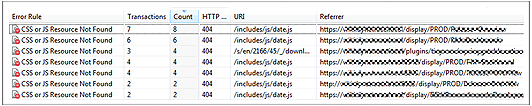
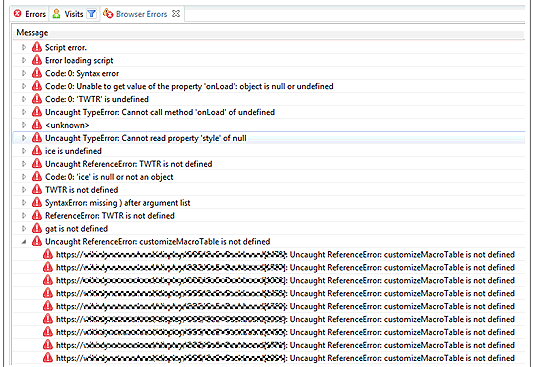
In particular, missing JavaScript files can result in the loss of features available to end users. In Figure 3.23, a data.js file was created so that users could select dates from a calendar control instead of entering them manually. Because the file was not deployed correctly, clicking the calendar icon yielded nothing but a log full of JavaScript errors.
How to deal with this problem? Many load-testing environments are not configured to reveal this sort of problem, for two basic reasons:
- Traditionally, load tests are executed at the HTTP level only, which will not execute all content.
- Load tests executed in-house do not test the accessibility of third-party components through CDNs.
It is therefore recommended that you take the following steps:
- Test in a realistic environment, either directly on your production system or within a staging environment that is accessible over the Web.
- Execute tests that cover all important use cases of your application to verify a correct deployment.
- Repeat all load tests from geographically dispersed locations. This is the only way to assure that your CDNs are serving all regions and that all of your static content is being correctly deployed to every user.
Some cloud-based testing services offer additional testing services that will execute their scripts using real browser replay instead of HTTP-only testing. Running the tests with various browsers makes sure you test your pages as requested by real end users. The additional benefit of that approach is testing compatibility of browsers and verifying browser-dependent deployment; e.g., special JavaScript Framework versions for certain browsers.
An Overabundance of Log Data
With logging frameworks, it has become easy to generate log entries and then troubleshoot problems with the analytical tools. So easy, in fact, that it's possible to overload your file system with excessive amounts of not-very-useful log data that can impact application performance through no fault of the application itself! Here is one example, both web applications running on Tomcat, where the log settings create serious problems that show up during testing.
Excessive Use of Exception Objects to Log Stack Trace
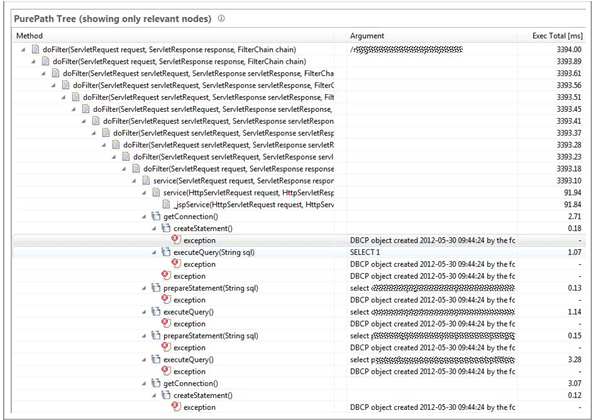
In this example, the logAbandoned attribute of the Tomcat Connection Pool was set to true. This triggers a stack trace whenever a database connection is abandoned. However, this application executed several hundred queries for each transaction, and most queries were executed on separate connections. So every log entry resulted in nearly as many getConnection calls as executedQuery calls (see Figure 3.24).
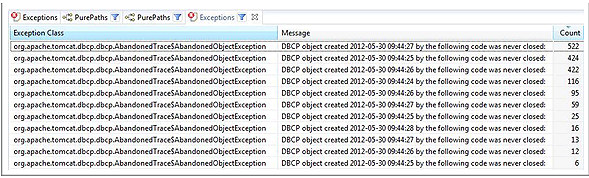
Focusing on the individual exception objects that were created (Figure 3.25) shows us more clearly how much redundant information is collected but doesn't provide a whole lot of additional useful information for troubleshooting.
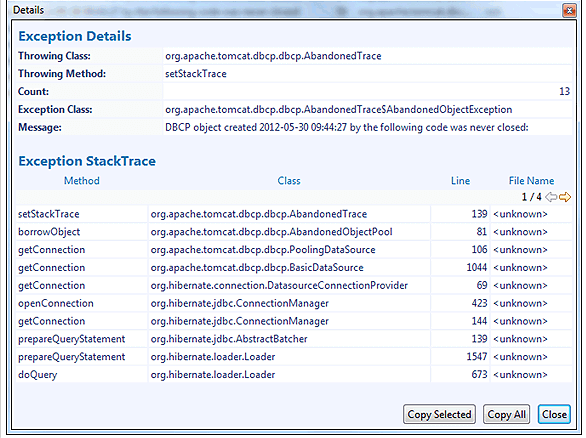
When looking at the exception details of these individual exception objects the top stack-trace entry reveals which method actually created these objects to obtain the stack-trace information for logging (Figure 3.26).
How to deal with this problem? Load problems that arise during simulation will not necessarily turn up in the deployment system. However, they should serve as a warning to the testing team to make sure that test code is completely removed before moving an application to production.
More information on this particular problem can be found here
Table of Contents
Application Performance Concepts
Memory Management
How Java Garbage Collection Works
The Impact of Garbage Collection on application performance
Reducing Garbage Collection Pause time
Making Garbage Collection faster
Not all JVMS are created equal
Analyzing the Performance impact of Memory Utilization and Garbage Collection
The different kinds of Java memory leaks and how to analyze them
High Memory utilization and their root causes
Classloader-releated Memory Issues
Performance Engineering
Virtualization and Cloud Performance
Try it free
