
Collecting and Analyzing Execution-Time Data
Chapter: Application Performance Concepts

There are two widely-used techniques for collecting execution time data: Time-Based Measurement and Event-Based Measurement. Both have become standard parts of performance management products and both typically represent data as stacks, so they look superficially similar. We'll examine each in detail, pointing out the fundamental differences in their approaches to data measurement and to what these means in terms of data interpretation.
Time-Based Measurement
In time-based measurement, the stacks of all executing threads of an application are captured at a constant interval (sample rate). Then the call stack is examined and the top method is set to the state of the thread — executing or waiting. The more often a method appears in a sample, the higher it's execution or wait time.
Each sample gives an indication of which method was actively executing, but there are no measures of execution duration or of when a method completes execution. This tends to miss shorter-running method calls, as if they were not actively executing. At the same time, other methods may be over-weighted because they happen to be active during, but not in between sampling periods. For both reasons, this makes it difficult to collect exact execution time data for an individual method.
The selected time interval determines the granularity and quality of the measurement. A longer measurement time also increases the probability that the data is more representative and that the errors mentioned will have less of an effect. This is simple statistics. The higher our number of samples is the more likely it is that methods that execute more often will appear as the executing methods on the call stack.
This approach creates its own measurement errors, but it provides a straightforward way to track down performance problems. Perhaps the most important advantage is that measurement overhead can be controlled by the sampling interval; the longer the interval, the lower the overhead. This low overhead is especially important in production environments under full load. Here's why:
We see that a particular user request is slow, but we're not able to see the input data in use. At the same time, we have no knowledge of actual execution counts for particular methods. Time-based measures can't provide this information. The collected data gives us no way to determine when a single method execution is slow or when there is overly-frequent method execution.A problem analysis of these sorts of details requires the use of event-based measurement.
Event-Based Measurement
Instead of thread samples, event-based measurement analyzes individual method executions. We log a timestamp at the beginning and end of each method call, which makes it possible to count the number of times individual methods are called and determine the exact execution time of every call. It's a straightforward matter of calculating the differences between the collected timestamps.
The Java Runtime offers special callbacks via JVMPI/JVMTI, which are called at the be-ginning and end of method executions. However, this approach carries a high overhead that may have a major impact on the application's runtime behavior. Modern performance measurement methods use bytecode instrumentation, requiring very little overhead. There's also the added functionality of instrumenting the most relevant methods, only, and the ability to capture context information, like method parameters.
Transactional Measurement
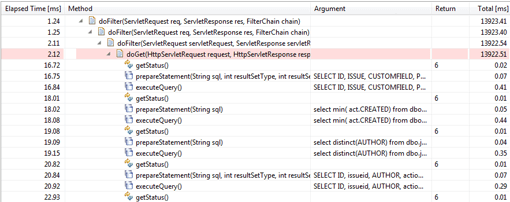
For complex applications, we make use of more sophisticated forms of event-based measurement. So in addition to storing method execution metrics, transactional measurement stores context, which makes it possible to examine the methods of different transactions individually. This way we can find out that a specific slow SQL statement is executed only for a specific Web request.
Method executions are also stored in their individual chronological order instead of being aggregated based on the call stack, which can reveal dynamic behavior of the processing logic of a transaction — for example, a servlet request. The isolated examination of individual transactions thus makes it possible to analyze data-dependent problems and outliers.
The detailed diagnostics provided by transactional measurement are particularly well-suited for working with distributed applications. There are a number of ways in which cross-tier transactions are correlated:
Transaction type based approaches pass a transaction type ID to the next tier and additionally use time based correlation. This provides more details as not only time but also the transaction type (e.g. URL) is taken into account. Transaction id based correlation passed individual transaction IDs to the next tier. This allows following individual transactions across tiers and is the most precise approach to cross tier correlation.
Hybrid Approaches
Hybrid methods combine time-based and event-based performance measurement to exploit the advantages of both and avoid the individual disadvantages. The main ad-vantage of event-based data collection lies in capturing each call and its context — such as method parameters. The primary advantage of the time-based approach lies in the constant and load-independent overhead.
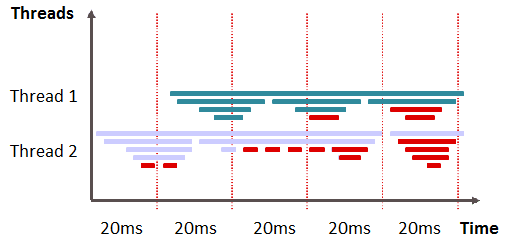
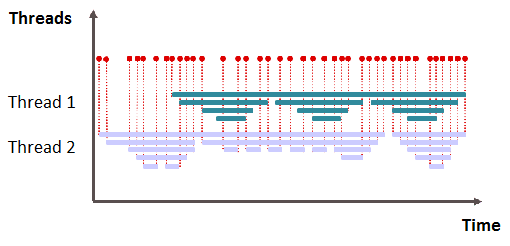
Hybrid measurement combines transactional event-based data with thread snapshots that can be assigned to a specific transaction. Instrumentation ensures we can capture the transactional context as well as method parameters and other details, while time-based data provides a low overhead approach to capture execution time information.
This approach offers the most precise insight into the runtime behavior of an applica-tion, and the nearly constant overhead is well suited to production monitoring. The figure shows a transactional trace that combines both data sources with one an-other. The event-based data is shown in blue and the time-based data in green.
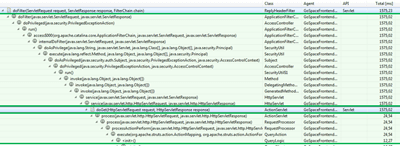
Table of Contents
Application Performance Concepts
Memory Management
How Java Garbage Collection Works
The Impact of Garbage Collection on application performance
Reducing Garbage Collection Pause time
Making Garbage Collection faster
Not all JVMS are created equal
Analyzing the Performance impact of Memory Utilization and Garbage Collection
The different kinds of Java memory leaks and how to analyze them
High Memory utilization and their root causes
Classloader-releated Memory Issues
Performance Engineering
Virtualization and Cloud Performance
Try it free
