

All too often, observability is seen as the sole domain of infrastructure and operations. But at FreedomPay, we've seen enormous success in breaking down silos and accelerating development by opening up our Dynatrace observability dashboards not only to the developer side of the house, but also to our customers.
Extending our dashboards made troubleshooting problems for our customers much easier. We saw mean time to resolve (MTTR) drop from 22 days to 2 days, then to 2 hours. And in some cases, resolution happened in minutes.
Sharing observability dashboards outside the company might sound like an extreme idea, but it's a natural extension of our business. As a payment orchestration platform, our customers rely on us to conduct some of the most fundamental elements of their business. The barrier between "our problem" and "their problem" is often thin and hard to see. Letting customers peer into our side of the transaction helps everyone resolve problems more quickly, regardless of whose side of the infrastructure divide a problem resides on.
If you’d like to do the same thing, read on to learn from our experience.
Solving for developer frustration
Before we could open our dashboards to customers, we had to unify our observability on Dynatrace and open observability to entire company, including developers.
Our observability journey began with frustration. Our teams were juggling a rotating cast of monitoring tools: Some were using SolarWinds, others were using Splunk, and still others were using custom solutions. Meanwhile, as the company matured, so did our compliance obligations. We needed tools that could meet the requirements to handle sensitive data securely. What we found was that we could use some features of a tool, but not others. That only added to the fragmentation as teams sought to fill the gaps.
Each of the tools in use offered a piece of the observability puzzle, but there was no unified view. Worse, few people could even access all the different pieces. Six different people might all think they had identified the root cause of an issue, but all six might be wrong because they lacked critical information.
Moreover, developers had little direct access to observability tools and depended on ops to share data. When developers learned about an issue, it was usually because a customer had reported it.
Dynatrace was a revelation. It became not just a monitoring tool, but a shared platform for developers and operations. Developers began requesting access, not because they were told to use it, but because they saw the value.
With Dynatrace, we can now spot anomalies early, validate fixes quickly, and understand the impact of our changes. Observability became part of our development workflow, not a postmortem exercise.
Before, developers:
- Only learned about issues because a customer reported it.
- Had little direct access to observability tools and depended on ops to share data.
- Couldn’t see how our code behaved in real-world conditions.
- Couldn’t trace transactions end-to-end.
- Spent hours or days troubleshooting as we juggled tools and gathered context.
It was clear that we needed a better way for developers to engage with observability.
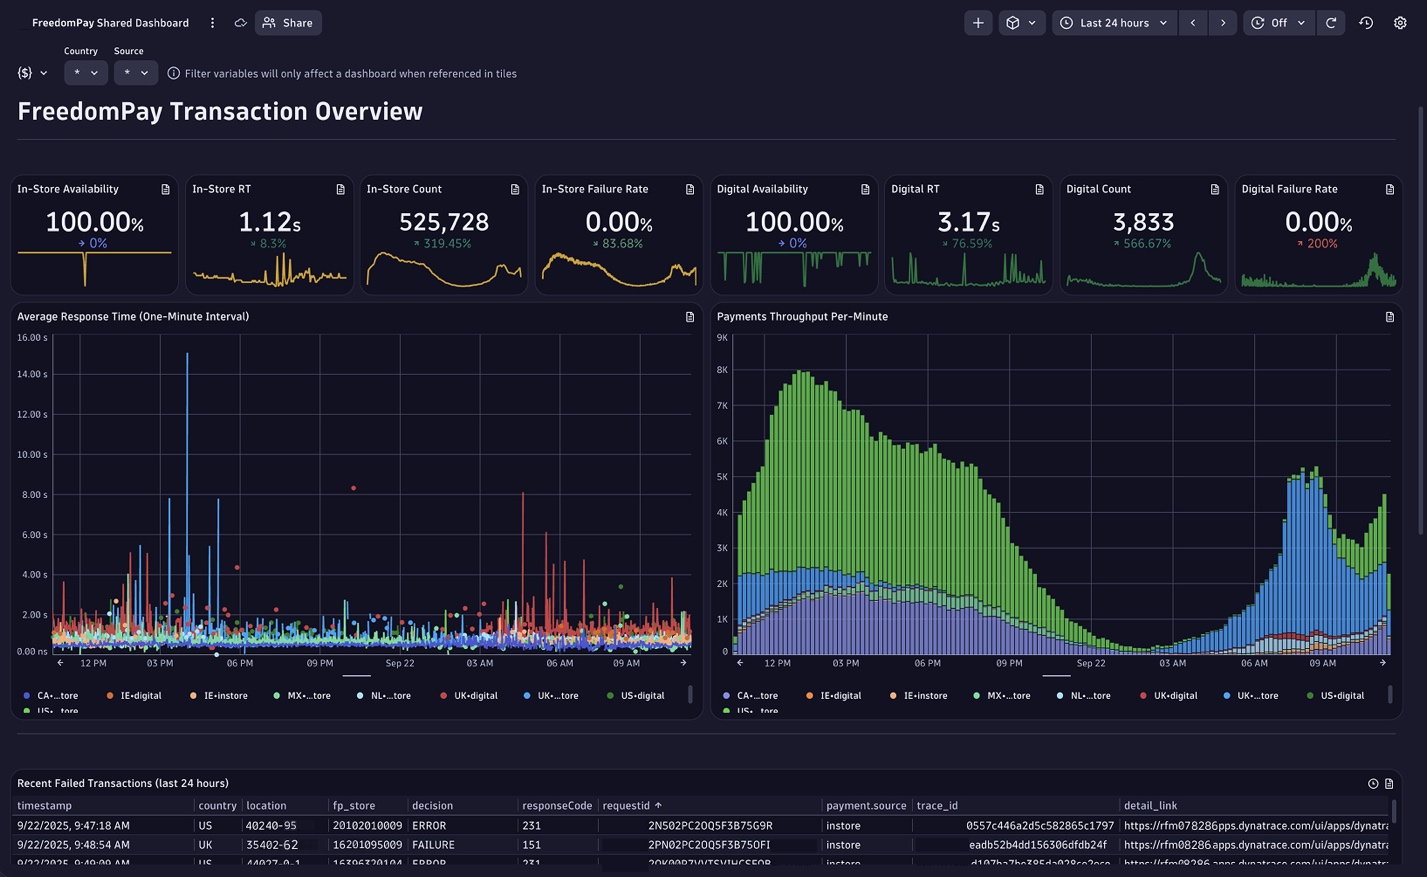
More visibility and shared dashboards
The idea to bridge this gap with shared dashboards stemmed from when a customer told us point-blank that a traditional status page wouldn't cut it when it came to payment processing. Before, troubleshooting was slow indirect. We often spent days determining whether an issue was on the FreedomPay side. Now customers can skip the calls and emails and look at the data in the dashboard themselves. It also helps them diagnose problems in their own stack, even if the problem isn't on our side.
Sharing data with customers required careful design
We had to ensure that no customer could access any other customer’s data.
We used federated access and identity and access management (IAM) policies to control visibility. Customers got access to a DMZ tenant, scoped to specific Grail buckets and security contexts. When they logged in, they saw only their own data. This isolation also helps control costs, since we can track usage by tenant andcost center and see exactly what each customer consumes.
I don't think we could get to where we are going as FreedomPay without a platform like Dynatrace.
We also learned to respect the customer’s internal processes.
We went from using our own internal terminology to using the customer’s language for labels and lookup tables. We use dashboards that reflect the customer’s geography, store layout, and business model. We hold weekly syncs to gather feedback and iterate. We make incremental changes, validate in real time, and build together.
Want to share your own dashboards with customers?
A few more words of wisdom based on our experience:
Start with understanding your data
Dynatrace doesn’t extract everything out of the box. You have to configure it. You have to know what matters to your customer. For us, it was transactional metadata: what happened, where, and why.
Build a guild
We hold weekly sessions to share techniques, features, and ideas. Invite everyone: developers, testers, SREs, infrastructure engineers.
Invest in the relationship
A shared dashboard isn’t just a product: It’s a platform for collaboration. It’s a way to build trust, solve problems faster, and become a true partner to your customer.
Some tips to keep in mind:
- Establish direct contact with the customer’s security team to enable SSO access to the Dynatrace tenant.
- Scope dashboards tightly to avoid unnecessary data ingestion and inflated costs.
- Treat dashboards like products: version them, sunset outdated ones, and evolve based on feedback.
Shared observability changed how we work.
Modern observability is the ally you need. It's more than an ops tool—it's your key to faster, smarter development.
Download our developer's guide to observability and see how the right solution can streamline collaboration and reduce burnout.
A Leader in the 2025 Gartner® Magic Quadrant™ for Observability Platforms
Read the complimentary report to see why Gartner positioned us highest for Ability to Execute in the latest Magic Quadrant.
This graphic was published by Gartner, Inc. as part of a larger research document and should be evaluated in the context of the entire document. The Gartner document is available upon request from Dynatrace. Dynatrace was recognized as Compuware from 2010-2014.

Trusted by thousands of top global brands
Try it free

Additional Ebooks

The path to unified observability at AT&T
Unlocking strategic value with modern log management and AI-powered observability
Resilient financial services in a digital-first world

The End‑to‑End Observability Playbook

Observability predictions for 2026

AI-powered visibility for IT Leaders in financial services
Getting started with Amazon Bedrock Observability
The Perform Pulse
DXC + Dynatrace: Master cloud complexity with AI-powered observability
AI-Powered Observability for Financial Services IT Leaders
Business Observability in Action: Dynatrace eBook
Outpacing the Legacy Trap: Dynatrace’s Blueprint for Advancing Observability with Bank of America
AI adoption starts with observability
6 challenges enterprise face and how Dynatrace solves them
Attack Surface Checklist for Cloud & Kubernetes
The importance of business observability for enhanced success
The Developer’s Guide to Observability
eBook: Maximize business outcomes with modern log management
Beyond monitoring: Analyze, automate, and innovate faster with AI-powered observability
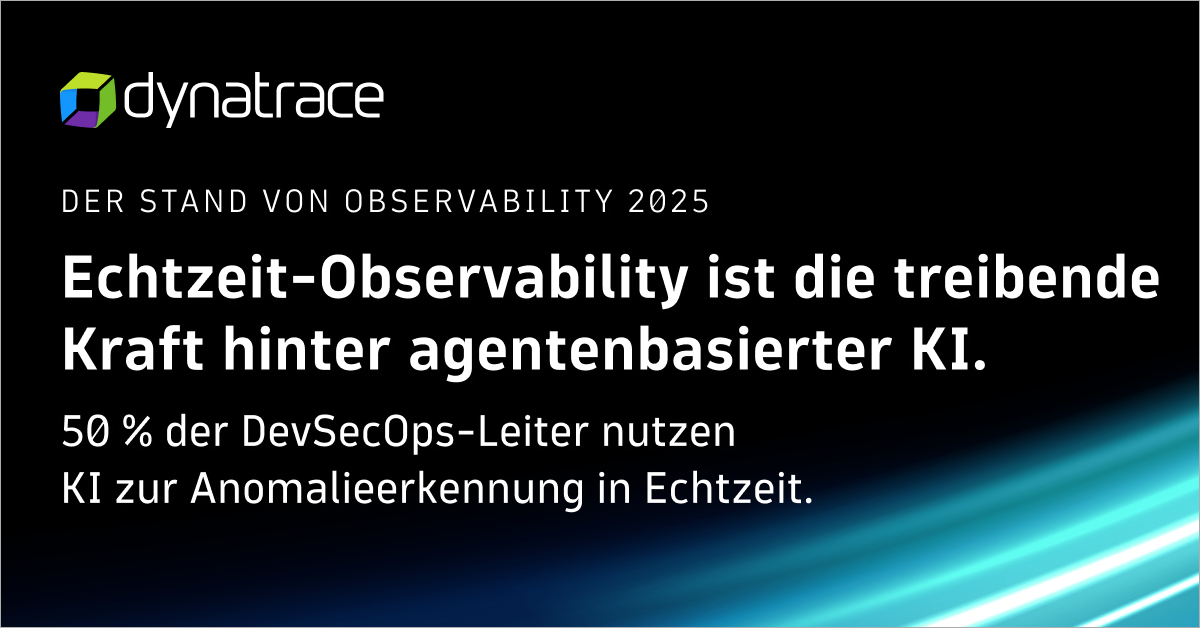
State of Observability 2025: The control plane for AI transformation
The impact of digital experience on the business
The Dynatrace Approach to Kubernetes
Five strategies to reduce tool sprawl
Kubernetes in the Wild report 2025: New trends

Why the cloud needs observability

Kubernetes platform observability best practices guide
Use Grail to ingest and analyze logs at scale
Answers to the top 6 privacy and security questions
How to make technology your strategic advantage
5 infrastructure monitoring challenges and their impact
6 Best Practices for upgrading from Dynatrace Managed to SaaS

Redefining the customer journey with application optimization

Delivering on the potential of application optimization
5 trends shaping the future of digital transformation

Fighting tool sprawl with unified observability


