
Business Observability
Simplify critical, real-time business decisions with precision, speed, and context.


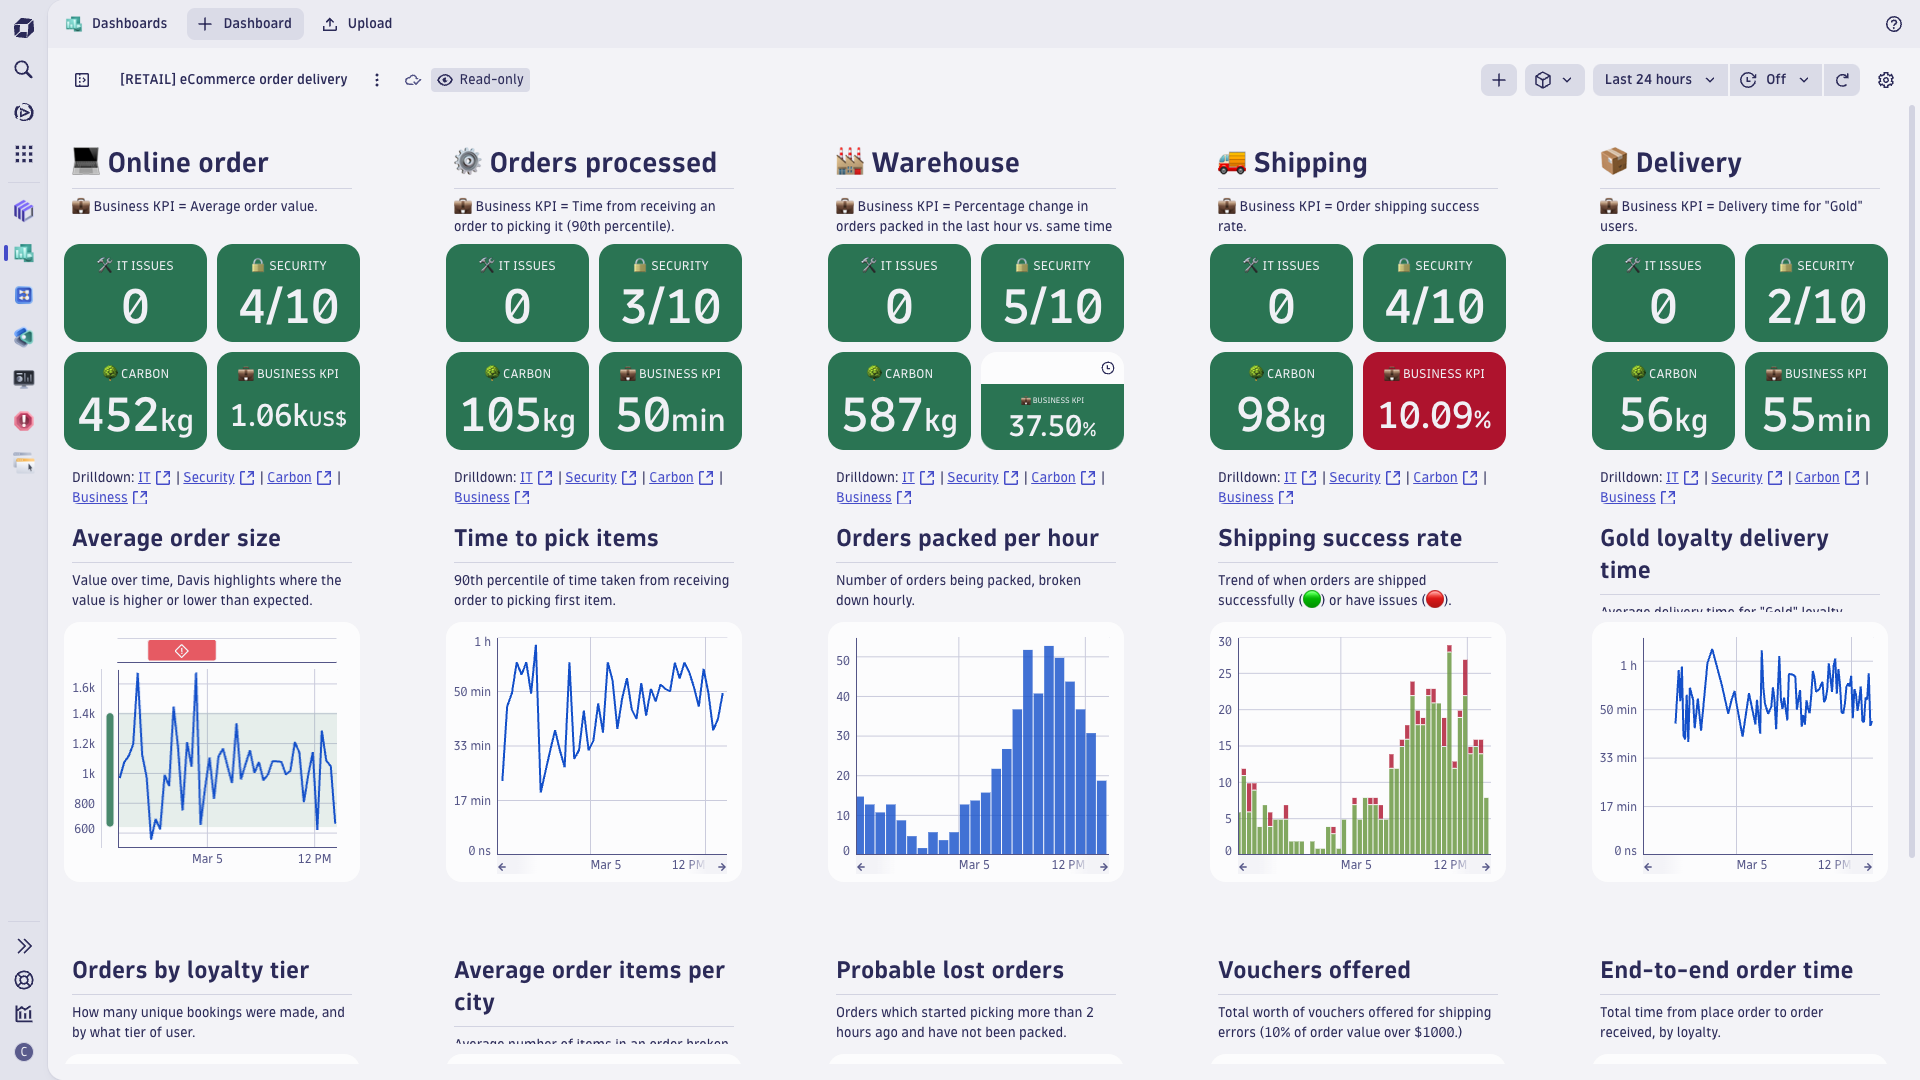
Drive real-time business decisions with automatic IT context
- Understand and report on business health, from executive-level overviews to granular details
- Track business metrics, KPIs, and SLOs, automatically in context with IT infrastructure, services, and databases
- Prioritize improvements and automate remediation based on measurable business impact
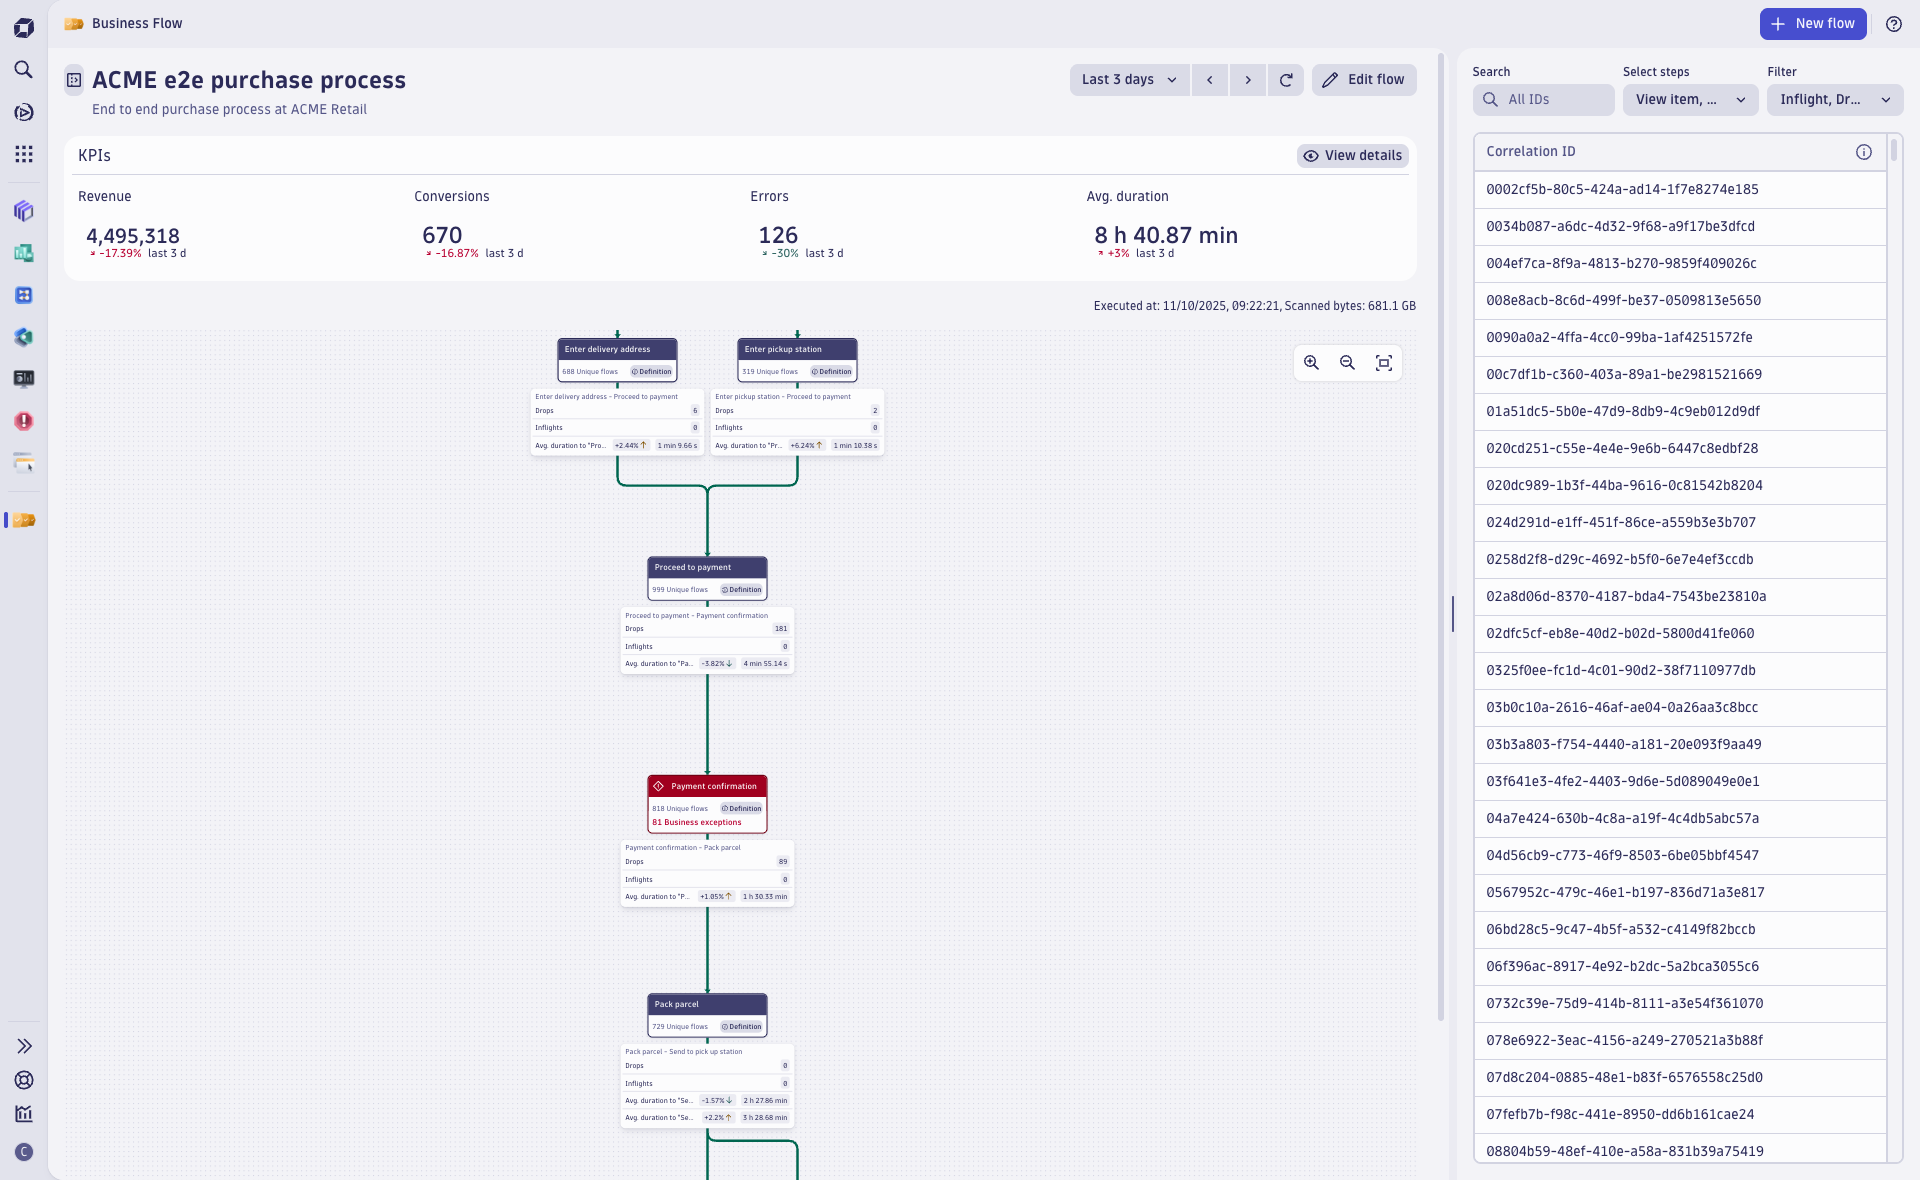
Track, analyze, and optimize business processes
- Track business KPIs, detect process anomalies, and prioritize optimization opportunities within business processes with full IT context
- Increase efficiency, reduce process errors, and improve customer satisfaction
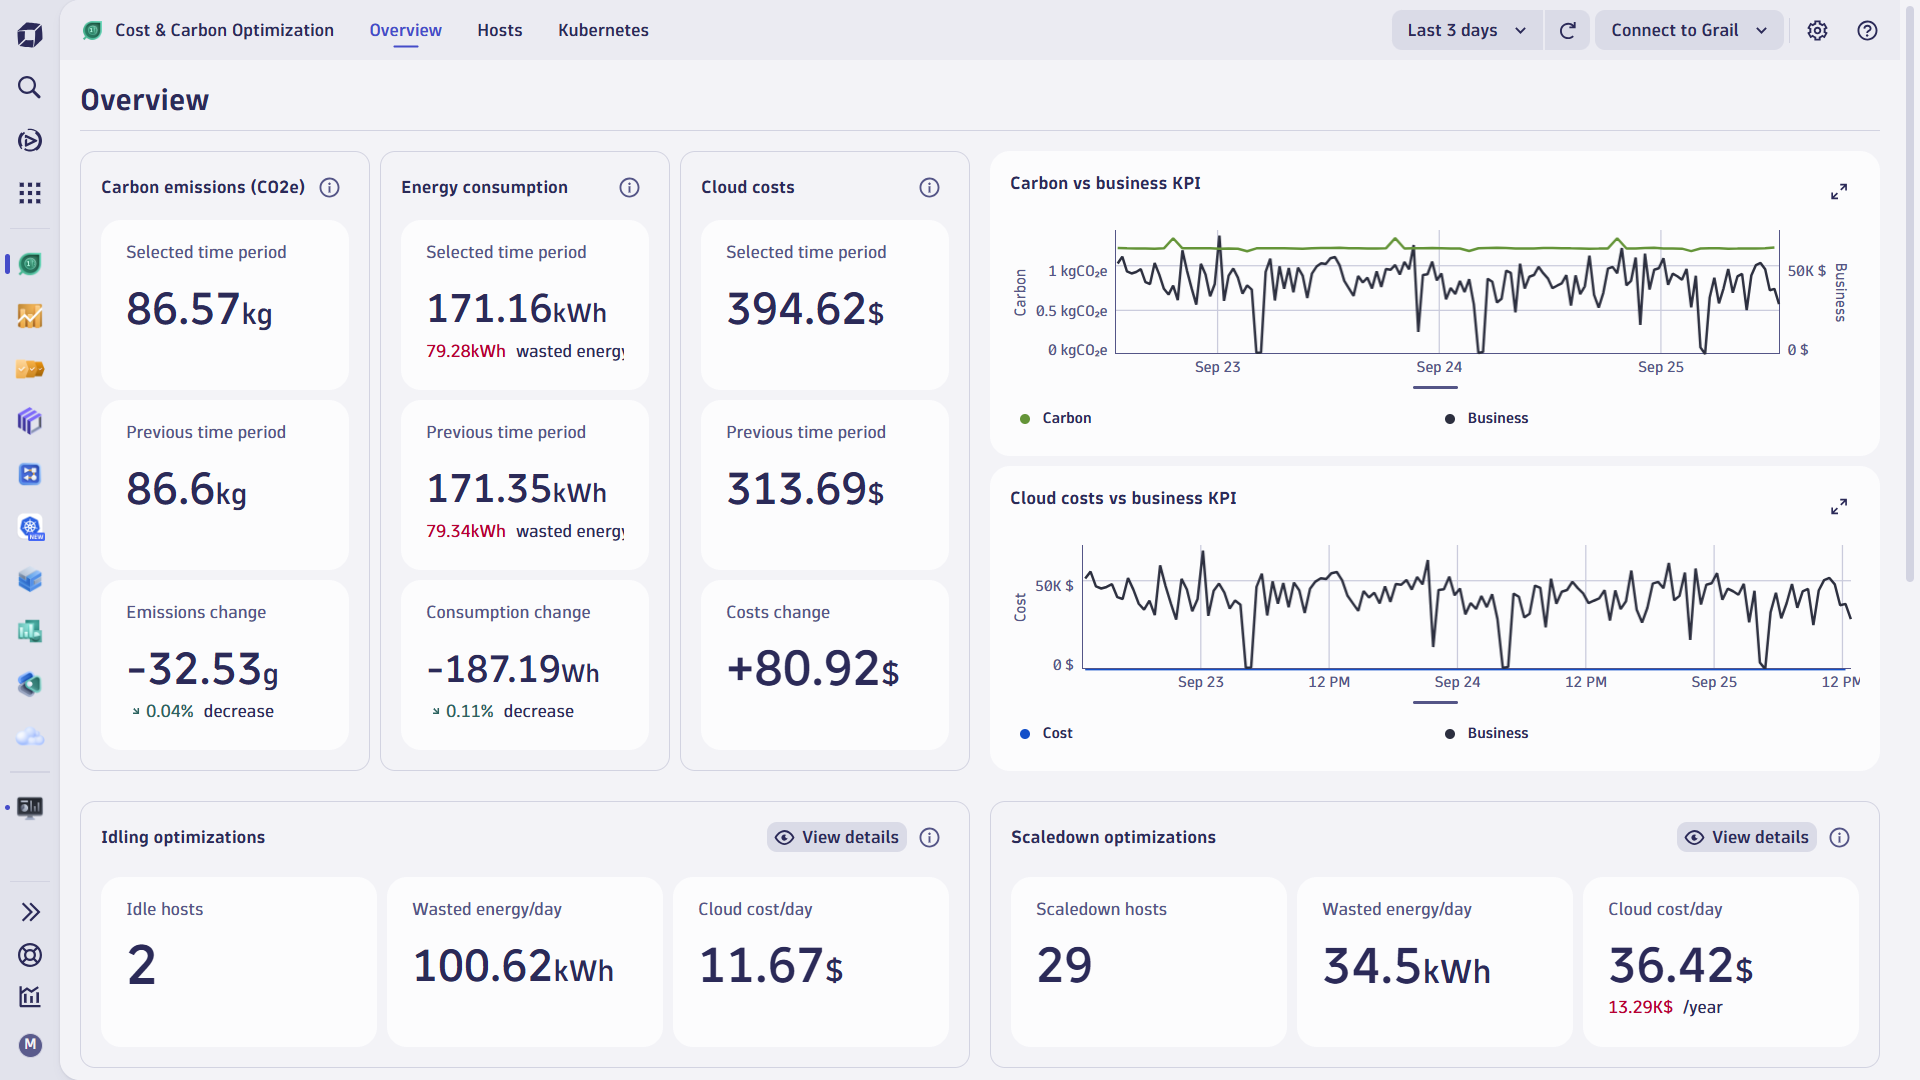
Accelerate sustainability and reduce cloud costs
- Get granular cost and carbon footprint insights with optimization recommendations to help reduce cloud costs and IT carbon emissions.
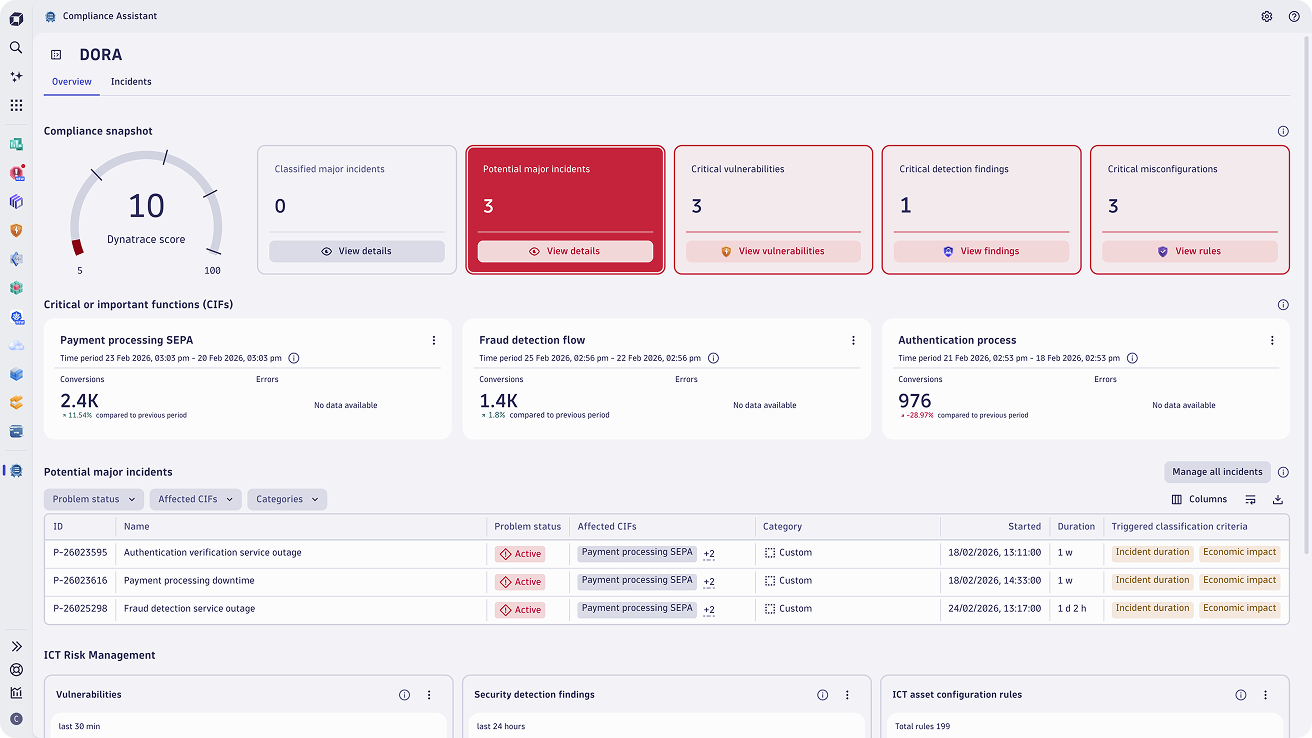
Seamlessly integrate compliance into your IT operations
- Drive collaboration across IT, legal, and business teams by connecting compliance‑relevant IT assets directly to business processes
- Detect major compliance incidents in real time and automatically classify them against regulatory thresholds using AI

Extend your team’s value with expertise-based data analysis and recommendations
The Business Insights team leverages deep Dynatrace expertise to go beyond application performance and unlock more value to drive business decisions.
Customer stories


Learn more about Business Observability
 NEWSStay up to date on Business Observability product enhancements, use cases, and customer stories
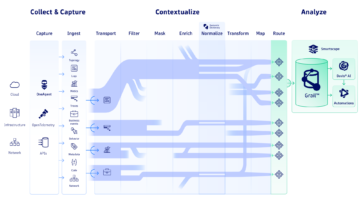 BlogOpenPipeline: Simplify access to critical business data
Learn how OpenPipeline simplifies access to critical business data Observability ClinicDynatrace Business Events: Expanding Observability into your Business Domain


