Enhance your development workflow with the Amazon Q Developer CLI for Dynatrace MCP
Enhance your development workflow by integrating Amazon Q Developer CLI with the Dynatrace AI-powered observability platform using MCP.

Tutorials, tips and resources for engineers on cloud technologies and observability

Enhance your development workflow by integrating Amazon Q Developer CLI with the Dynatrace AI-powered observability platform using MCP.
Learn how to build agentic AI applications using the OpenAI Agents SDK and Azure AI Foundry with Dynatrace AI Observability built in.

Learn how Dynatrace empowers Site Reliability Engineers with end-to-end visibility and control, from code creation to live production.
AI doesn’t replace, but amplifies developers. Those who’ll thrive in this new era aren’t the fastest typists — they’re the clearest thinkers.
Learn how integrated observability helps dev teams spot bugs early, boost code quality, and accelerate software delivery.
AWS publishes Dynatrace-developed blueprint for secure Amazon Bedrock access at scale

Sky-high developer productivity with Dynatrace MCP and GitHub Copilot
Enhance your development workflow by integrating Amazon Q Developer CLI with the Dynatrace AI-powered observability platform using MCP.
Learn how to build agentic AI applications using the OpenAI Agents SDK and Azure AI Foundry with Dynatrace AI Observability built in.

In part 3 of our power dashboarding series, we’ll show you how to apply filtering options to zero in on the most relevant information.
Next-level agentic AI relies on agent-to-agent communication. Discover how to optimize AI agent observability and Amazon Bedrock Agents monitoring.

With agentic AI on the rise, TELUS employs some MCP best practices with Cline and Dynatrace Live Debugger to boost developer experience.
Storing OpenTelemetry signals in one place in context with all other signals creates true unified observability, enabling better analysis.

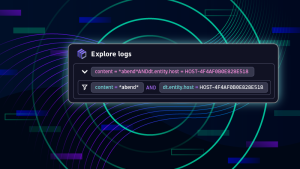
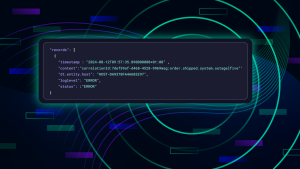
Go big with Dynatrace: Native support for large log records
What is agentic AI? Learn how Model Context Protocol and A2A help next-level AI agents communicate to fuel the latest automation revolution.

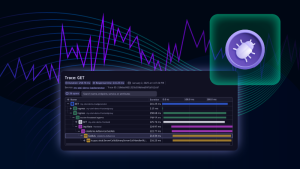
Distributed tracing for developers at every stage of the development lifecycle helps to deliver services that fulfill core business goals.

Enhance observability of modern operating systems and close your Kubernetes monitoring gaps with Journald structured logs.
Part 2 of our power dashboarding series is a dashboards tutorial demonstrating better, faster answers with AI and formatting.

5 powerful use cases beyond debugging for Live Debugger

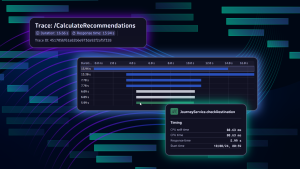
OpenTelemetry demo app dashboards help teams experiment with finding problems using Dynatrace as your full-context OpenTelemetry backend.

Easily experiment with the Astronomy Shop, the OpenTelemetry demo application, using Dynatrace as your full-context OTel backend.

Learn how Dynatrace observability in CI/CD pipelines helps developers debug faster and improve code quality.
Top Custom Solutions 2024: Dynatrace Partner Apps

Start your exploration journey with Dashboards
Leverage Live Debugger, Open Pipeline, and OpenTelemetry to tackle a complex performance issue.
Explore a revolutionary tool providing developers with visibility and data access to their running applications.

Dynatrace harnesses the power of observability and analytics to tailor a new experience for shifting left.
Stay ahead with visual, AI-powered forecasting, or get new insights into your data leveraging Davis CoPilot™.
Get started with Dynatrace support for OpenTelemetry: Learn how to send OpenTelemetry data to Dynatrace.
Solutions for common issues with OpenTelemetry Operator installation, deployment, and auto-instrumentation.

Effective business observability relies on frictionless access to business data.
Discover the "unknown unknowns," diagnose issues, and ensure efficient operations.
Dynatrace support for IBM z/OS automates log discovery and enables collection at scale.
Ingest logs from any system and extract relevant business data to get an end-to-end view of business processes.

Failure in processing batch job runs can result in disruptions, missed deadlines, and unprocessed tasks, impacting system efficiency.

The Omnilogy solution allows observability all in one place, including your CI/CD pipeline, while reducing tool sprawl.

Learn how to implement OpenTelemetry and Dynatrace to enhance the monitoring and management of aviation IoT data.
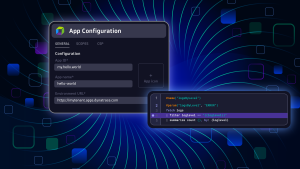
The VS Code extension 'Dynatrace Apps' is here to streamline your development process and simplify app building.
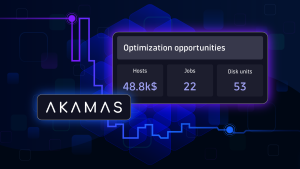
Akamas used its domain expertise and unique product capabilities to build a custom app on the Dynatrace platform.