
Distributed tracing helps analysts throughout the organization understand the relationships among services to troubleshoot problems. But distributed tracing is a crucial capability at every stage of the software development lifecycle. Discover distributed tracing best practices to help troubleshoot, gain critical input for design, feedback for implementation, and precision answers for automating. These best practices help developers deliver seamless services for customers and essential business goals for the organization.
For developers, the ultimate win is creating impactful features, shipping them quickly, and confidently implementing fixes when needed. Distributed tracing plays a critical role in achieving these goals. As a core component of observability, it provides the insights developers need to write better code, collaborate efficiently, and increase application reliability.
Developers know how challenging it can be to follow traces from beginning to end across multiple entities and data providers. Harder still is following those traces in context with metrics, logging data, security details, and real user experience data. Certain tools may provide visibility into small segments or isolated details. But developers often have to piece these clues together manually, which makes it difficult to extract meaningful and reliable results.
Dynatrace delivers distributed tracing with capabilities designed to streamline workflows. From understanding the impact of code changes to quickly resolving issues flagged in production, here’s how distributed tracing can help you increase developer velocity and deliver meaningful innovation throughout the software development lifecycle (SDLC).
Distributed tracing best practices key takeaways:
- Visualize and understand your system. Distributed tracing plays a key role in uncovering the topology, interactions, and dependencies of your services.
- Analyze and fix problems fast. Combine distributed tracing with AI analysis, context-driven querying, and collaboration tools.
- Build better software with telemetry data in context. Unify telemetry data
- Automate to ship better code faster. Use distributed tracing to automate and streamline workflows and set up intelligent alerts.
Visualize and understand your system
|
|
|
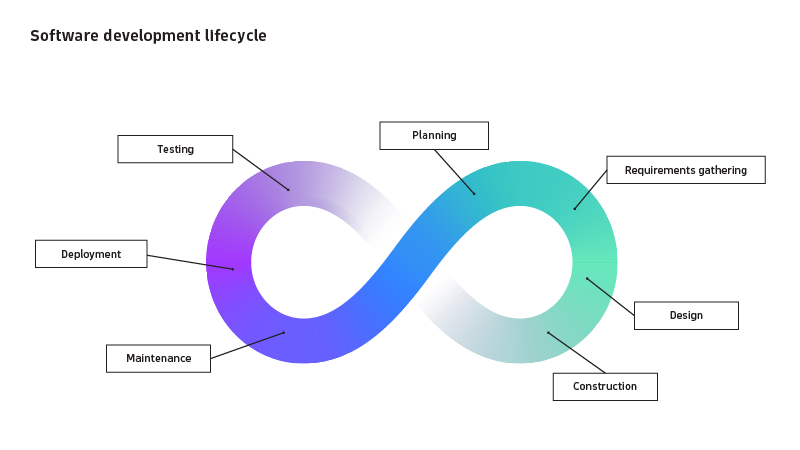
Before implementing changes or designing new features, it’s essential to have a clear understanding of your system’s current state. Without a clear picture of your current system, any change risks overlooking critical dependencies and misalignment with your architecture, whether in the cloud or on-premises. Distributed tracing plays a key role in uncovering the topology, interactions, and dependencies of your services, giving developers the visibility they need to make informed decisions.
Dynatrace Smartscape® technology automatically maps horizontal service relationships, offering real-time visualization of service connections and dependencies. This end-to-end view helps developers quickly understand how components interact within the overall system.
For a more granular understanding, inspecting individual traces allows you to focus on specific workflows or problematic behaviors. This depth of insight can help you plan better and identify challenges early, reducing surprises during later stages of development.
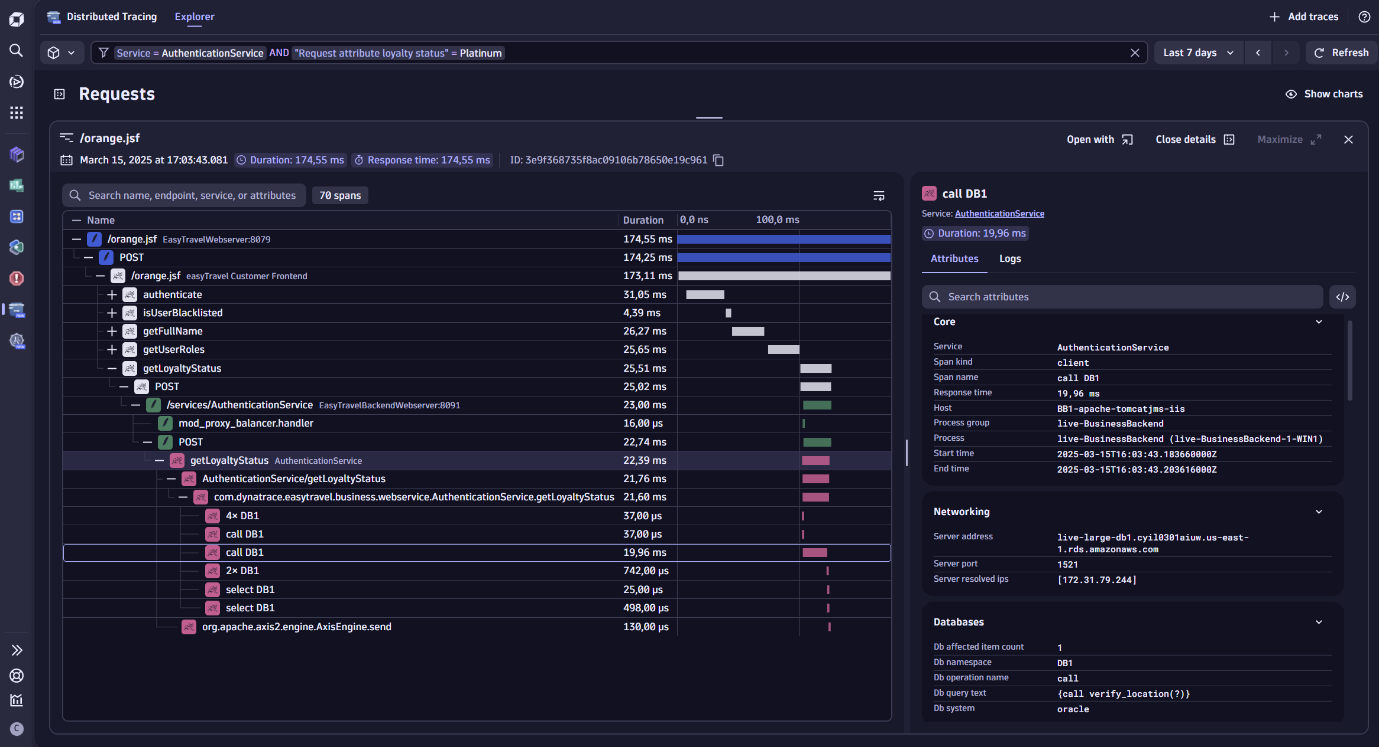
Trace example: Verifying service for “platinum” loyalty users
Say you’re a developer on an app called “AuthenticationService.” You can select a trace that lets you visualize its path through your system and examine each span’s properties to ensure “Platinum” loyalty users are being served effectively. While understanding the state of your system is important at each stage of the SDLC, it’s often one of the first steps in planning, requirements gathering, and designing changes.
In Dynatrace, you would open the Distributed Tracing app and enter a filter for the request attribute that indicates loyalty status. This filter returns a list of traces you can inspect individually to understand any bottlenecks or issues that could be impacting this specific subset of customers.
Analyze and fix problems fast using distributed tracing for developers
|
|
|
Identifying root causes in complex microservice-based architectures can be tough, but Dynatrace Davis® AI analyzes dependencies in real time, helping you quickly and confidently resolve issues.
But what if you want to visualize data outside of an individual problem occurrence? Some issues occur repeatedly in specific areas of a system, while others arise from application changes. Problems often span multiple teams, requiring collaboration to resolve effectively.
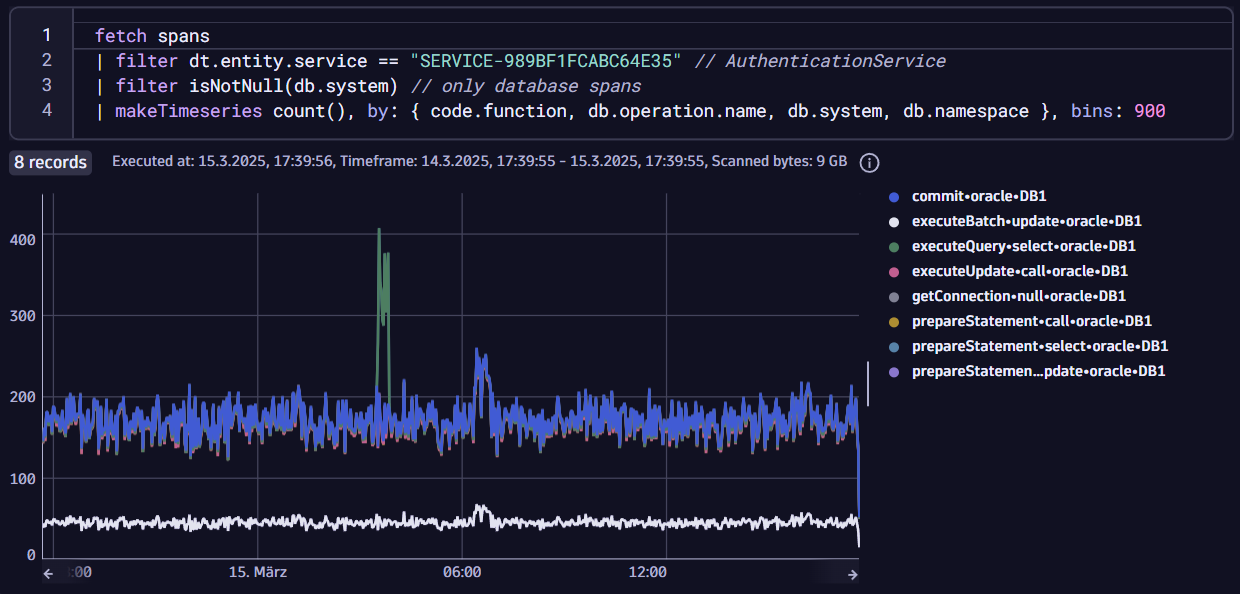
For broader insights, the Dynatrace Distributed Tracing app provides flexible access to raw trace data. You can filter by namespace, release version, or database calls, then Dynatrace automatically generates a DQL (Dynatrace Query Language) query so you can view results in notebooks or pin visuals to dashboards, which enable you to collaborate seamlessly with other teams. This approach is particularly useful during testing, deployment, and maintenance, where visibility into system behavior is critical.
This example shows a plot generated by a DQL query that indicates the number of database calls an application makes and how they perform over time.
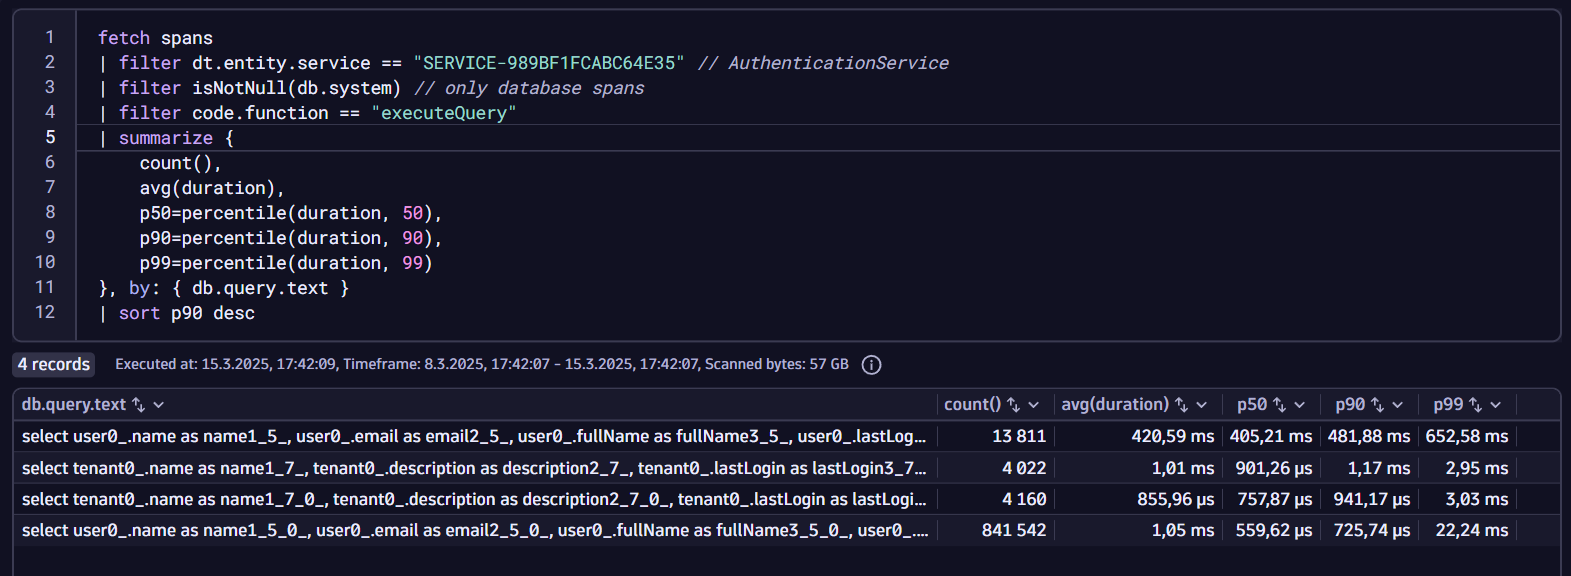
Let’s assume you’re also interested in how your database queries are performing. To get an instant performance summary, you can easily add a table to your dashboard that summarizes the count, average, and percentiles of the durations of your database spans.
Build better software with telemetry data in context
|
|
|
Developers juggle many responsibilities, from testing and deploying code to maintaining stability. However, fragmented workflows and the endless search for the right information can often slow progress and create frustration, making it harder to meet deadlines and maintain a focus on innovation.
As a developer, how can you get the information you need without wasting time chasing down data and trying to understand all its upstream and downstream effects? The answer: distributed traces and telemetry data in context.
Flexible access to unified telemetry data is a game-changer for developers. With Dynatrace, you can seamlessly query multiple telemetry data sets and visualize the results in ways that align with your specific needs. This flexibility empowers you to connect the dots across complex workflows, analyze incidents within their broader context, and make data-driven decisions that support automation and enhance software quality.
The example below brings together spans and logs. Dynatrace automatically enriches every log with trace and span IDs, making it simple to track correlations among related data. With Dynatrace Query Language (DQL), you can dynamically combine spans and related log content on-the-fly.
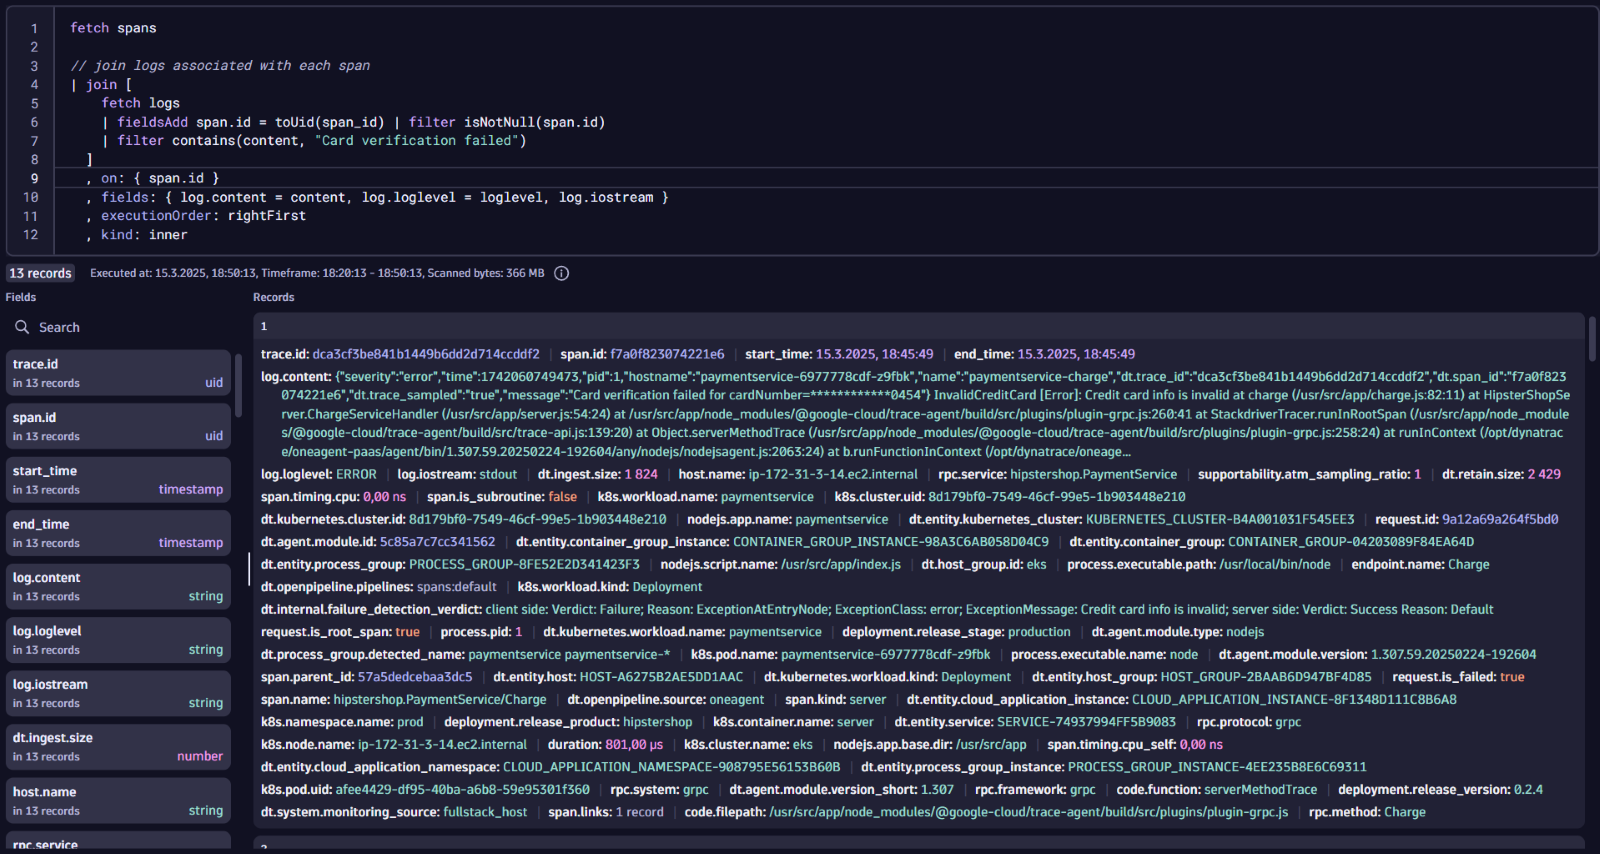
To understand the impact of an error, you can chart which services and endpoints are emitting this log error.
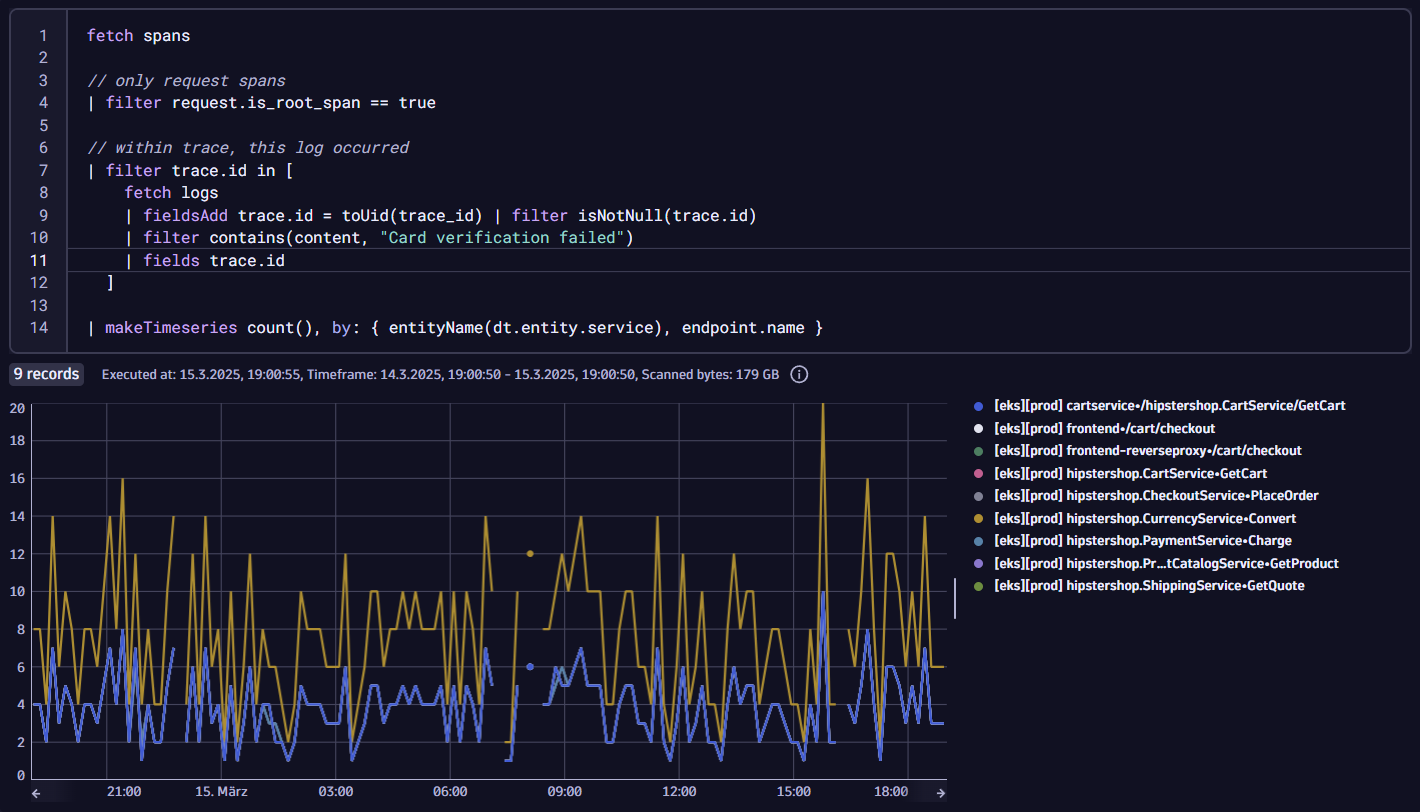
As a developer, you can unlock deeper insights, linking operations to specific errors and enabling you to assess the scope and impact of incidents accurately. This gives you and your teams the ability to move beyond reactive problem-solving into proactive, intelligent development.
Use distributed tracing for developers to automate and ship better code faster
|
|
|
Automation is key to accelerating development while maintaining quality. By streamlining workflows, automating repetitive tasks, and setting up intelligent alerts, teams can proactively address issues and minimize manual effort.
For example, as a developer, you can use trace data to establish quality gates or set alerts for specific exceptions, ensuring you can quickly flag and resolve any recurring problems. This approach boosts efficiency and ensures that teams can consistently deliver high-performing, reliable code to production.
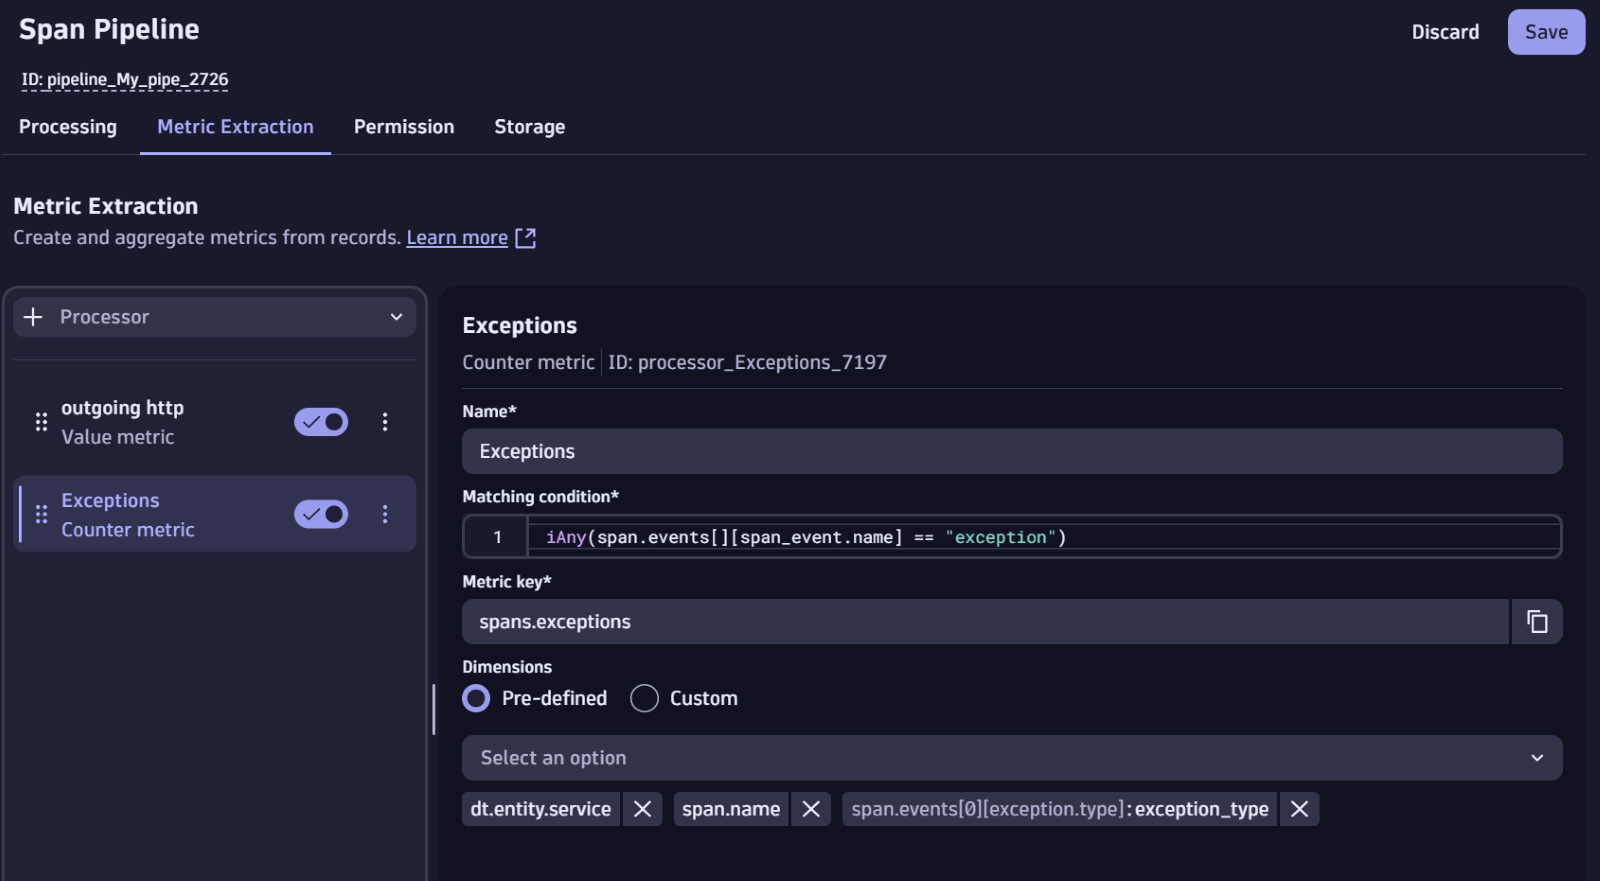
Assume you’ve been working on a bug that appeared as an exception in your traces. You want to check if the bug has been fixed and set up an alert to get a reminder if this particular bug comes back.
Let’s start by creating a metric based on this particular exception in the Dynatrace stream-processing data ingestion technology, OpenPipeline™. By creating a metric at ingestion using OpenPipeline’s centralized data handling and advanced data processing capabilities, you can continually monitor for evidence of the exception recurring.
You can use this extracted metric to visualize its frequency over time in a dashboard.
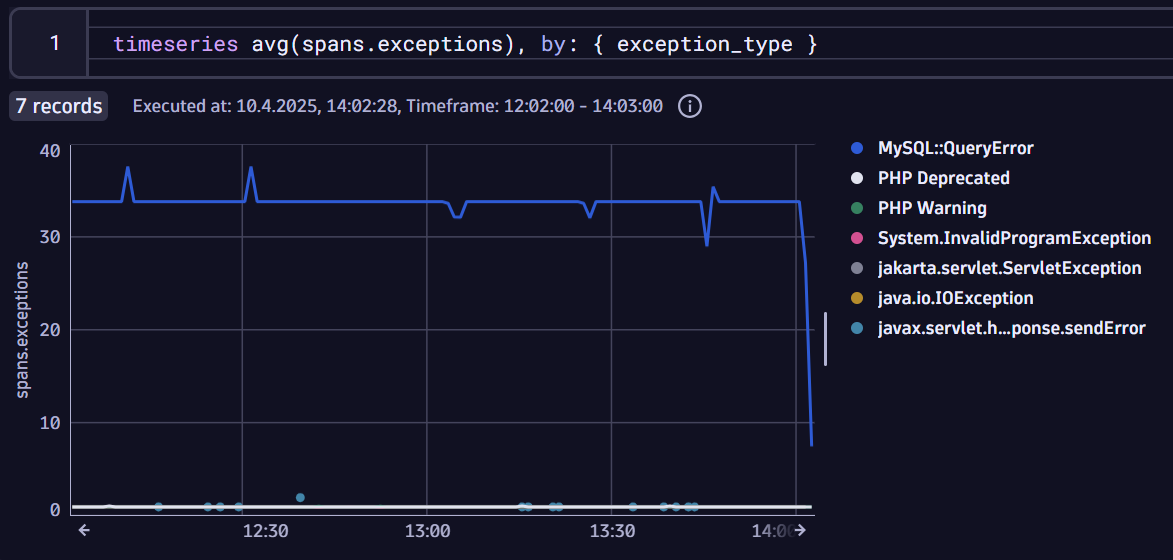
Finally, once you’ve set up a metric, you can use it to create an alert and send a notification to your system of choice (such as Slack, Teams, ServiceNow, and so on).
Increase reliability and automate more with distributed tracing best practices
As development responsibilities continue to expand in today’s complex environments, distributed tracing has emerged as a critical tool for developers throughout the entire software development lifecycle.
Applyin these distributed tracing best practices helps developers visualize systems, resolve issues quickly, and streamline workflows. By providing deep insights and context of upstream and downstream events, traces and spans give teams the data they need to automate tasks and deliver more reliable, higher-quality software faster and with greater confidence. The result allows you to focus on what matters most: creating impactful features.
Start integrating distributed tracing into one part of your workflow today and see how quickly it becomes indispensable to your development practice.
If you’re new to Dynatrace and want to explore distributed tracing best practices with your own data, check out our free trial.


Looking for answers?
Start a new discussion or ask for help in our Q&A forum.
Go to forum