
In this blog post, we demonstrate how Dynatrace® observability in CI/CD pipelines provides detailed insights that help developers debug faster and improve code quality.
In this blog post, we guide you through configuring a project to visualize real-time CI/CD build and release data for your Azure DevOps pipelines. The resulting visibility enhances collaboration with transparent data, increases productivity by automating monitoring tasks, and enables teams to detect issues proactively. With insights into your Azure DevOps pipelines, you can continuously improve processes, ensuring smoother and more reliable deployments over time.
A notebook version of the blog is also available on the Dynatrace GitHub repository. Download the
AzureDevOps - Dynatrace Integration.jsonfile and upload it to your Notebooks app in Dynatrace.
Prerequisites
Before we begin, ensure you have the following:
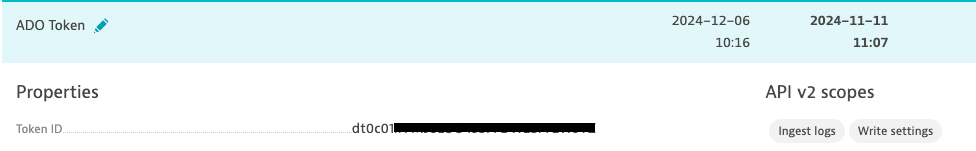
- Access to your Dynatrace Tenant and permission to create tokens.
- Your tenant ID, which can be found in your environment URL:
https://<YOUR_TENANT_ID>.live.dynatrace.com/. - A token with Ingest Logs v2 scope.
- A token with Write Settings scope.
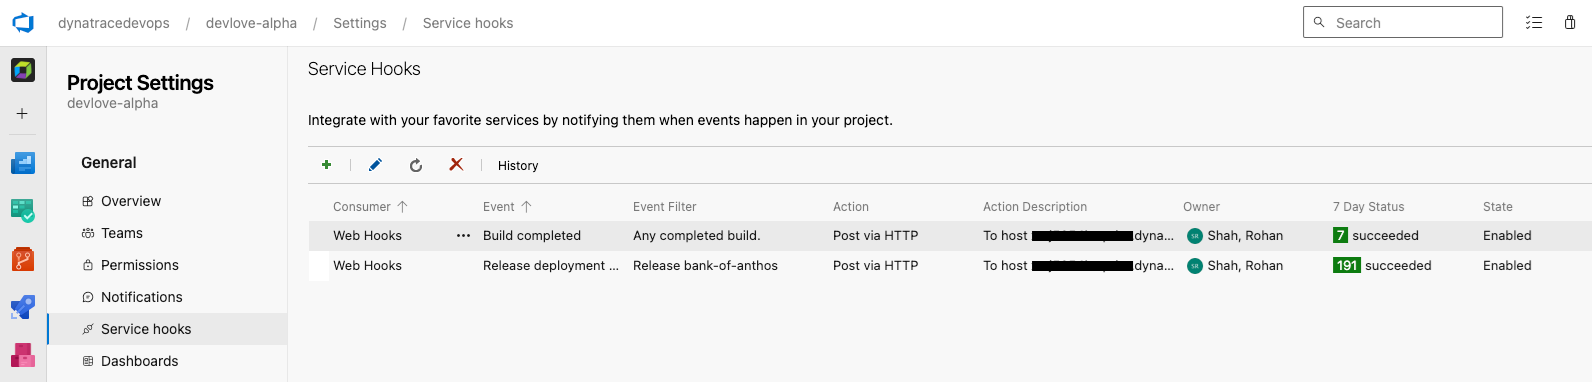
Create webhooks in Azure DevOps
First, we need to create two service hooks subscriptions in Azure DevOps: one for Builds Completed and one for Release Deployment Completed.
- Navigate to https://{orgName}/{project_name}/_settings/serviceHooks.
- During the configuration, do not apply any filters.
- In the settings page of the subscription, fill in the following fields:
- URL:
https://<YOUR_TENANT_ID>.live.dynatrace.com/api/v2/logs/ingest - HTTP Headers:
Authorization: Api-token <YOUR_LOG_INGEST_TOKEN> - Ensure the text above is copied exactly, replacing only the token.
- Change “Messages to send” and “Detailed Messages to send” to Text.
- URL:
Add a new Grail logs bucket
Follow these steps to create a new logs bucket in Dynatrace. Note: This step is optional. You’re welcome to use an existing Grail logs bucket.
- Open the Storage Management app in your tenant: Select CTRL/CMD + K and enter Storage.
- Create a new bucket by selecting + in the top right corner.
- Name the bucket
azure_devops_logs. - Set the retention time as desired.
- Set the bucket type to logs.
Configure OpenPipeline with log processing rules
Using OpenPipeline™, you can easily define a rule that routes all relevant log lines you created in the previous step into the bucket. This process also performs the necessary processing steps, such as renaming fields or transforming log data into dedicated events.
- Open the OpenPipeline app and select Logs in the left pane.
- Select the Pipelines tab and create a new one by selecting + Pipeline.
- Name the new pipeline
AzureDevOps. - Go to Dynamic Routing and create the following new rule:
matchesPhrase(eventType,"ms.vss-release.deployment-completed-event") OR matchesPhrase(eventType,"build.complete")
- From the Pipeline dropdown, select “AzureDevOps”.
- Return to your pipelines and open “AzureDevOps”.
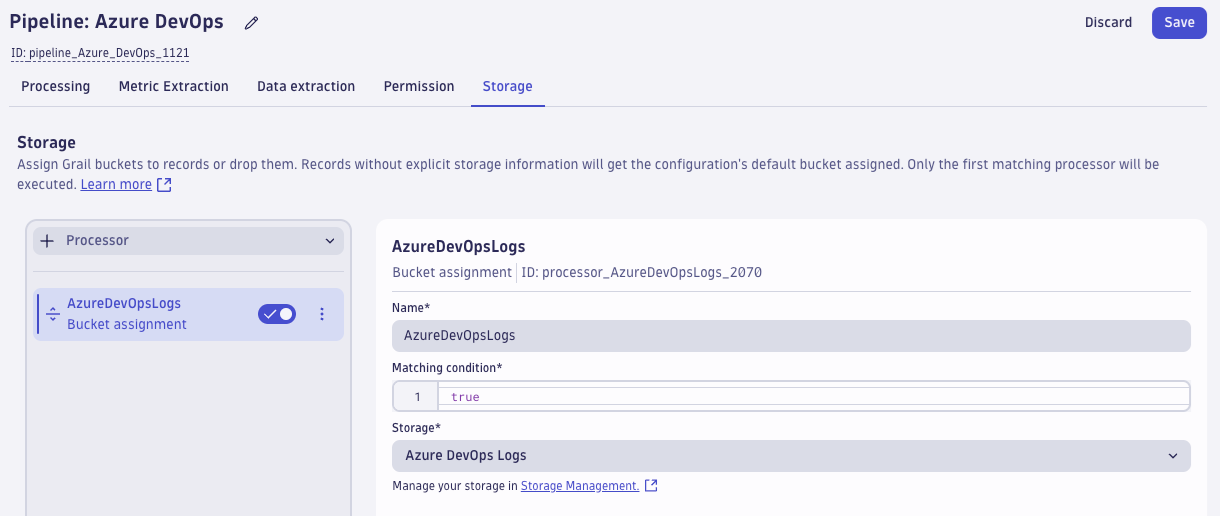
- Under the Storage section, add a new processor > Bucket assignment, set a name and select the azure_devops_logs bucket from the dropdown.
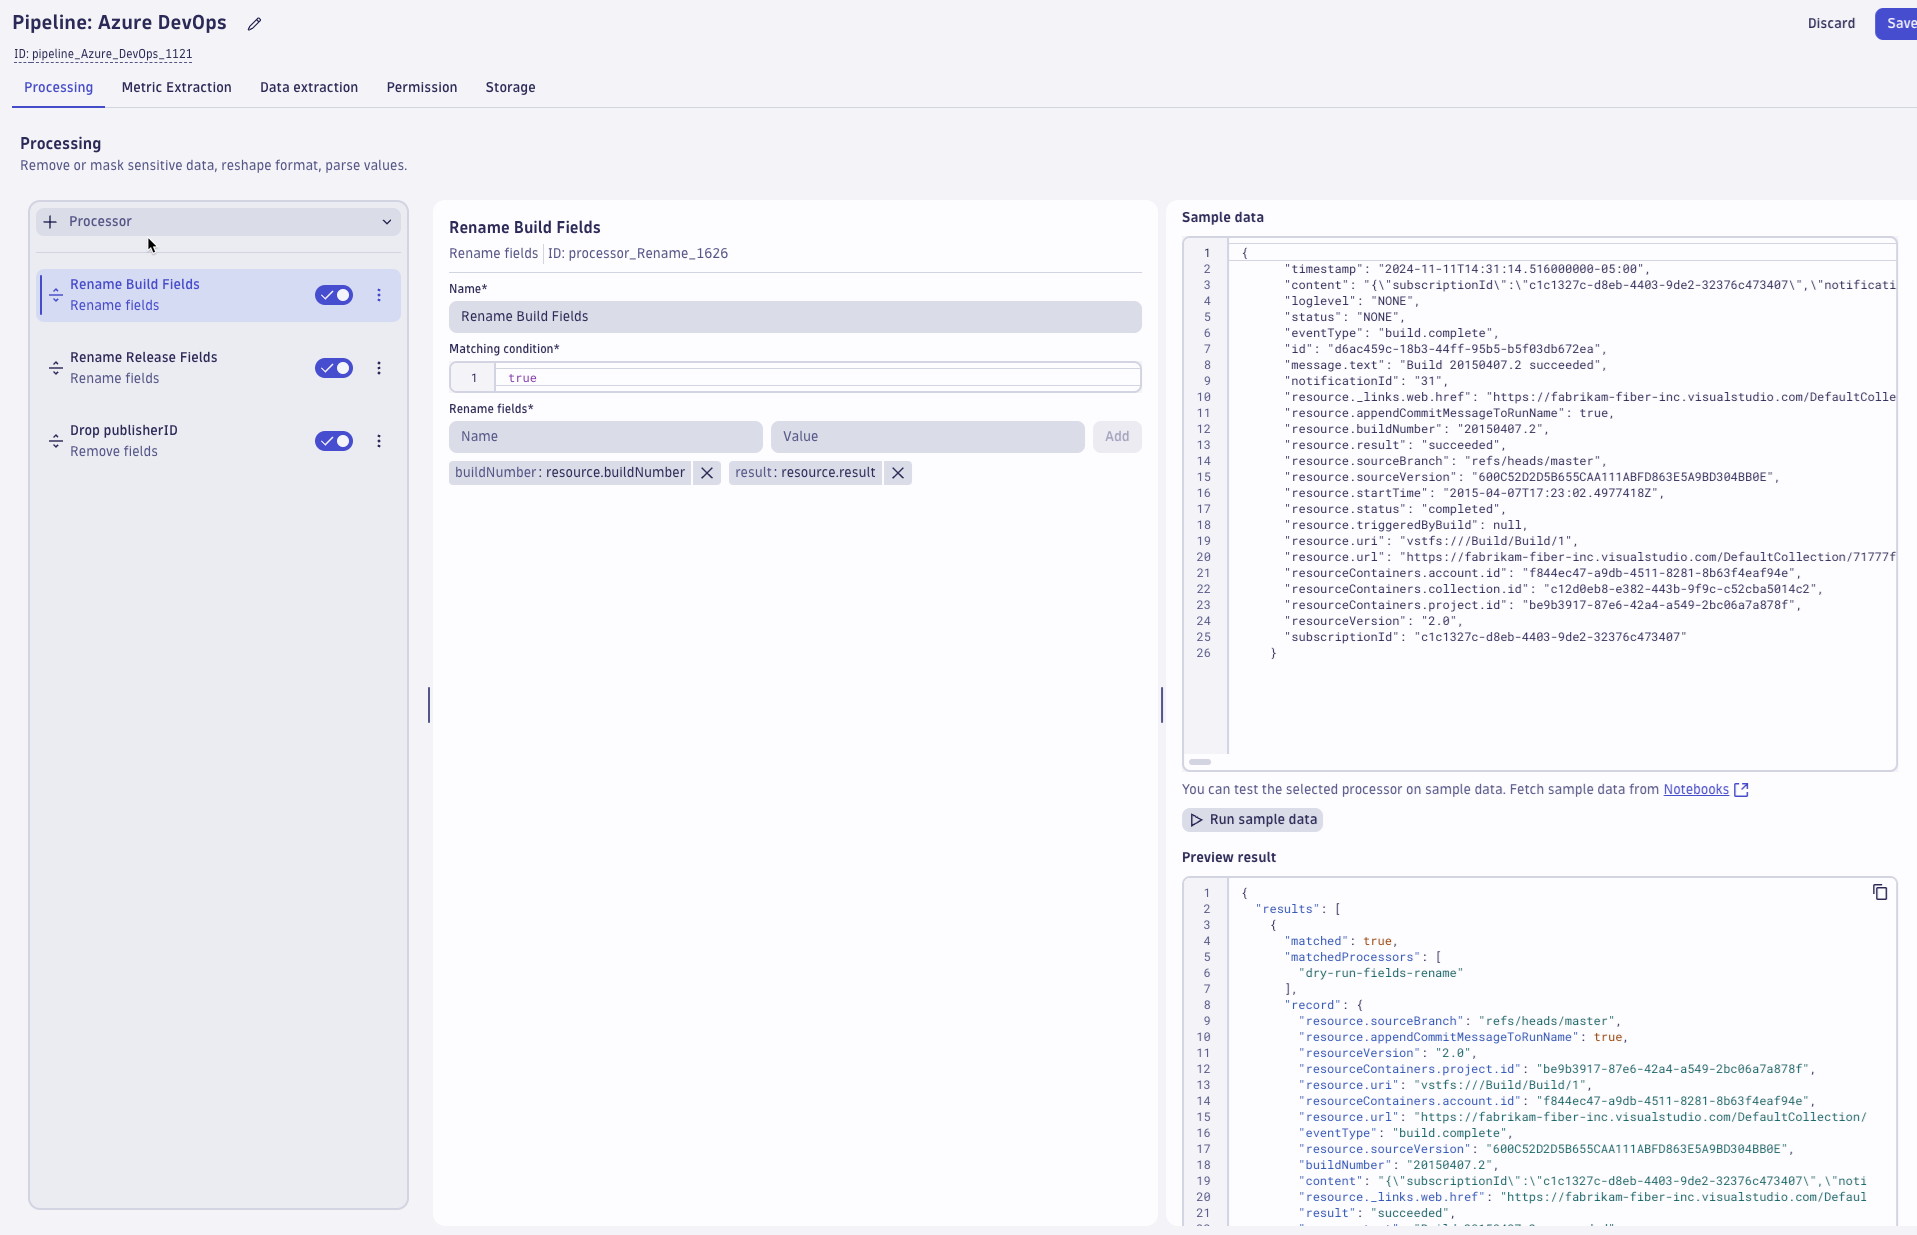
- Next, open the Processing tab and define a couple of rules.
- First, create a new Rename Fields rule and call it “Rename Build Fields” where the left value is the new field name and the right value is the existing field name.
1. resource.buildNumber: buildNumber
2. resource.result: result
-
- Second, create another Rename Fields rule called “Rename Release Fields” where the left value is the new field name and the right value is the existing field name.
1. resource.stageName: stageName
2. resource.project.name: projectName
3. resource.deployment.release.name: releaseName
4. releaseStatus:resource.environment.status: releaseStatus
Use the following sample data to verify your rules are working as expected.
Release event sample data:
{
       "timestamp": "2024-11-11T15:14:51.104000000-05:00",
       "loglevel": "NONE",
       "status": "NONE",
       "createdDate": "2024-11-11T20:14:50.6300269Z",
       "detailedMessage.text": "Deployment of release Release-946 on stage Staging succeeded. Time to deploy: 00:14:14.",
       "dt.auth.origin": "dt0c01.YFMJ6LUO43SFFDW2SF7EW5YZ",
       "eventType": "ms.vss-release.deployment-completed-event",
       "id": "1862ab11-c0d4-451a-8b9b-0dfe7f517297",
       "message.text": "Deployment of release Release-946 on stage Staging succeeded.",
       "resource.environment.status": "succeeded",
       "resource.project.name": "devlove-alpha",
       "resource.stageName": "Staging",
       "resource.deployment.release.name": "Release-946"
    }
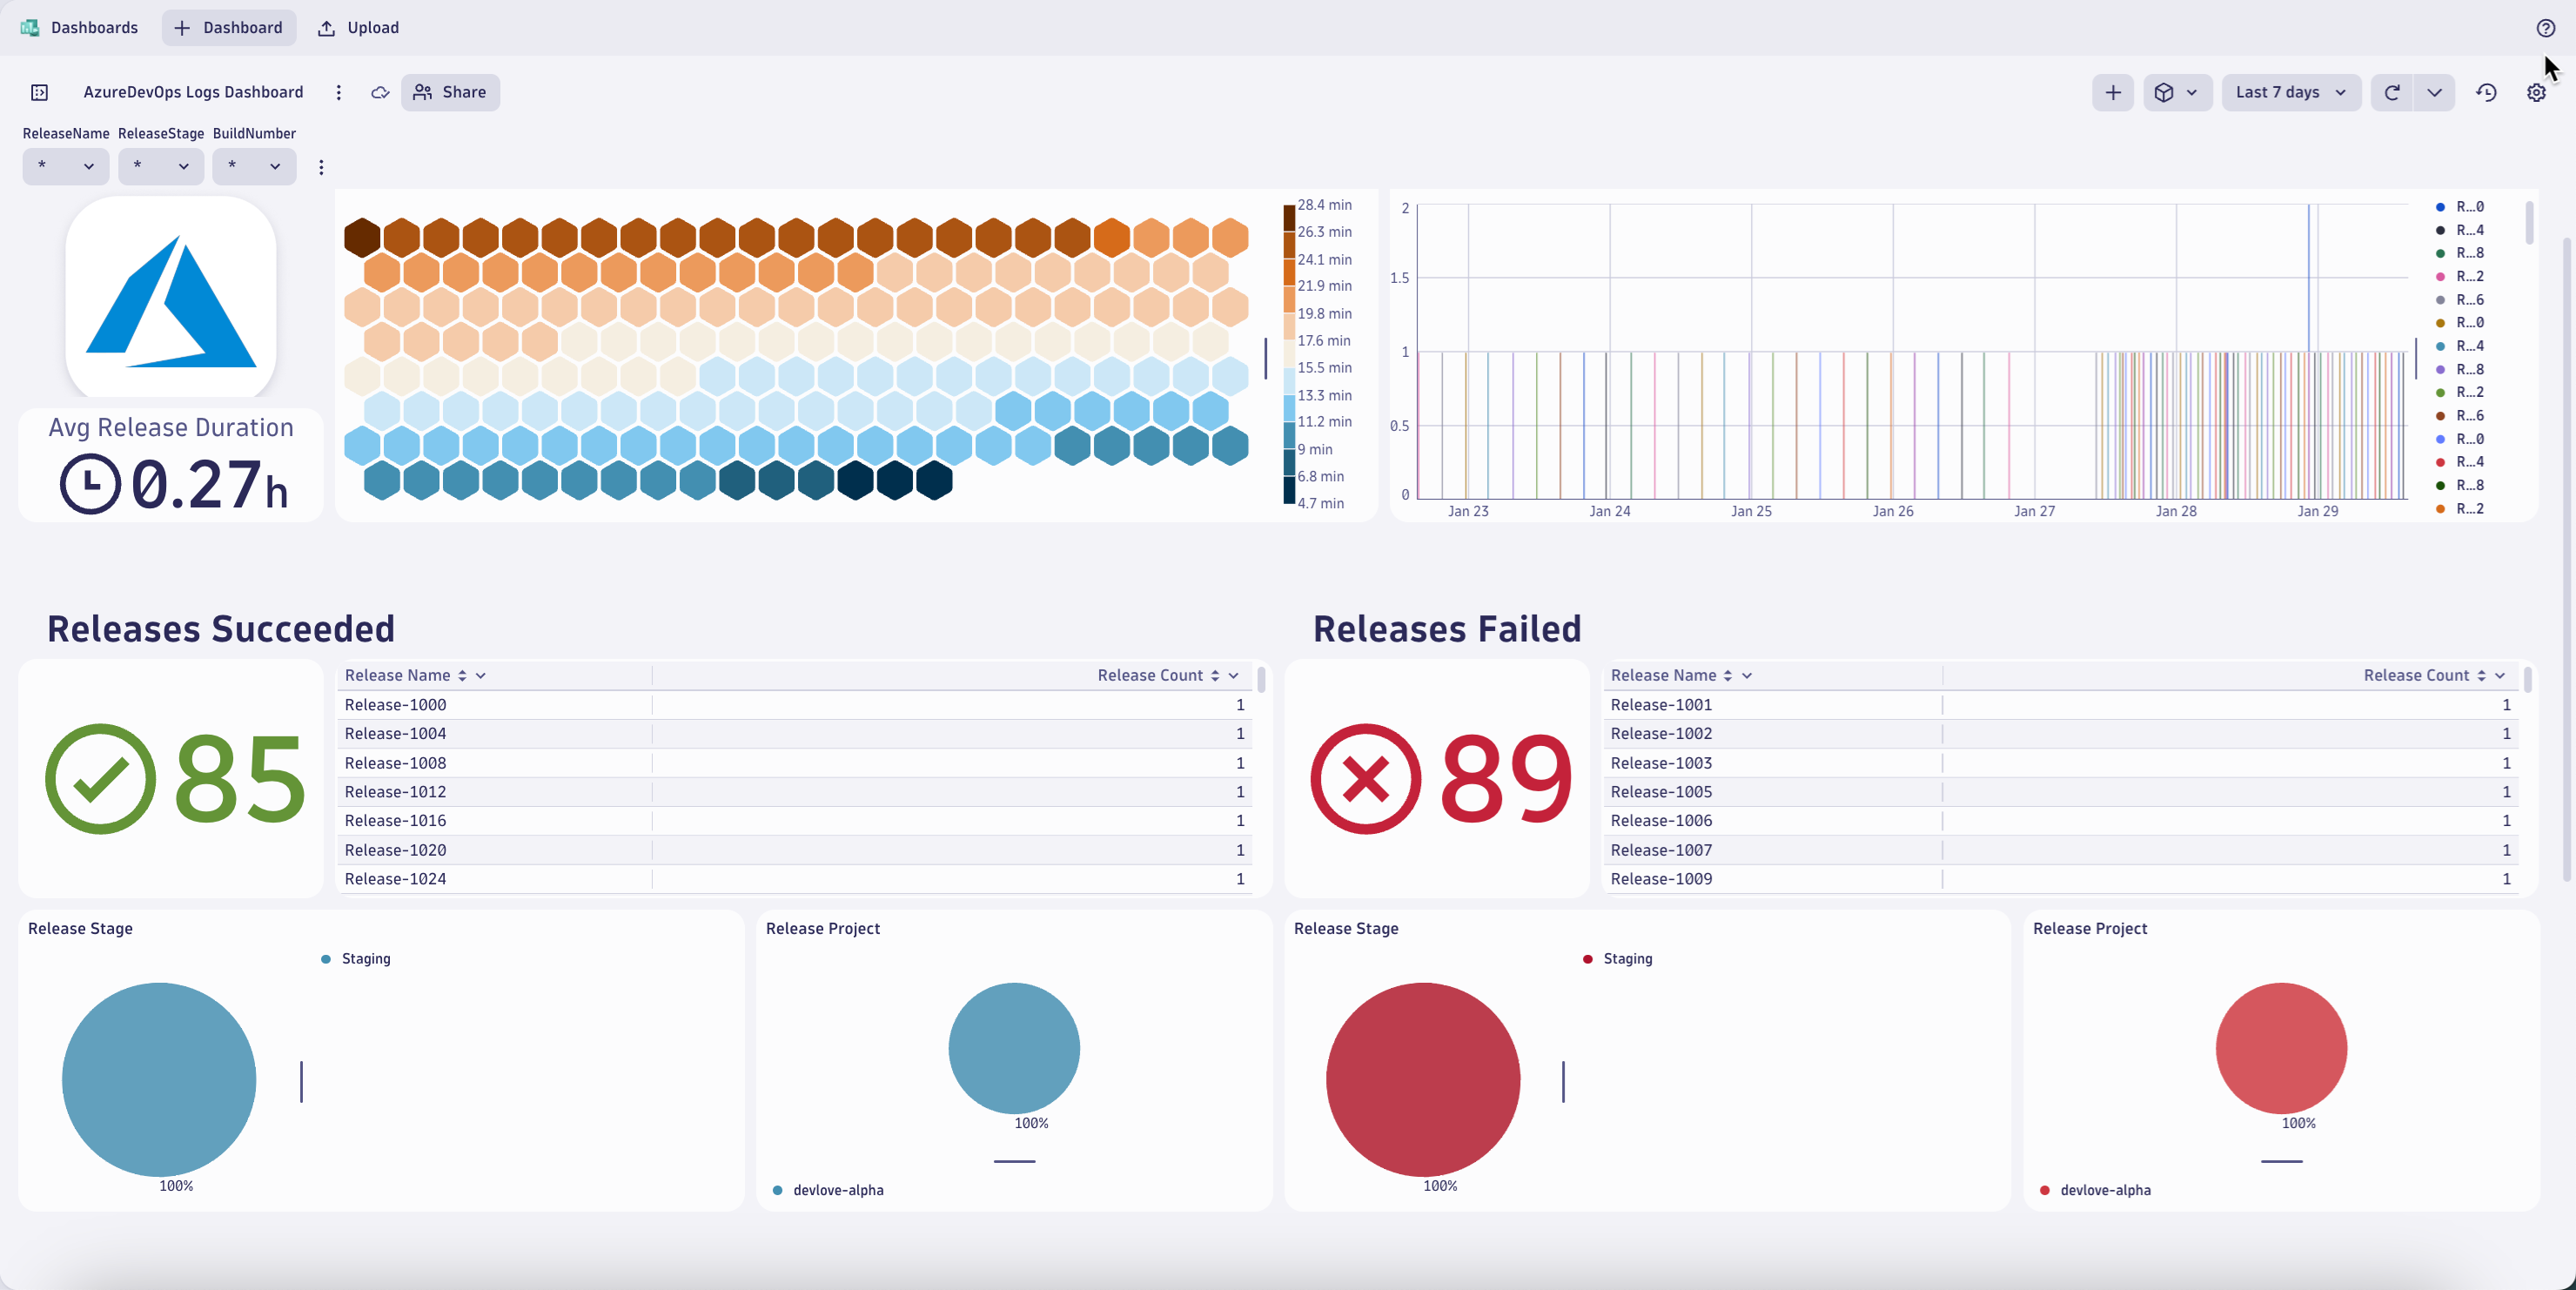
Create an Azure DevOps dashboard and visualize log data
Now that we have ingested the logs coming from AzureDevOps, let’s visualize the data to get better and quicker insights into our CICD pipelines.
- Go to the AzureDevOps Git Repository and download the AzureDevOps Dashboard (on Logs).json file.
- Within Dynatrace, open the Dashboards app and select Upload at the top left corner.
- Upload the JSON file to start visualizing your Azure DevOps data.
Extract “release” and “build” events
Taking this a step further, we can convert the ingested log data to SDLC (Software Development Lifecycle) events in case we detect a new release or build and discard the related log line afterward.
This helps reduce the number of stored log data and supports further platform engineering use cases, such as calculating DORA metrics, automating development processes, or observing the health of your engineering pipeline.
Disclaimer: The following instructions extract Business events from log data. Once supported by OpenPipeline we propose to extract Software Development Lifecycle Events (SDLC events), which are the preferred way of storing the extracted information.
Note: You may need to request a Log Content Length (
MaxContentLength_Bytes) increase depending on how many steps your Release Events have. The integration generates ingest costs for logs and metrics (according to your rate card), depending on how many build/release events you ingest.
- In Dynatrace, open OpenPipeline:
- Go to OpenPipeline > Logs > Pipelines > AzureDevOps.
- Navigate to the Data Extraction section.
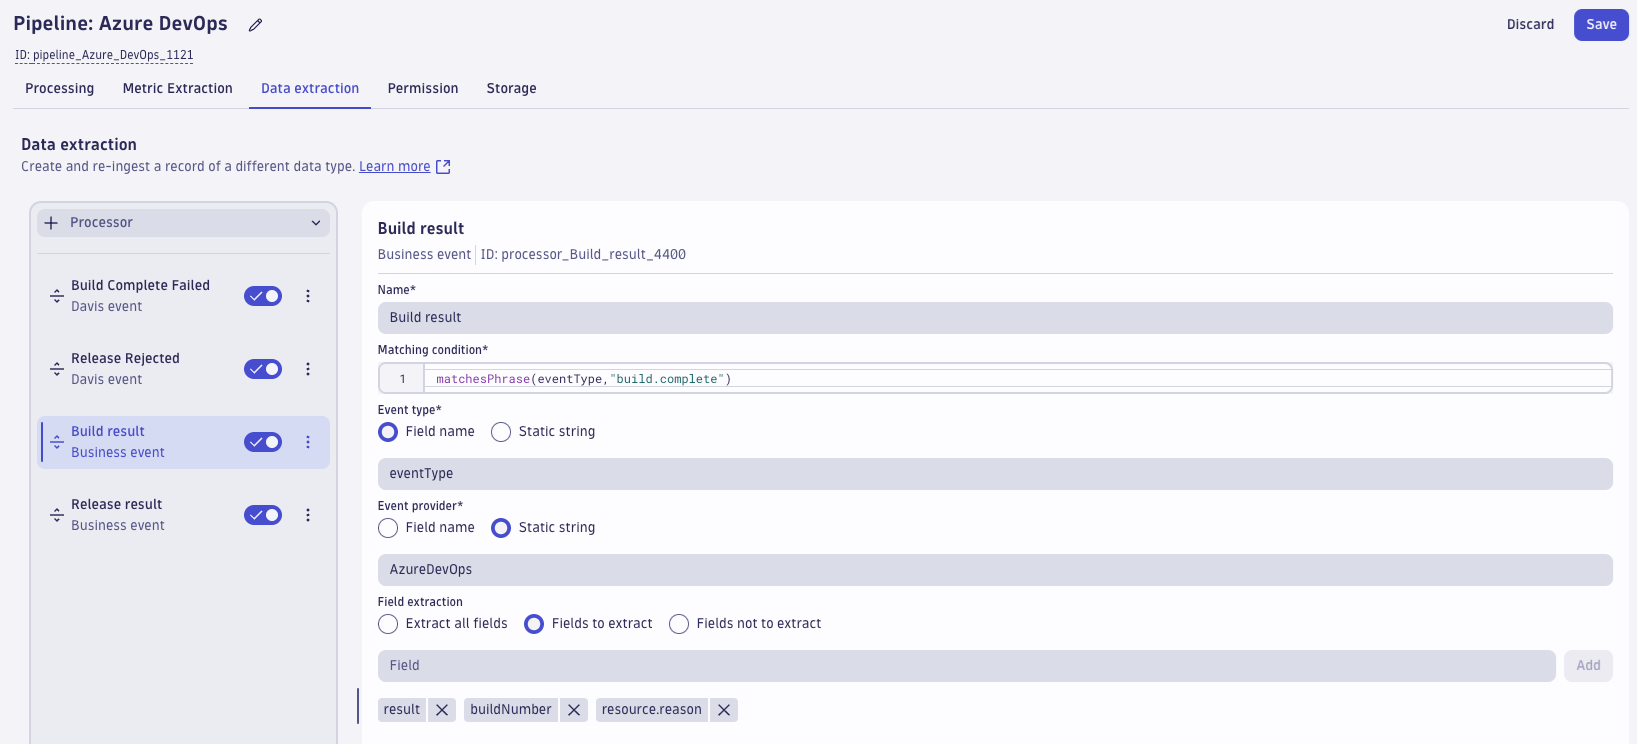
- Next, create a Business Event Processor rule, for all build events, using the following parameters:
- Name: Build Result
- Matching condition:
matchesPhrase(eventType,"build.complete") - Event type: field name
eventType - Event provider: Change to Static String:
AzureDevOps - Fields to extract:
result,buildNumber,resource.reason
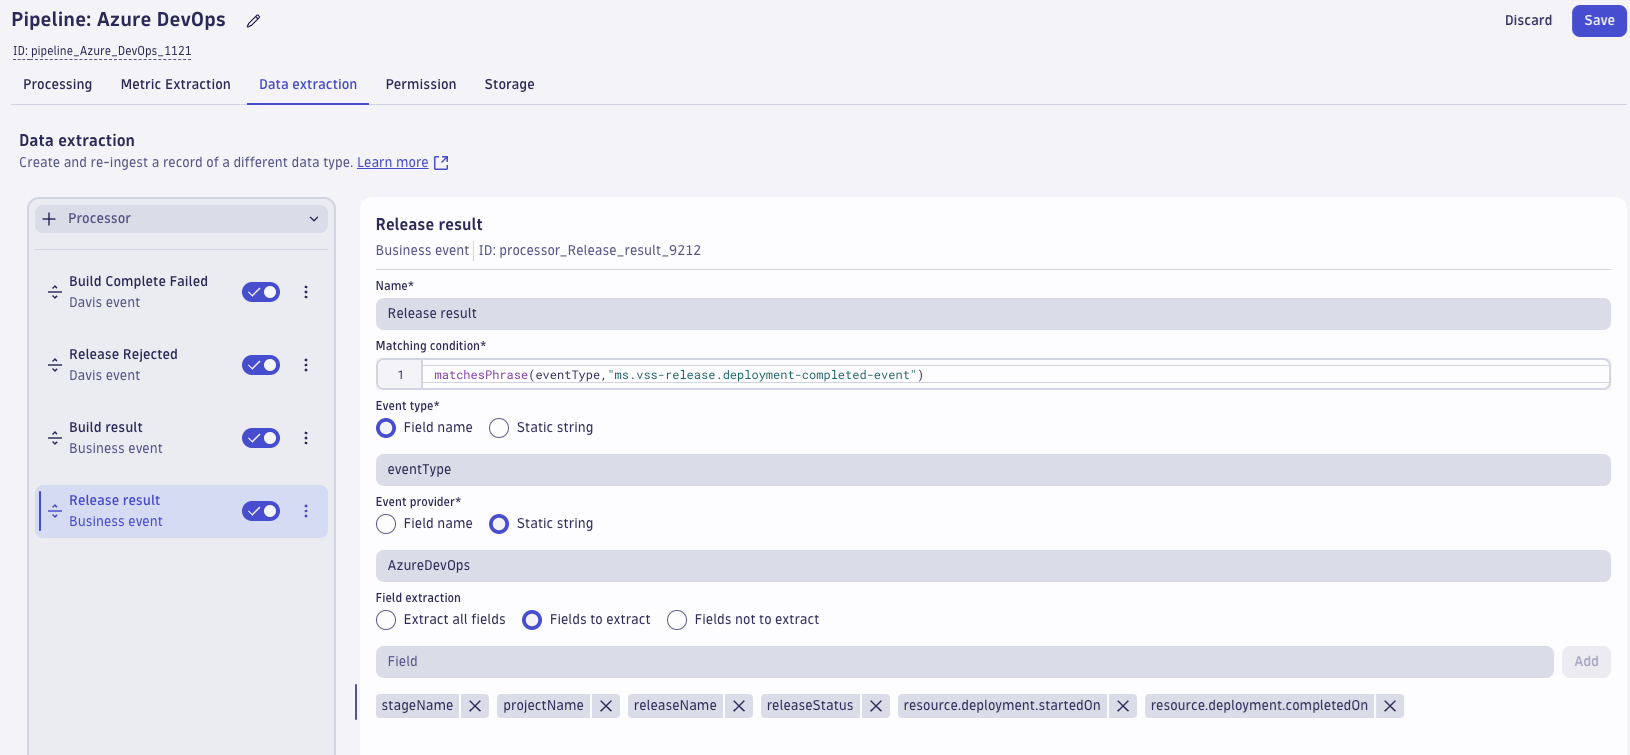
- Finally, we use another Business Event Processor rule, to extract release events:
- Name: Release Result
- Matching condition:
matchesPhrase(eventType,"ms.vss-release.deployment-completed-event") - Event type: field name
eventType - Event provider: Change to Static String:
AzureDevOps - Fields to extract:
stageName,projectName,releaseName,releaseStatus,resource.deplyoment.startedOn,resource.deployment.completedOn
Extract Davis® AI events (optional)
Besides transforming the log line into SDLC events, you can also extract Davis events in case something goes wrong. These events can be used to create an alert or trigger a (remediation) workflow.
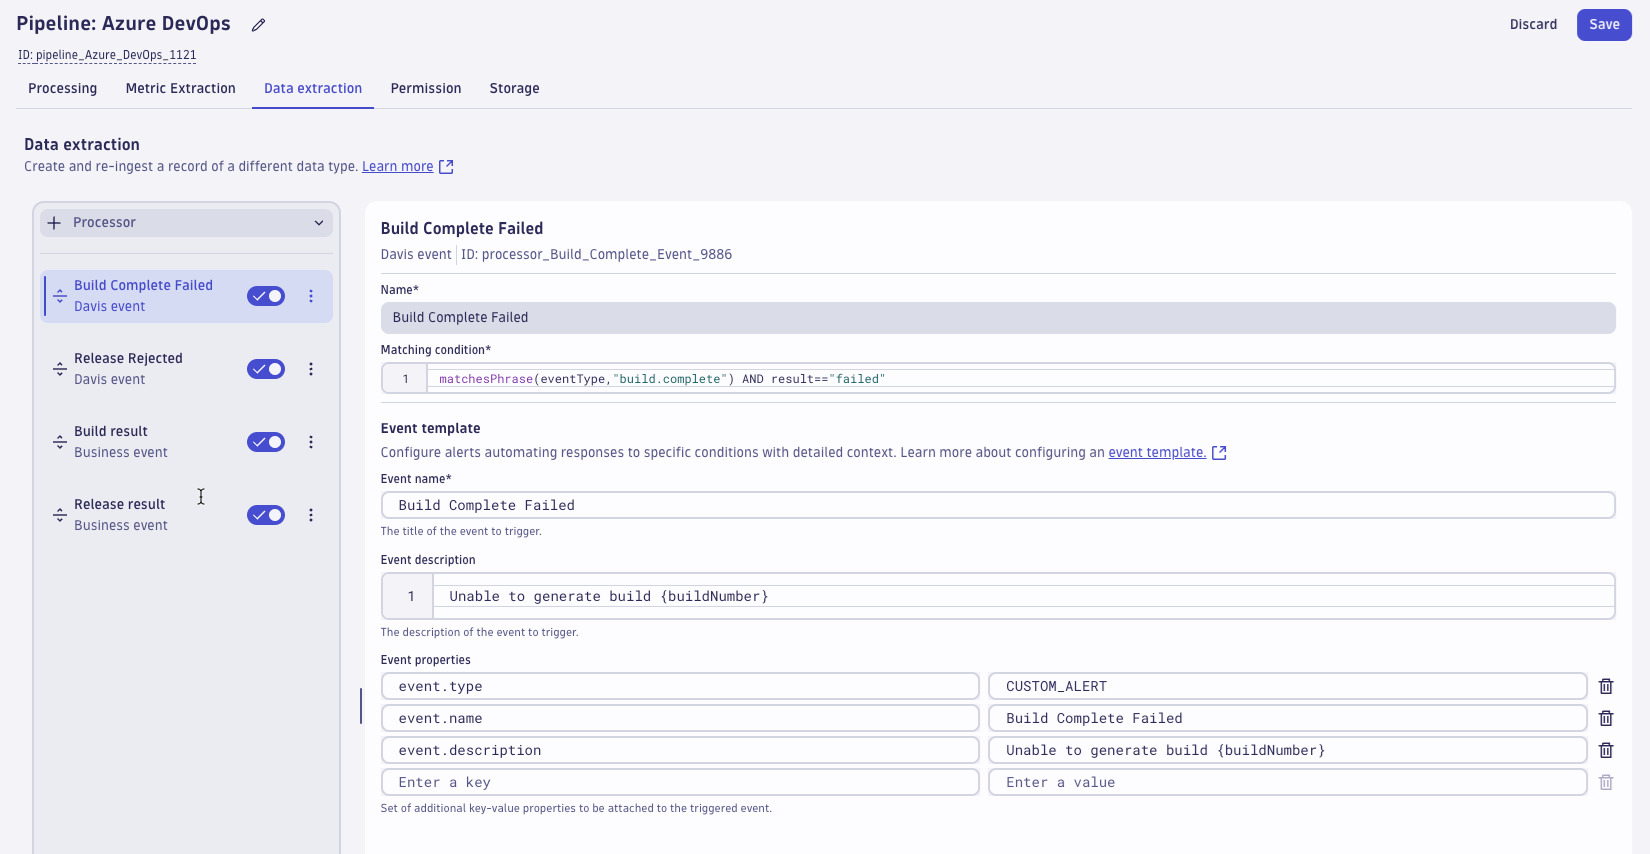
- First, add an event if a build has failed. Add a new “Davis event” processor using the following data:
- Name: Build Complete Failed
- Matching condition:
matchesPhrase(eventType,"build.complete”) AND result== “build” - Event description:
Unable to generate build {buildNumber}
Note: You can change the event.type in case you want to increase the severity level.
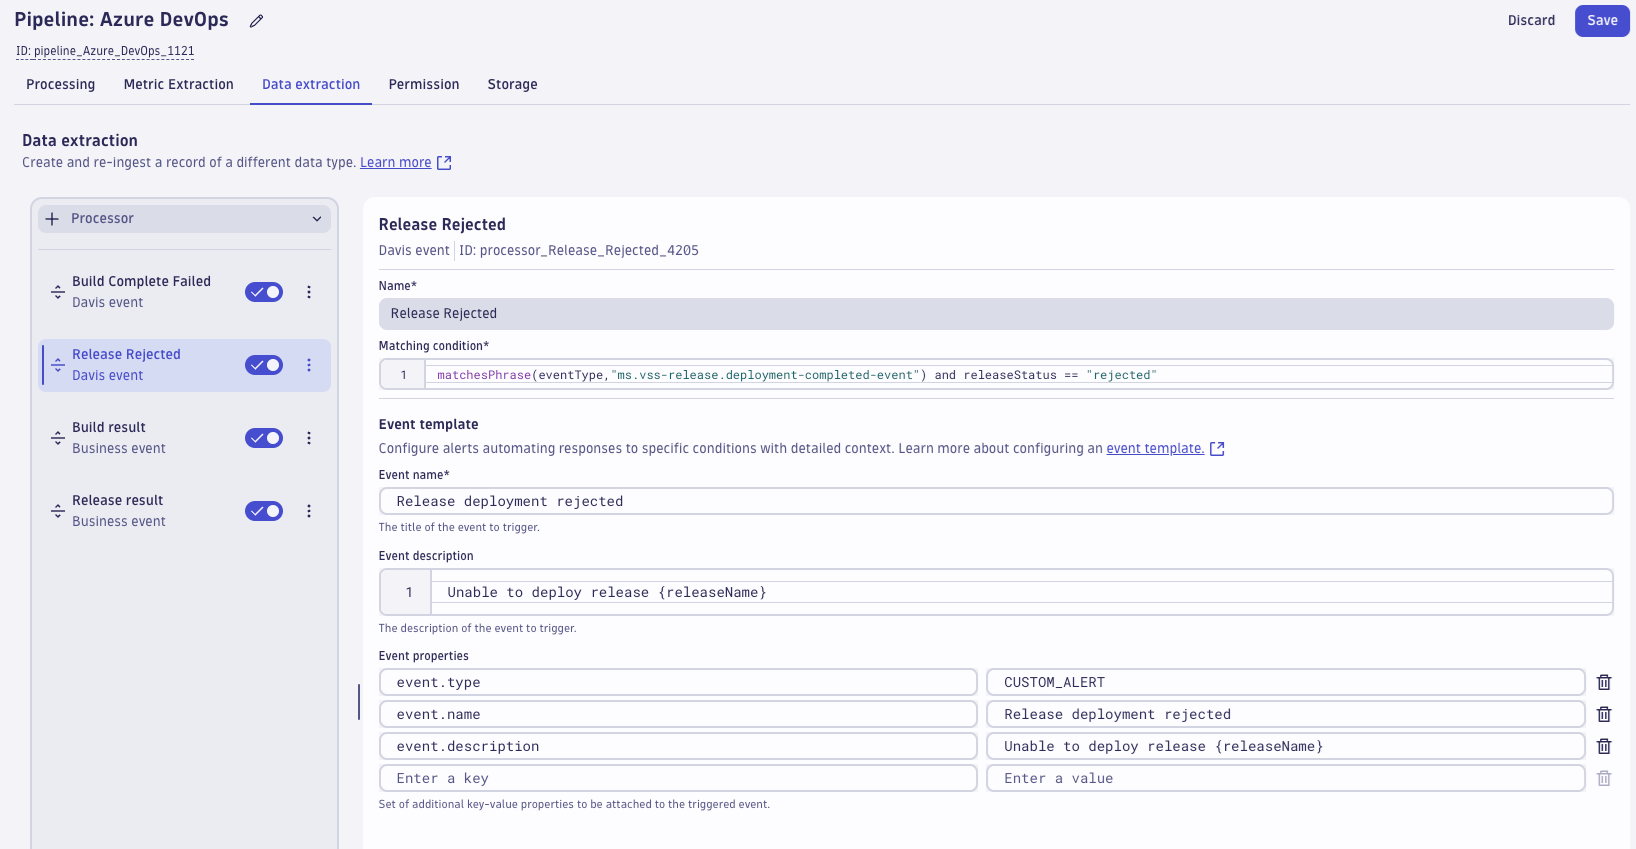
- Next, extract a Davis event if the deployment is rejected:
- Name: Release deployment rejected
- Matching condition:
matchesPhrase(eventType,"ms.vss-release.deployment-completed-event”) AND releaseStatus== “rejected” - Event description:
Unable to deploy release {releaseName}
Discard logs (optional)
Now that we have successfully converted the log event into a SDLC (Business) and a Davis event, you can disable the storage assignment rule. This will reduce the amount of data stored in Grail and help you saving some money (and consequently speeding up your log queries). Go to OpenPipeline > Logs > Pipelines > AzureDevOps.
- Open the OpenPipeline app and select the pipeline we created before.
- Select the tab Storage and change the matching condition to
false.
Analyzing data
After deleting the logs events we need to adapt our dashboard to consume business instead of log data. To speed up things you can upload a ready-to-use dashboard into your environment:
- Go to the AzureDevOps Git Repository and download the AzureDevOps Dashboard (on BizEvents).json file.
- Within Dynatrace, open the Dashboards, select Upload at the top left corner, and select the JSON file.
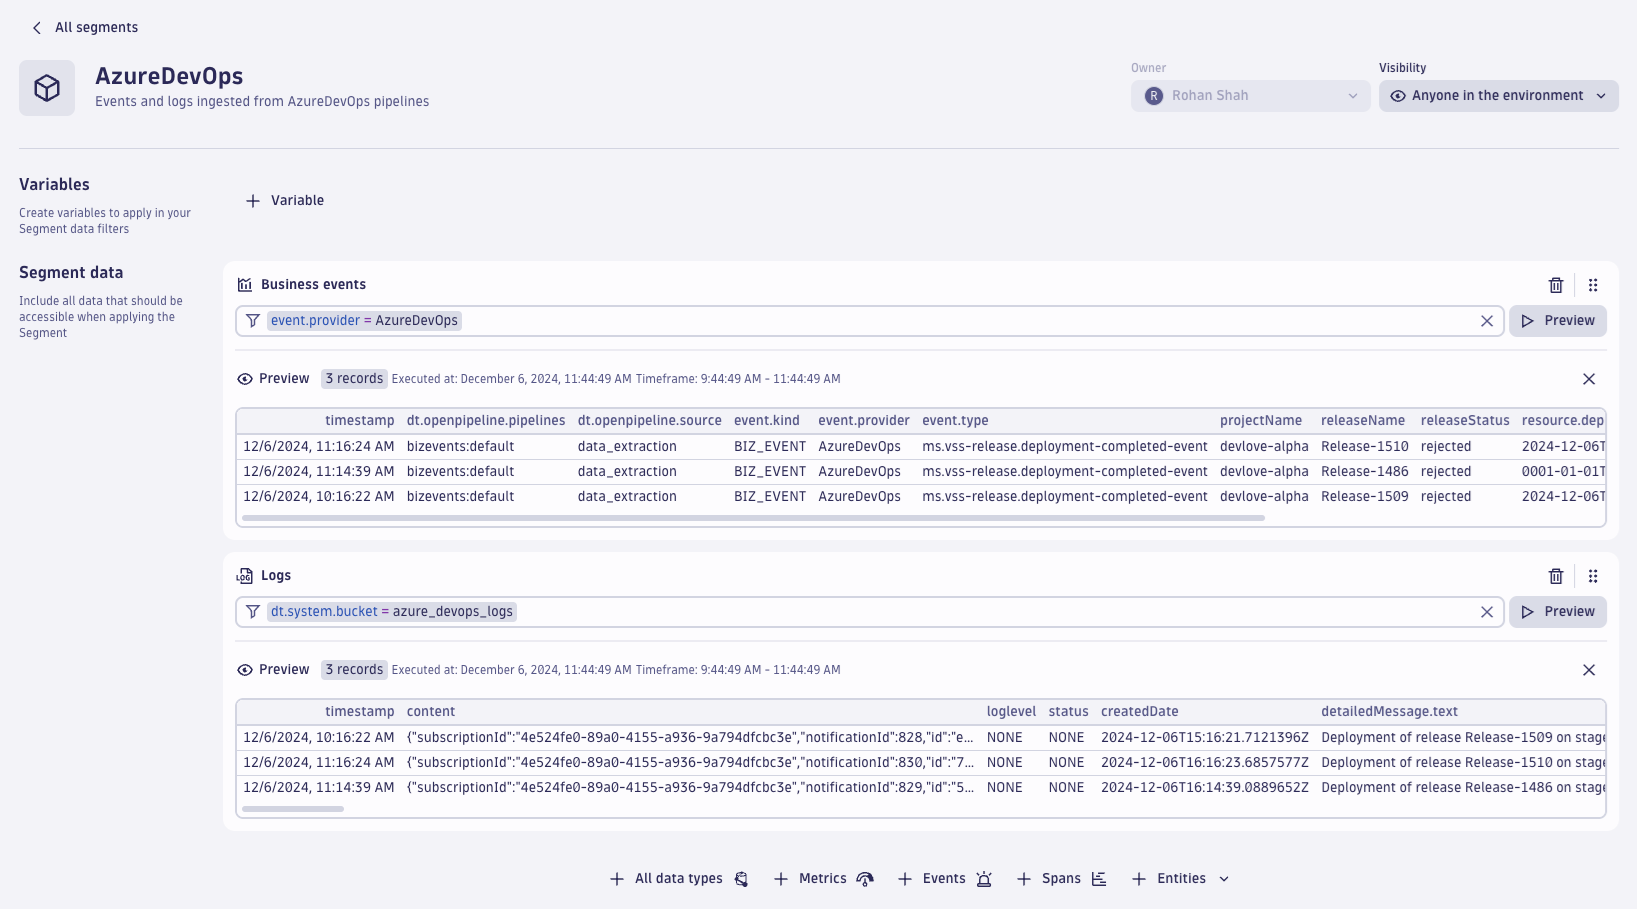
Additionally, we recommend that you create a segment to filter all of your monitored entities across different apps.
- Go to the Segments app and create a new segment by selecting + in the top right corner.
- Rename the segment
to AzureDevOps. - Select + Business events and add the following filter:
event.provider = AzureDevOps - Select + Logs and add the following filter:
dt.system.bucket = azure_devops_logs - Select Preview to validate the filters and Save once you’re done.
What’s next
By following these steps, you’ll be able to seamlessly integrate Azure DevOps with Dynatrace, enabling efficient log management and insightful data visualization.
Happy monitoring! 🚀


Looking for answers?
Start a new discussion or ask for help in our Q&A forum.
Go to forum