
Agentic AI is dramatically altering how engineering teams respond to incidents and debug use cases. Monitoring agent communications using model communications protocol (MCP) and live debugging are key to gaining insight into how AI models are performing. In this second installment of our series, The Rise of Agentic AI, we explore some MCP best practices that Dynatrace customer TELUS uses to massively accelerate agentic AI issue resolution.
Agentic AI is revolutionizing—and dramatically accelerating—how engineering teams respond to incidents and debug use cases. By monitoring how AI agents communicate using standards such as Model Context Protocol (MCP), performance engineers can gain deep insights into how systems and AI models themselves are performing. And crucially, automate incident responses using coding assistants.
The next step in this scenario is to employ some MCP best practices, such as helping full-stack engineers to debug code at runtime without disrupting operations. Fortunately, Dynatrace has the answer with Live Debugger. First debuted earlier in 2025, Live Debugger gives developers instant access to code-level troubleshooting data in any environment, including production, and is now generally available.
With all these capabilities coalesced in an integrated development environment (IDE), developers can interact with AI using natural language to massively accelerate issue resolution.
Key takeaways:
- Unify AI debugging resources in one place. Debugging agentic AI workflows starts with combining Dynatrace features with custom MCPs in an IDE.
- Leverage an AI coding assistant to add context. An AI coding assistant, such as Cline, helps add vital context and improve prompt engineering using natural language queries.
- Use best practices to configure MCPs and Cline. Combining Cline with MCPs and on-the-fly debugging reduces guesswork and manual overhead.
MCP best practices TELUS uses to accelerate incident response
As an early adopter of Dynatrace Live Debugger, TELUS harnessed the power of Davis® AI, MCP, and real-time debug data to gain a deep understanding of their code, enabling every engineer to ask questions in natural language about their code behavior at runtime.
At a recent Dynatrace Guild meeting, TELUS SREs Dana Harrison and Cheng Li demonstrated how they’re combining Dynatrace features like Live Debugger with custom MCPs for the ultimate purpose-built troubleshooting setup in their Visual Studio Code IDE. By integrating multiple resources in one place, the TELUS team can blend next-generation debugging with agentic AI workflows. This integration reduces developer context-switching and enables developers to use straightforward, natural-language prompts.
With a fully instrumented environment that monitors every service end-to-end, the TELUS team leverages Dynatrace Live Debugger for Node.js and Java microservices to monitor running code in real time to reduce mean time to resolution. They initially tested this approach in non-production but are expanding into production with strict auditing and data masking.
The team also uses MCP in tandem with Cline AI, a coding assistant capable of gathering logs, metrics, and trace data through natural language commands. By unifying multiple data sources under MCP, TELUS avoids manually juggling different dashboards and tools. Developers can simply interact with the AI tools, which fetch relevant context on demand, even correlating Live Debugger snapshots with real-time logs. As a result, the entire debugging and incident investigation process remains inside the IDE, which significantly streamlines performance engineering and accelerates issue resolution.
How MCPs empower AI agents for debugging use cases
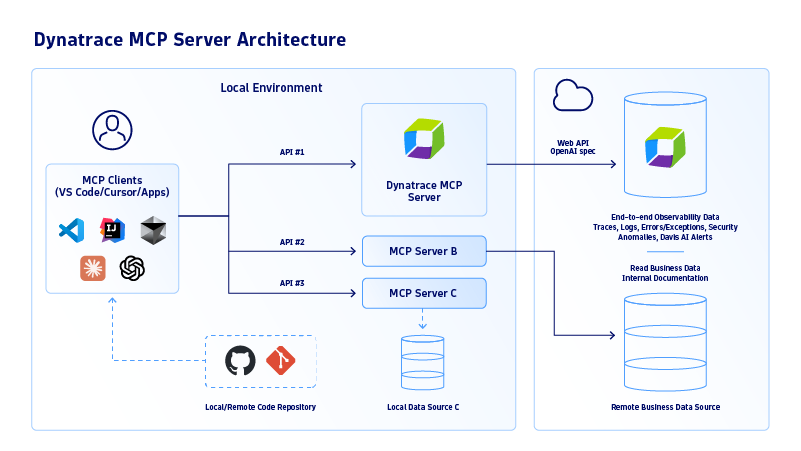
As an open standard, MCP connects AI agents to relevant data sources, such as repositories, tools, or external APIs. Instead of bespoke integrations for each data silo, MCP provides a universal interface to connect multiple relevant sources to feed the right context to the models and agents. This interface simplifies how agents access relevant context, leading to better task outcomes, execution, and more consistent performance across complex environments. For reference, you can try out the Dynatrace MCP server on GitHub.
MCP best practices: How Cline AI helps to bring in context
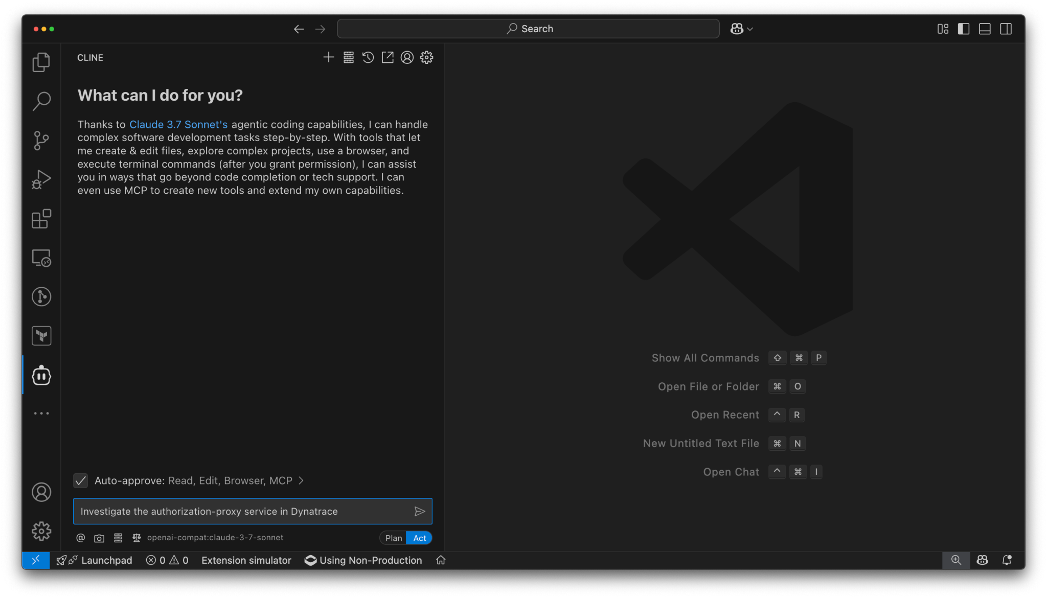
Cline AI is a coding assistant in Visual Studio Code that leverages multiple MCP servers to streamline data retrieval from various back-end systems. With plain-language queries (“Search for a specific service,” “Fetch logs from GKE,” or “Investigate errors”), developers can prompt Cline AI to automatically contact the relevant MCP server.
By becoming better at prompt engineering and handling the underlying API calls and correlating responses from Dynatrace MCP, native Kubernetes logs, or even third-party services, Cline AI provides an all-in-one investigation workflow right in the editor. This means developers don’t have to switch among multiple tools or memorize specialized APIs; they simply ask Cline AI what they need in natural language, and the MCP layer manages the rest.
Cline supports MCP-client features, such as dynamic tool discovery, prompt reusability, and adaptive resource access. It also enables powerful features like custom instruction, cline-rule, and memory banks.
TELUS’ best practices for configuring MCPs and Cline
The TELUS team followed these MCP best practices while configuring Cline.
Install Cline AI as VS Code extension
First, the TELUS team installed Cline AI as a VS Code extension, pointing it to their AI proxy, Fuel iX. Fuel iX lets them choose among various large language models based on the user’s requirements and desires.
Use careful prompt engineering and Cline rules to direct specific MCP tools
Cline AI can then interpret a developer’s natural-language prompt—such as “Investigate errors in our Node.js service”, “What is this service about”—and select the appropriate MCP endpoint(s) to gather data. Directing to specific MCP tools for more accurate results can be fine-tuned through careful prompt engineering, creating detailed .clinerules file definitions, and directives built into the MCPs themselves – including predicted requests and response formatting.
Configure each MCP server for a specific data domain
Each MCP server at TELUS is responsible for interacting with a specific data domain: for instance, they have a Dynatrace MCP server to fetch metrics and trace data, a GCP Logs MCP server to pull container and other forwarded logs, and additional servers for services like JIRA issues or PagerDuty.
Rely on centralized agentic AI commands, not vendor-specific APIs
By standardizing how these data sources are exposed, TELUS ensures that Cline AI never has to manage direct integrations or vendor-specific APIs. Instead, the assistant simply issues commands to the MCP servers, which internally handle authentication, query templates, and data normalization. This architecture not only allows TELUS to maintain clear boundaries between data retrieval logic and AI-driven workflows, but also accelerates developer onboarding, making it simple for any team member to debug or investigate issues from within VS Code by asking Cline AI, rather than switching between specialized tools or dashboards.
Use MCPs as a standardized endpoint
In this context, MCP servers act as standardized endpoints, each responsible for a particular data source or application. By relying on Cline for coding assistance, the TELUS team can type a natural-language command (“Investigate issues in our Node.js service”), and Cline will automatically query Dynatrace Grail or GKE logs using the relevant MCP server.
This approach centralizes the complexities of data retrieval in one place and lets the AI assistant produce a consolidated summary or recommended fix, all within the IDE.
Step-by-step guide to set up Cline with Dynatrace
- Install Cline through the VS Code Marketplace.

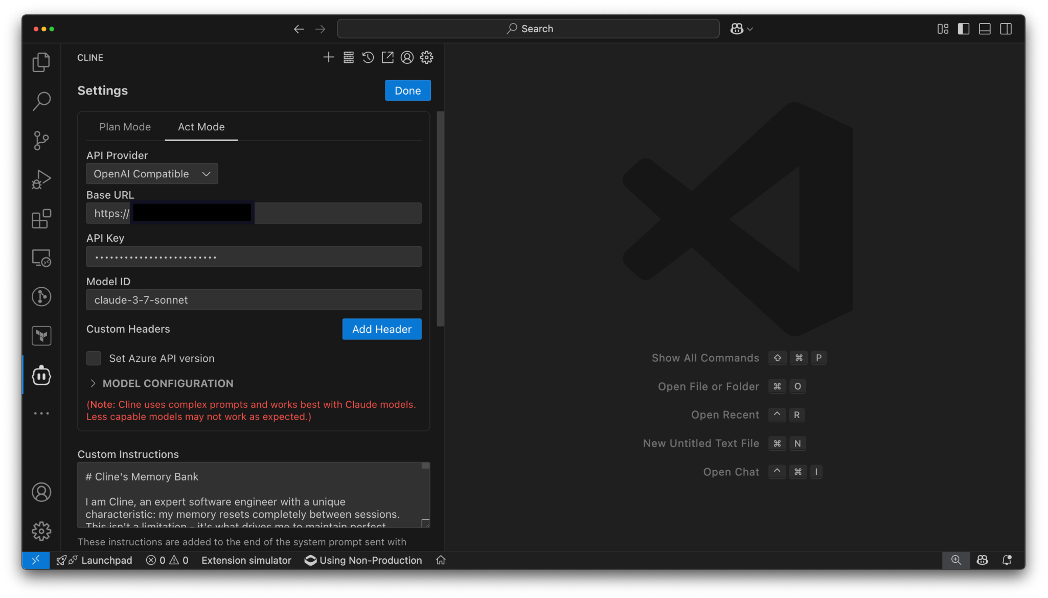
- Configure Cline with the required credentials, usually an API endpoint and key.
- Install your MCP. This example uses an internal package, but there are currently many MCPs published for installation.
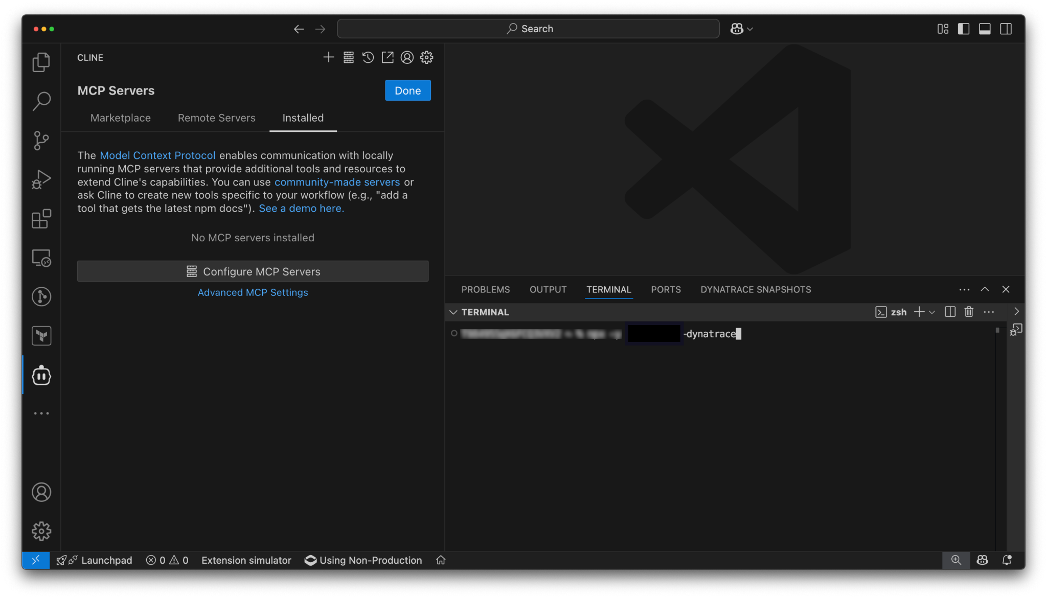
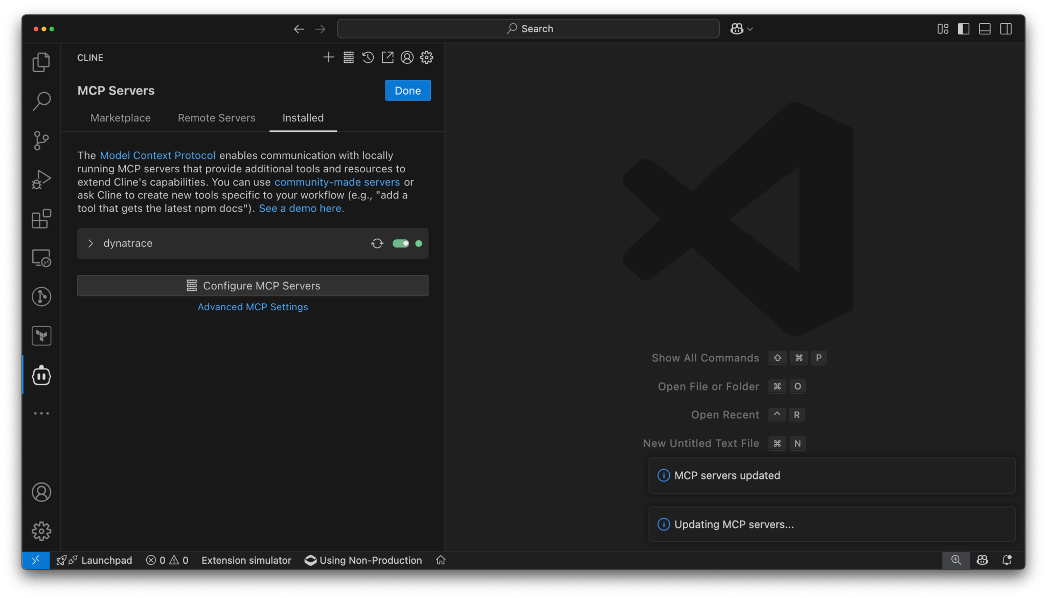
- Validate that the Dynatrace MCP server is up and running.
- Ask Cline your questions. The agent formats them according to the needs of the MCP(s) you installed.
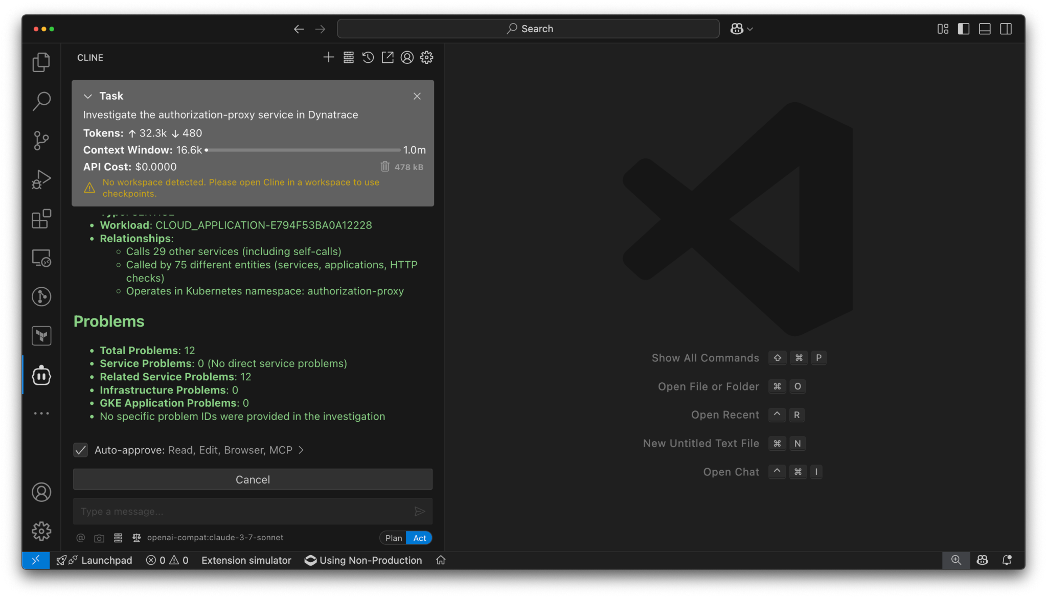
- Example response of a production authorization service problem pulled and summarized from Dynatrace.
The objective of this combined setup (Live Debugger + MCP + Cline) is fast and intelligent troubleshooting. Instead of juggling multiple dashboards and CLI tools, an engineer can see code snapshots, error traces, logs, and even recently created JIRA tickets within one session. As mentioned, MCP standardizes queries across diverse systems, so the AI agents can correlate all relevant information, such as referencing a single trace ID to pull logs from GKE, configuration details from the Kubernetes cluster, or known issues in PagerDuty. This AI agent-powered workflow saves time and reduces context switching.
The TELUS team found that combining these insights with on-the-fly debugging significantly reduces the guesswork and manual overhead that typically slows resolution times.
The road ahead: Developer-first observability and IDE-centric debugging at TELUS with Dynatrace
Although TELUS currently uses Live Debugger in mostly non-production environments, they plan to enable it in production using strict governance. Their upcoming strategy involves role-based permissions for debugging sessions, mandatory security training on data privacy, and well-defined data retention policies to keep snapshots transient.
When combined with MCP’s universal integration points, like Dynatrace MCP, developers can quickly drill down into real production issues, see the exact variables at fault, and either push a fix or revert a misconfiguration with minimal downtime.
Looking ahead, the TELUS team plans to integrate Davis Copilot APIs to further simplify natural language interactions with Dynatrace.
In practice, this would allow an AI assistant to automatically translate human-readable queries into Dynatrace Query Language (DQL), making it even easier to retrieve the right metrics, traces, or logs. By layering Davis CoPilot™ on top of their existing MCP approach, TELUS aims to reduce manual DQL writing while offering developers a powerful yet streamlined way to perform more advanced data analysis through simple, intuitive prompts.
Read more
- Part one of the Rise of Agentic AI blog series covers the fundamentals of AI agents, models, and emerging communication standards such as Agent2Agent (A2A) and MCP.
- Part three explains how to monitor Amazon Bedrock Agents and how observability optimizes AI agents at scale.
- Part four covers full-stack observability for AI with NVIDIA Blackwell and NVIDIA NIM.
- Part five demonstrates how to build a simple agentic application using the OpenAI Agents SDK and instrument the data with Dynatrace.
- Part six explores AI Model Versioning and A/B testing for smarter LLM services.
- Part seven introduces data governance and audit trails for AI services.
More MCP best practices and resources for Dynatrace Live Debugger
- Dynatrace MCP on GitHub
- Dynatrace Live Debugger on Dynatrace Hub
- Dynatrace for Developers Visual Studio plugin on Microsoft Marketplace
- Dynatrace for Developers product page
- Dynatrace Automation Guild on the Dynatrace Community
- 5 powerful use cases beyond debugging for Dynatrace Live Debugger
- Debug complex performance issues in production with ease with Live Debugger, Open Pipeline, and OpenTelemetry

Looking for answers?
Start a new discussion or ask for help in our Q&A forum.
Go to forum