
As an application owner, it’s your job to pay close attention to how your users interact with your application. It’s the user experience delivered by your application that will differentiate it (or not) from the countless other similar applications that your users can choose from. The user experience of your application will determine its success or failure. Therefore, user experience should always be one of the core areas that you strive to measure and improve.
There is, however, no easy way of measuring user experience. Defining a comprehensive user-experience metric gives rise to questions such as:
- How do we compare the user experience of one session to another?
- Which metric can be used for the purpose of reporting user experience and tracking it over a period of time?
- How should we segment users and focus on those users who’ve had a frustrating experience with your application?
- Which metric can be used to drill deeper and analyze the reasons that cause frustrated users to leave your application?
While it’s true that the analytics capabilities provided by Dynatrace, especially when bundled with Session Replay, can be used for performance improvement and error detection, there’s still the need to have a single source of truth, a metric that consolidates all the information and measures overall user experience.
With these points in mind, Dynatrace proudly introduces the new UX score, the singularly most significant metric for measuring, reporting, and comparing user experiences.
A single metric for user experience segmentation
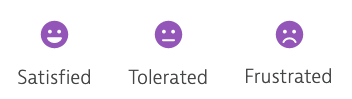
UX score is a single metric that categorizes each session recorded with Real User Monitoring as either Satisfying, Frustrating, or Tolerable.
To determine the UX score for each user session, many other related metrics and data are taken into consideration, including:
- Performance metrics
- Error metrics
- Usability metrics
- User flow information
Issues such as slow performance and errors that occur at the end of a session often cause users to abandon sessions. Such issues, therefore, have a great impact on the overall UX score of a session. Similarly, certain website operations may be of greater importance to the current workflow that a user is involved in. Such operations, therefore, have a higher weight in UX score calculations.
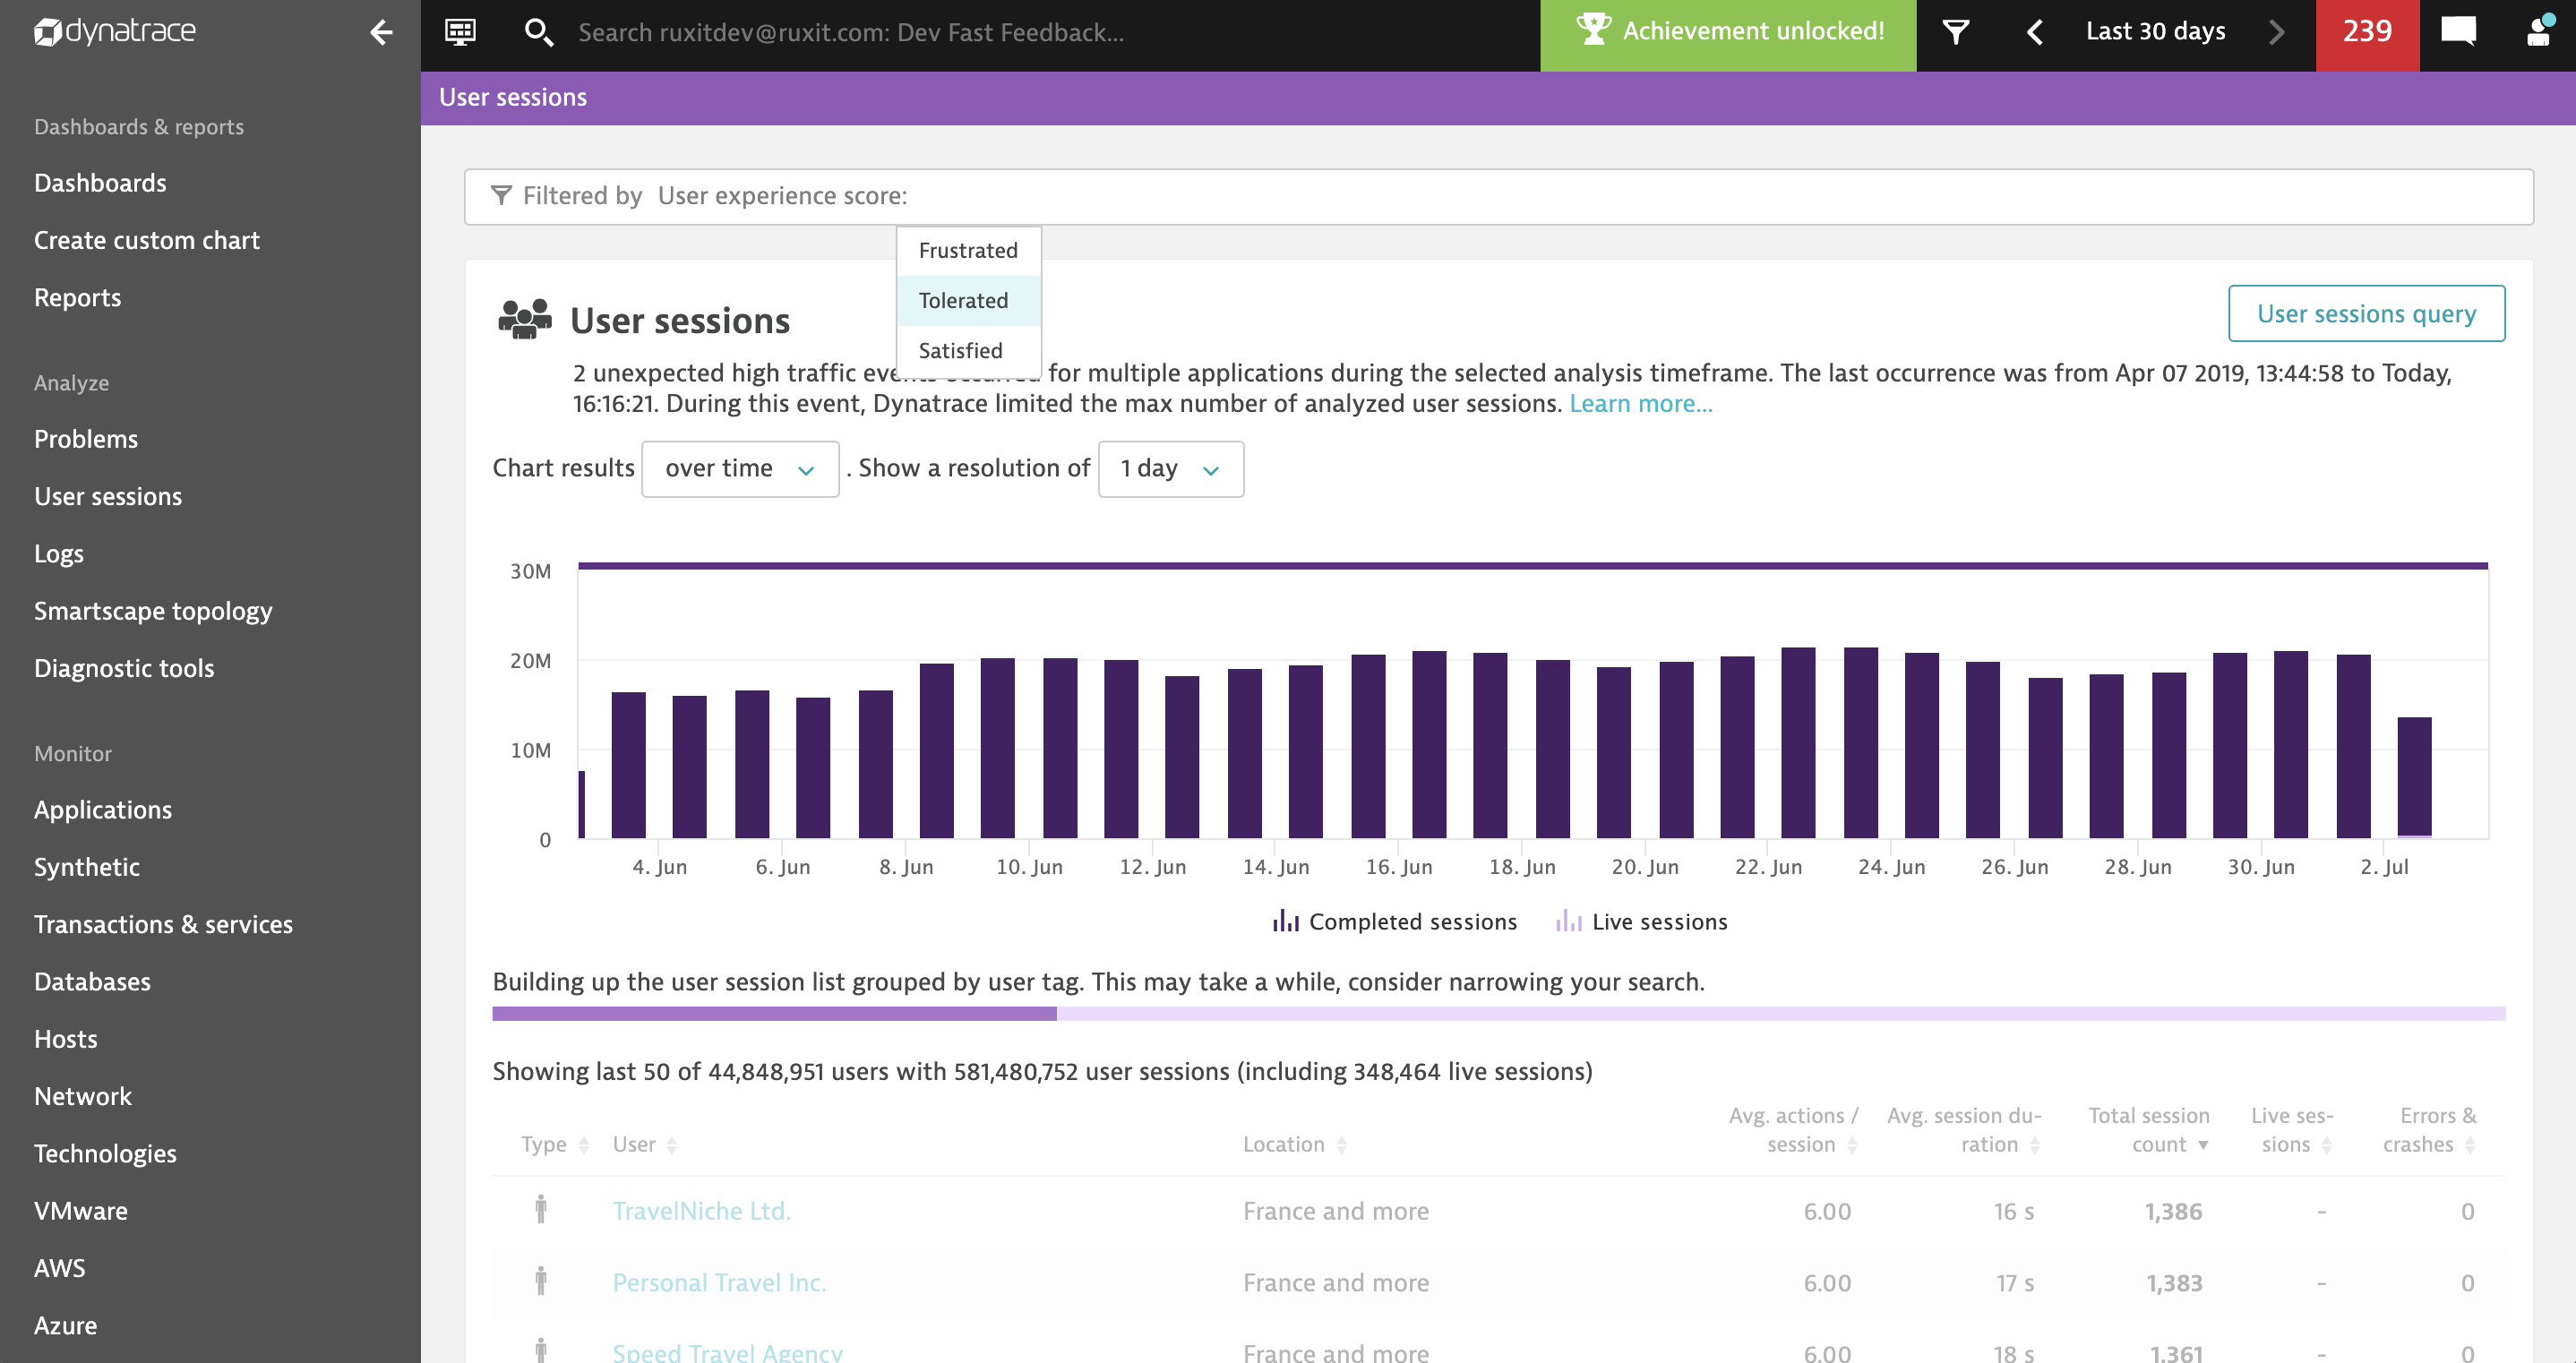
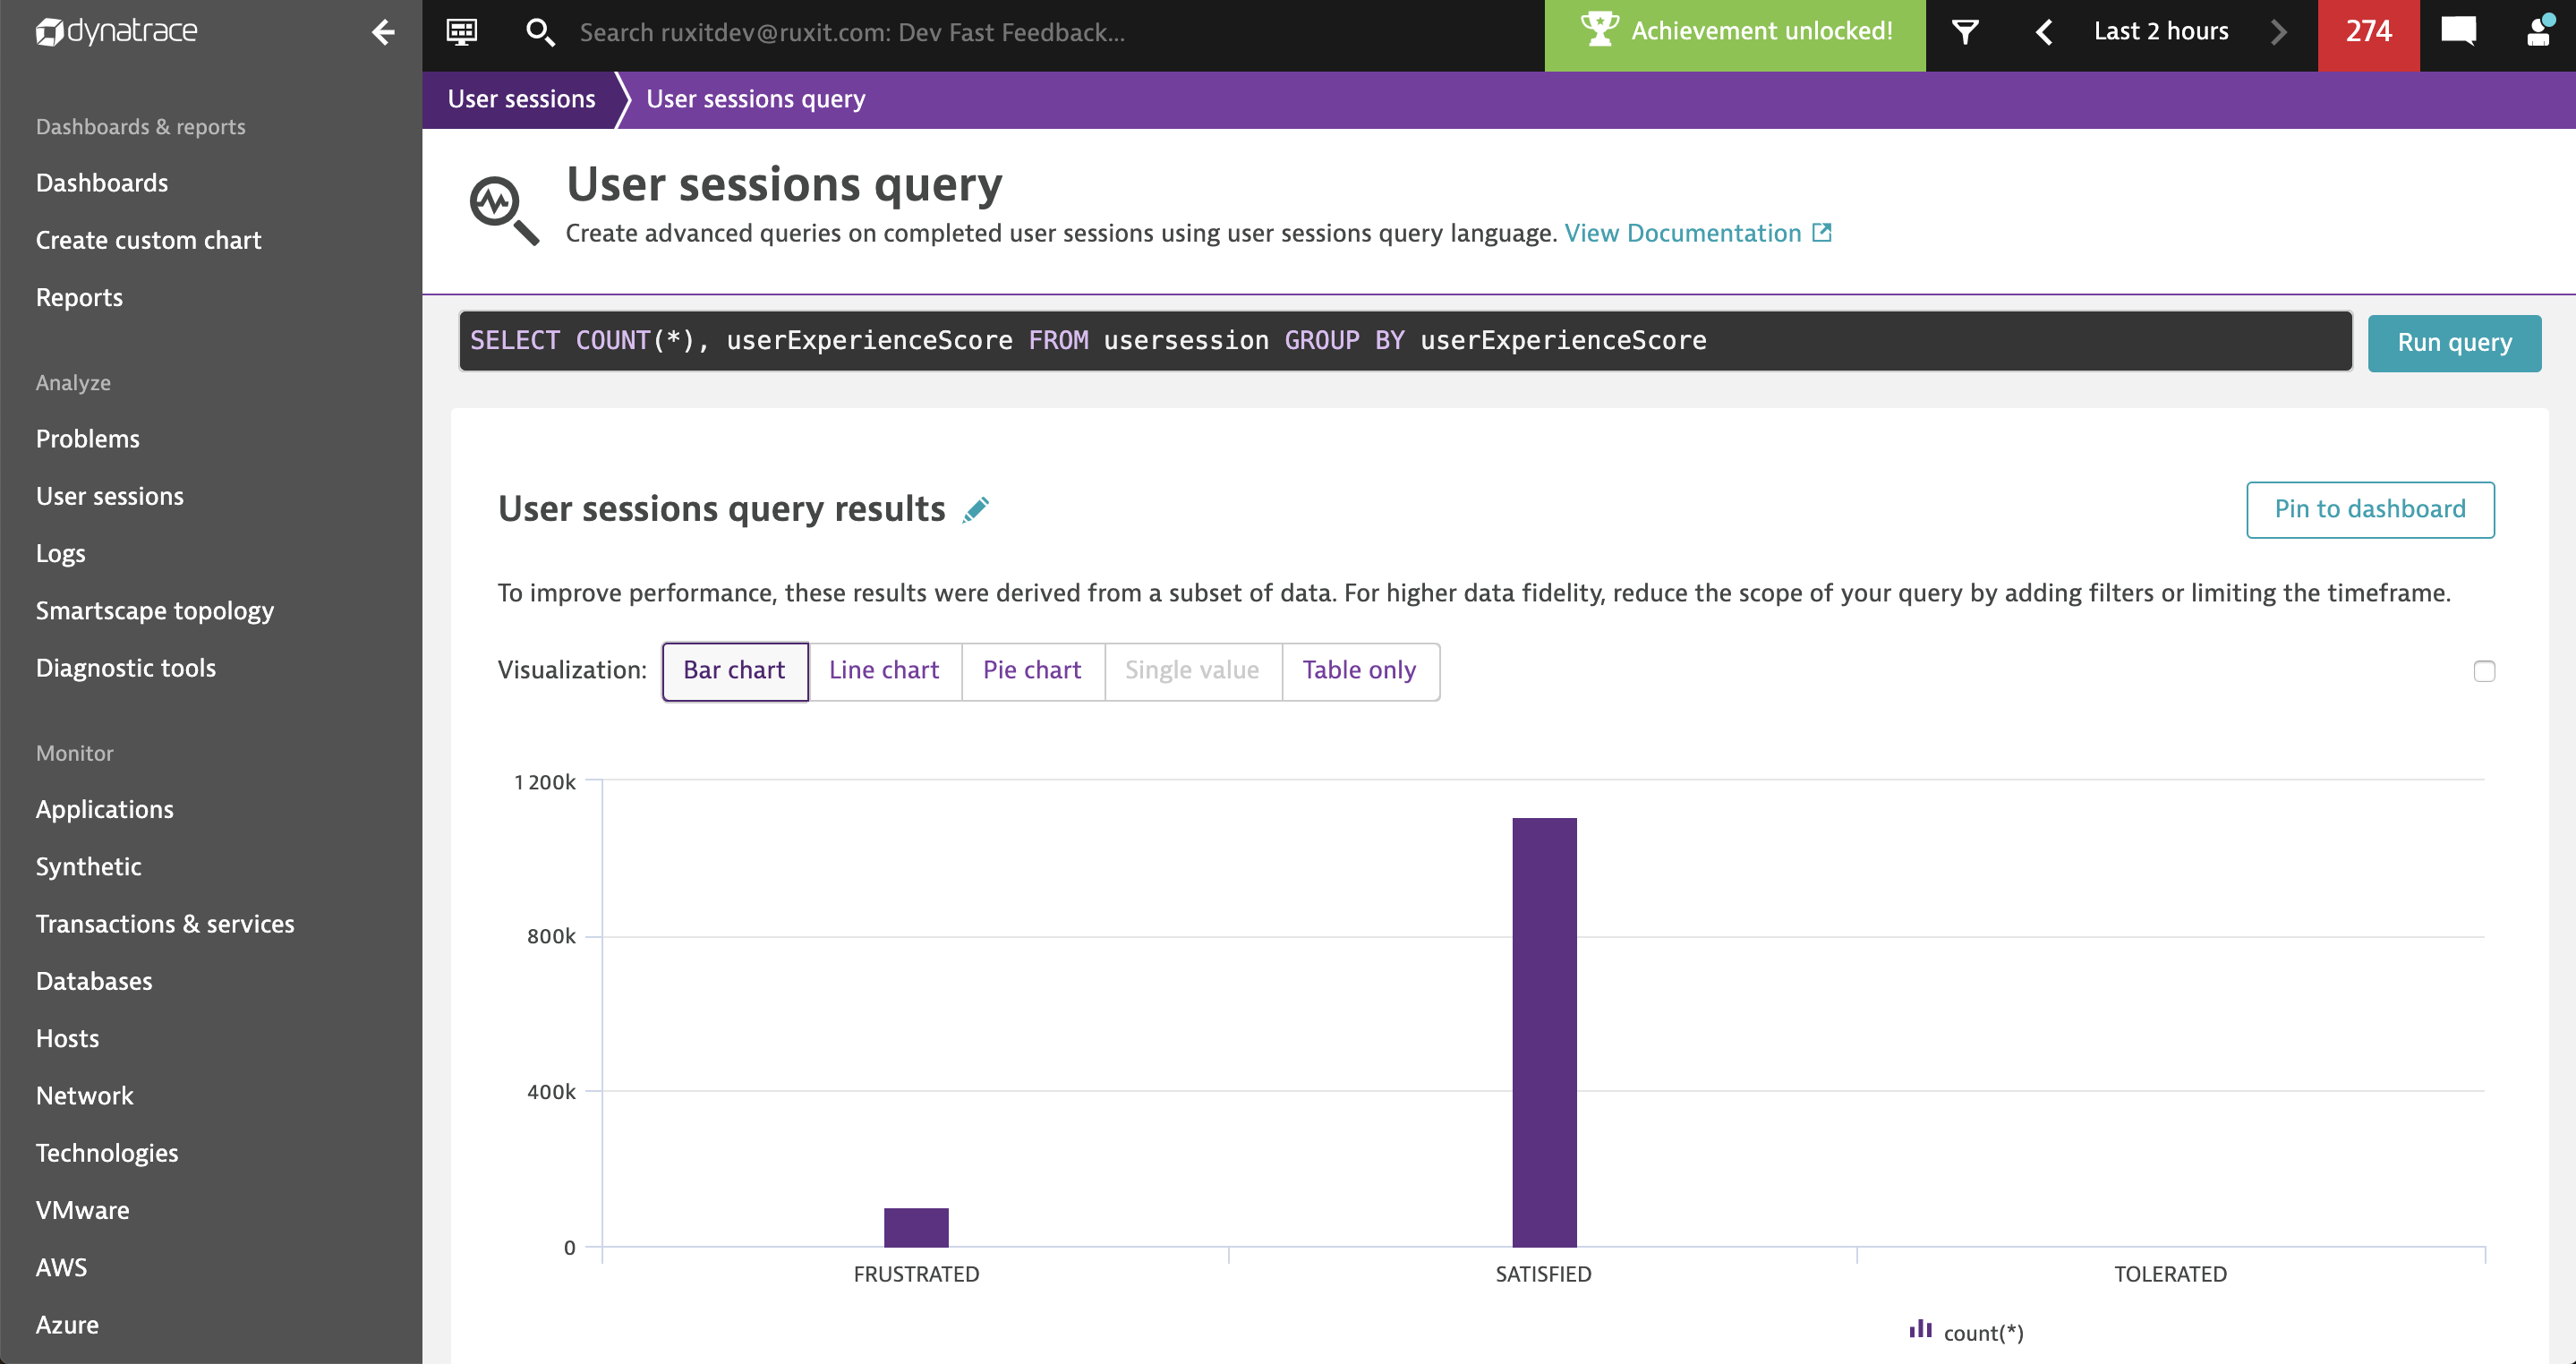
Each session processed by Dynatrace has a UX score assigned to it to allow for quick filtering. Just select User Sessions from the navigation menu and start typing User experience score to add a filter. This filter can be combined with any other filter, thereby allowing you to segment users further by looking for specific locations, mobile devices, screen resolutions, or success in reaching your conversion goals.
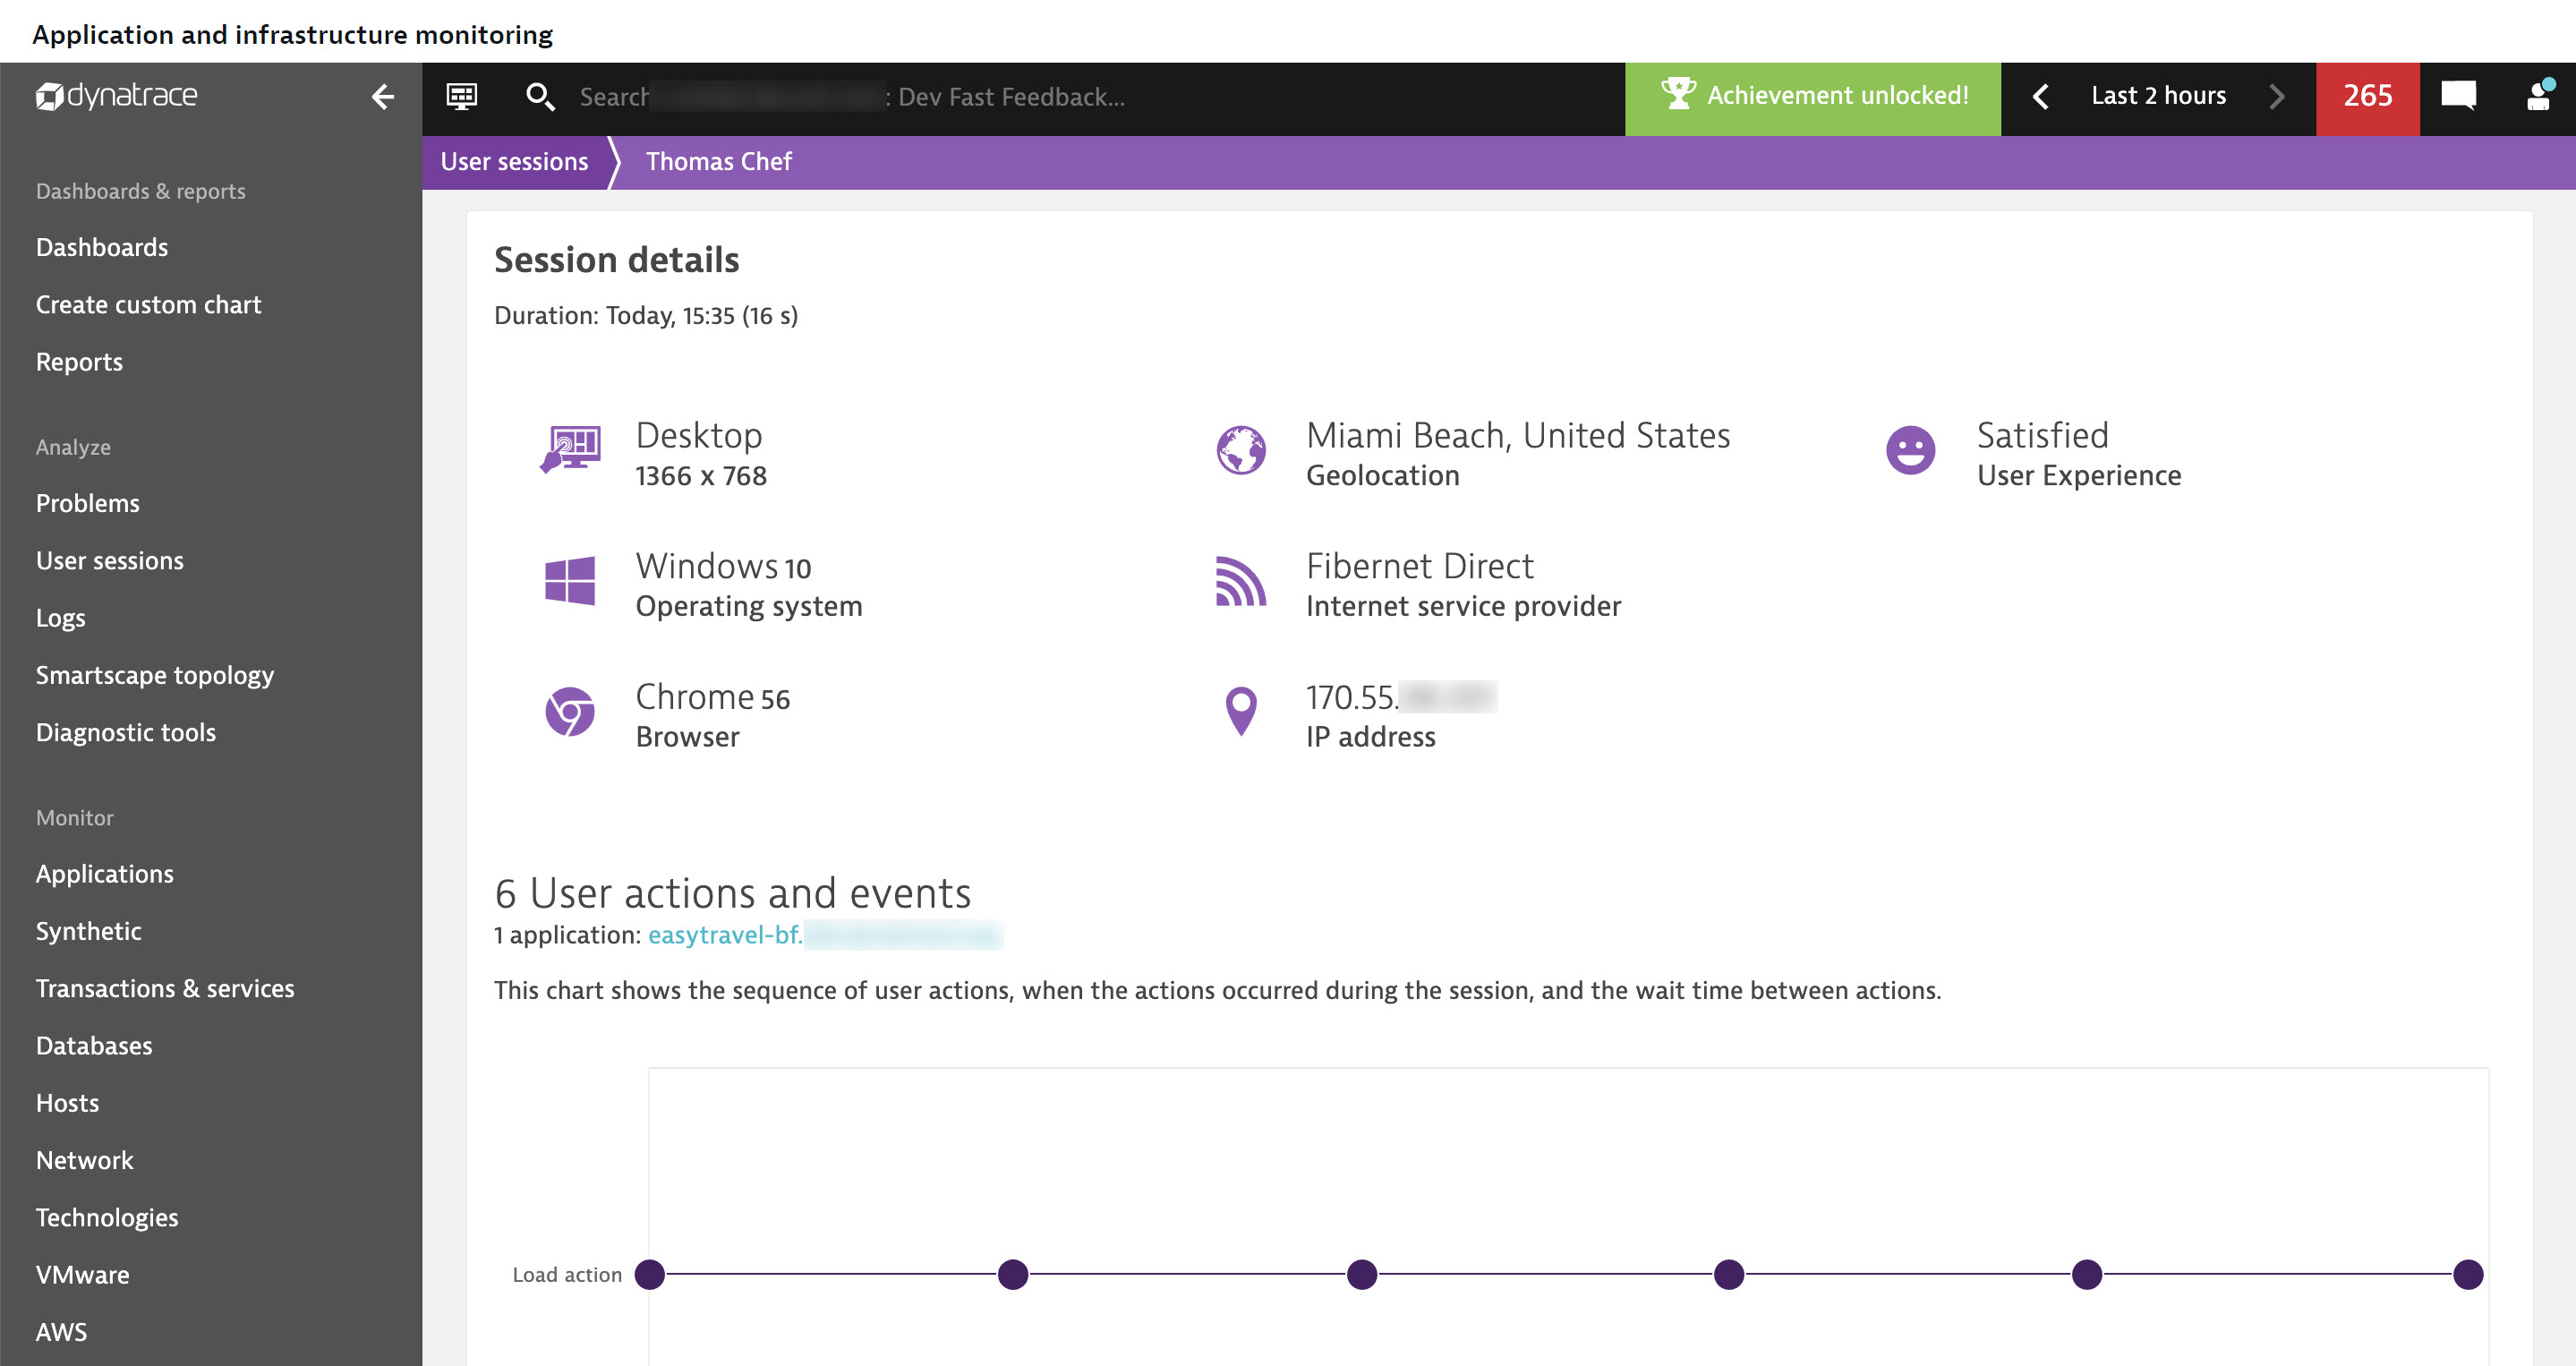
Unlike other Digital Experience Monitoring solutions, Dynatrace provides cross-application insights within individual user sessions. This means that each session’s UX score factors in all the applications that a user may visit during a session.
Out-of-the-box results, with custom flexibility to suit your business
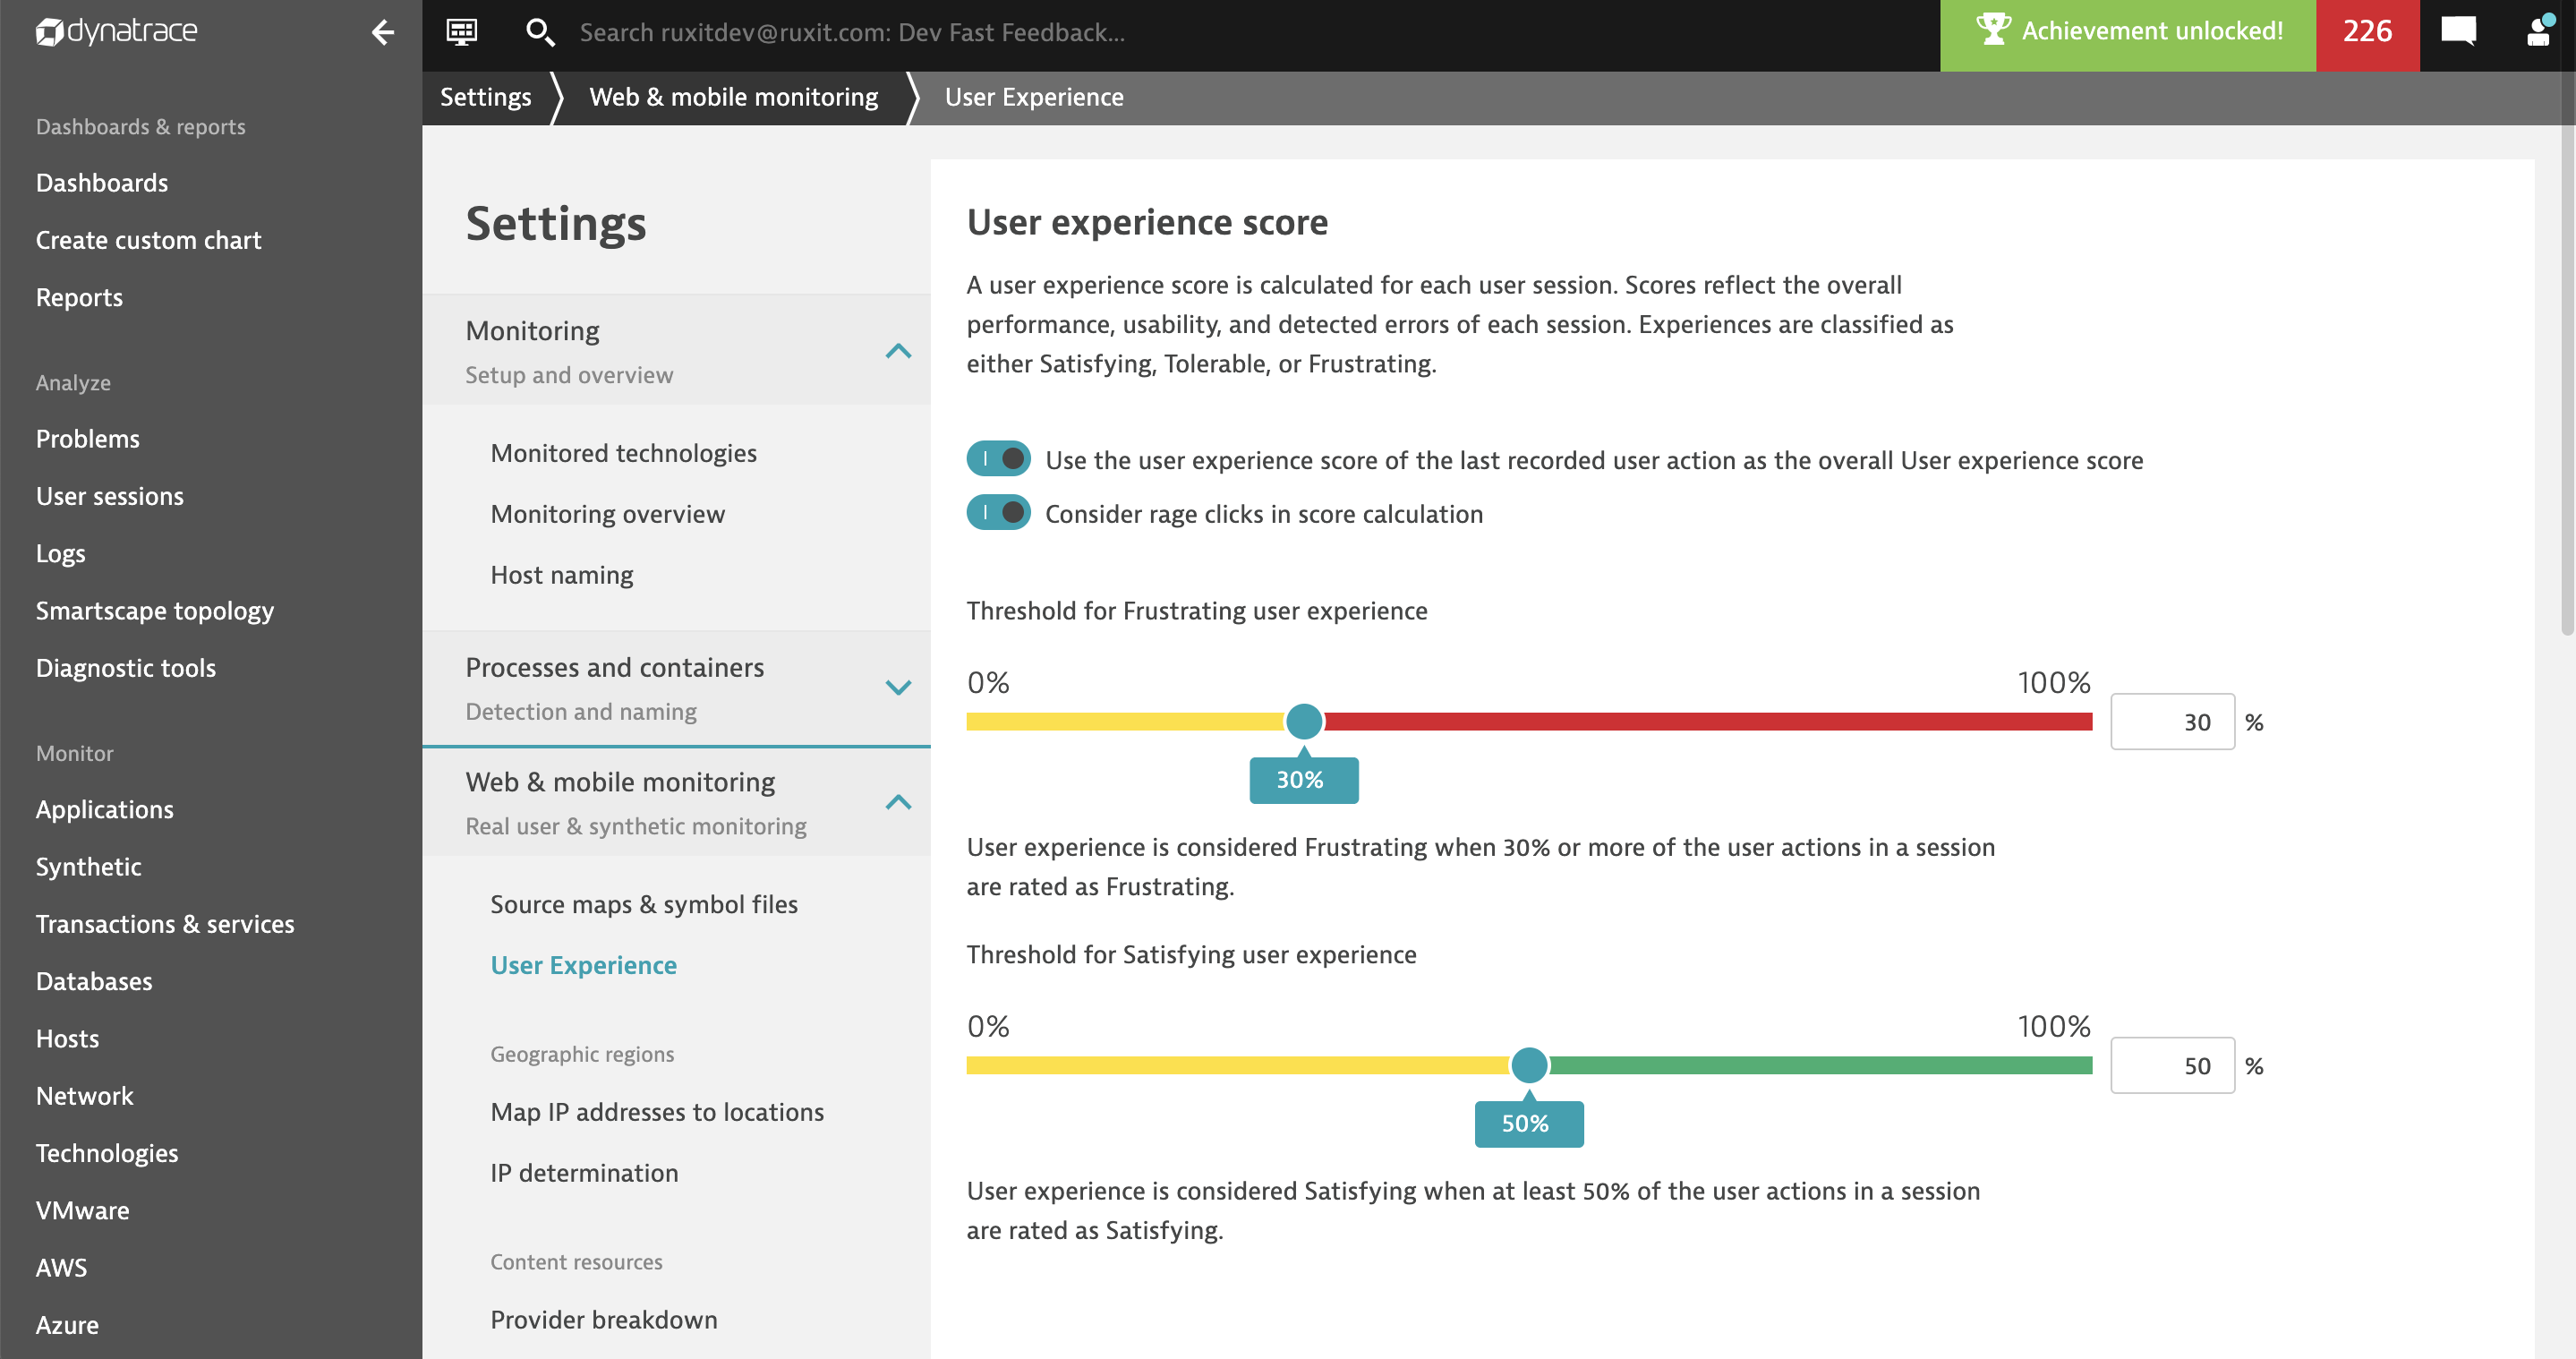
We understand that your business requirements are unique. While the UX score carries its own research-based values and behavior, you can also configure it further to better suit your needs.
For example, configurable thresholds can be used to fine-tune the UX score thresholds for user-perception.
Dynatrace also provides the ability to configure additional elements and input factors. For example, certain JavaScript errors or errors related to third-party resources can be excluded from UX score calculation.
Consider the following scenario: your application uses a third-party script for advertising purposes; this script doesn’t impact the experience or functionalities delivered to your users. Therefore, any alerts triggered by errors in this script would only add noise and flag user sessions as Frustrating even when they have no impact on user experience. By configuring the UX score to ignore such noise, you can further sharpen an already cutting-edge tool to identify relevant segments with more precision.
UX score provides immediate value
The UX score serves two main purposes:
- Reporting and comparing user experiences
- Improving applications so they can deliver better user experiences
Reporting and comparing user experience
It’s difficult to prioritize investments. It’s equally difficult to compare different applications on the basis of the experience they deliver. The UX score provides a single metric that combines performance analysis and error detection to overcome such problems.
Because of this, the UX score is recommended for the purpose of reporting and simplifying communication and bridging the gap between IT and businesses. Business processes often cover several applications. You can combine these metrics and use the average UX score to build a dashboard that gives you immediate and comparable metrics.
Improving applications so they deliver better user experiences
Searching for frustrated segments in a session and comparing frustrated and satisfied customer segments gives immediate insights into your application’s performance. By comparing these two segments, you can instantly find insights into reasons for differences in performance, error patterns, user behavior, or rage clicks, which indicate points of frustration.
Dynatrace has a host of information that, when combined with the UX score, can help you improve your digital presence by drilling down to relevant segments for analysis and optimization. By simply replaying a couple of Frustrated user sessions that hit one of your conversion goals, you can glean a lot of information about how you can improve the usability of your application.
But, API first!
We know the importance of automation. Keeping this in mind, the UX score is also available in USQL via the Dynatrace web UI as well as the API. It’s also part of the export stream for session data.
Start a free trial!
Dynatrace is free to use for 15 days! The trial stops automatically, no credit card is required. Just enter your email address, choose your cloud location, and install our agent.


Looking for answers?
Start a new discussion or ask for help in our Q&A forum.
Go to forum