
In our previous blog post, we developed queries to uncover suspicious behavior in our Kubernetes clusters. This time, we're going to run these queries regularly to ensure we catch that behavior as soon as it appears in our environment. We’ll also invoke the right people who know the ins and outs of the attacked workload, and have a look at how we can stop the adversary in their tracks.
Modern SecOps practices imply an engineering approach to handling threats. This involves not only treating threat detection as code but also using automation to reduce toil and support faster response to ongoing attacks. When detecting an attack, we don’t want to lose valuable time. Instead, we want to start our investigation quickly and remediate the issue as fast as possible.
This blog will cover the following three important building blocks of handling detected threats:
- Leave no gaps: By executing our queries steadily and regularly we can make sure not to miss signs of suspicious behavior. In case we detect something, we want to create an event that represents the found activity.
- Get the right eyes on it: Cloud-native environments can be complex, and only responsible teams may know the ins and outs of their applications.
- Respond quickly: By using automation we can trigger evidence collection or even disrupt the adversary’s actions.
Leave no gaps
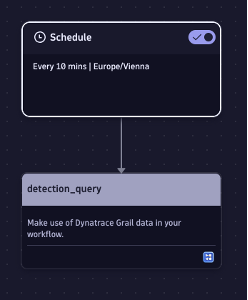
To access the Dynatrace AutomationEngine, start by creating a new workflow. We’ll give it a descriptive name and create a trigger to execute it every 10 minutes.
Next, we’re going to add a workflow action that executes DQL queries for us. We’re then pasting the query we examined in the previous blog post that aims to detect possibly compromised service accounts. Before we schedule the query, let’s add a few additional fields to make it better usable going forward:
| fieldsAdd object.name = k8s.pod.name
| fieldsAdd object.type = "k8spod"
| fieldsAdd finding.title = "Access Denied for Service Account Accessing Secret(s) or Configmap(s)"
| fieldsAdd finding.severity = "MEDIUM"
| fieldsAdd finding.time.created = toTimestamp(now())
| fieldsAdd finding.id = hashSha256(concat(toString(finding.time.created), toString(random())))
| fieldsAdd event.description = concat("Access denied for service account ", `user.name`, " accessing secret(s) or configmap(s)")
| fieldsAdd event.id = finding.id
| fieldsAdd actor.ips = array(sourceIP)
These additional fields allow the event to later be properly displayed in the Threats & Exploits app. If you choose another query to be scheduled, feel free to adjust the values accordingly. Stay tuned for part three of this series to learn more about T&E.
This query is now executed every 10 minutes. Let’s add another action to it to further process the query results. Based on the technique Tiit Hallas, principal product manager at Dynatrace, described in his blog post, Generate security events from Dynatrace Security Investigator via OpenPipeline, we’re going to add an action that creates a custom detection finding. Combining this with the OpenPipeline configuration allows us to create detection findings every time our query finds something suspicious.
Make sure to add the following fields in OpenPipeline to create a proper detection finding event:
- kind: SECURITY_EVENT
- type: DETECTION_FINDING
- provider: Dynatrace
Get the right eyes on it
SecOps teams often have two problems: there are never enough people, and they can’t know everything about the environment. Both shortcomings can be addressed by democratizing threat detection and response, including collaborating on investigations.
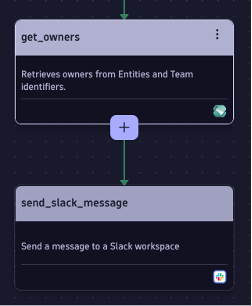
After successfully creating an event that represents our finding, it’s now time to involve the right people. The Dynatrace platform can make use of ownership information being set using native techniques, such as labels in Kubernetes. This flexible and scalable way to measure who is responsible for a certain workload, namespace, or cluster helps ensure we can programmatically find the right people and notify them immediately, such as via Slack. In my cluster, I’ve set a pod label named dt.owner on the deployment to the corresponding team name. Check out the docs to learn more about ownership.
template:
    metadata:
      labels:
        app.kubernetes.io/name: proxy-service
        app.kubernetes.io/part-of: unguard
        dt.owner: unguard-team
The resulting part of the workflow then looks something like this:
Respond quickly
The third pillar of our workflow will be all about automated response. Maybe we want to deploy a workload that collects forensic evidence. Maybe we want to deploy a network policy quarantining a workload, or maybe we want to get rid of a possibly compromised pod completely. The latter obviously doesn’t solve our problem, but it may stop the bleeding for a while and set the attacker back to square one, gaining us some valuable time for investigating the detection finding and discussing possible remediation options.
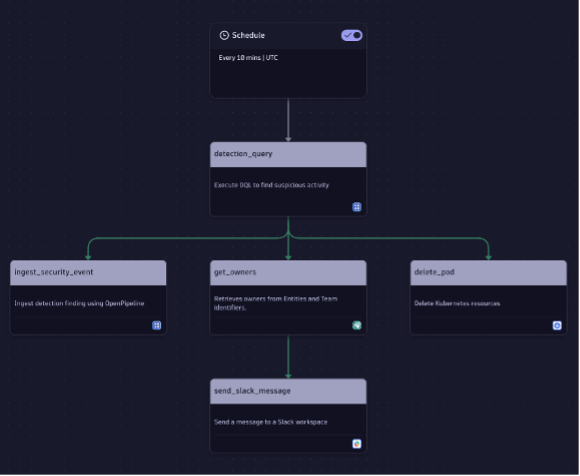
Using the Kubernetes automation capabilities combined with the Dynatrace operator, we can apply, delete, or modify any resource we’d like to. In this example, we’re deleting the pod right away to get rid of a possible foothold established by an adversary. This also completes our workflow for handling possibly compromised Kubernetes service accounts (or any other threat detection scenario you’d like to handle that way).
Threat detection with Dynatrace: What’s next?
Now that we have configured our initial set of actions, we can investigate the origins and the impact of the suspicious activity.
Stay tuned for part three of this blog series to learn about how we can do triage and investigation of this and other detection findings in Dynatrace.


Looking for answers?
Start a new discussion or ask for help in our Q&A forum.
Go to forum