
With the current threat landscape, attackers are often targeting cloud-native environments. The inherent nature of these environments means they are often spun up very quickly and are distributed, leading to monitoring and security challenges. Attackers leverage this fact, which is clearly demonstrated by the increasingly short time to exploit. On top of that, while the increasing use of AI in security can certainly benefit organizations, AI can also lead to an explosion of security findings that can overwhelm security teams. With these considerations, threat detection and runtime visibility are critical to maintaining secure environments.
In this blog, we will look at how teams can use Dynatrace’s capabilities to detect and respond to threats quickly and automatically, improving mean time to respond (MTTR) and efficacy.
Dynatrace Query Language (DQL) enables you to develop detections that uncover active threats in your cloud-native environment. By combining different data sources like logs and runtime context, Dynatrace helps improve threat detection accuracy and create actionable findings.
What would an adversary do?
Before creating a detection, there has to be a threat to protect against. Valuable inputs can be threat intelligence, penetration testing reports, or an insightful blog post, just to name a few.
Let’s take the recent ingress-nginx vulnerability (CVE-2025-1974). By creating a malicious ingress object, an adversary can execute arbitrary code in the context of the ingress-nginx service account. Because the service account has permissions to access all secrets within the entire cluster this was categorized as a critical vulnerability. If a threat actor would successfully exploit such a vulnerability, what would they do next and what would be a good method to detect such suspicious behavior?
Threat detection engineering
A common thing attackers do after establishing a foothold is use their newly gained permissions and look for sensitive data (such as credentials) to further escalate their privileges. In the case of Kubernetes, this can be done by asking the kube-api to return all available secrets and configmaps. This uses the permissions of the compromised pod’s service account.
Since the service account may be allowed to access some of those resources but not all of them, this will inevitably result in responses from the kube-api server signaling the requester (the attacker sitting in one of our pods) access has been denied, including an HTTP status code of 403: “Forbidden”. This should rarely happen in a cluster under normal circumstances and is thus a good starting point for building a detection.
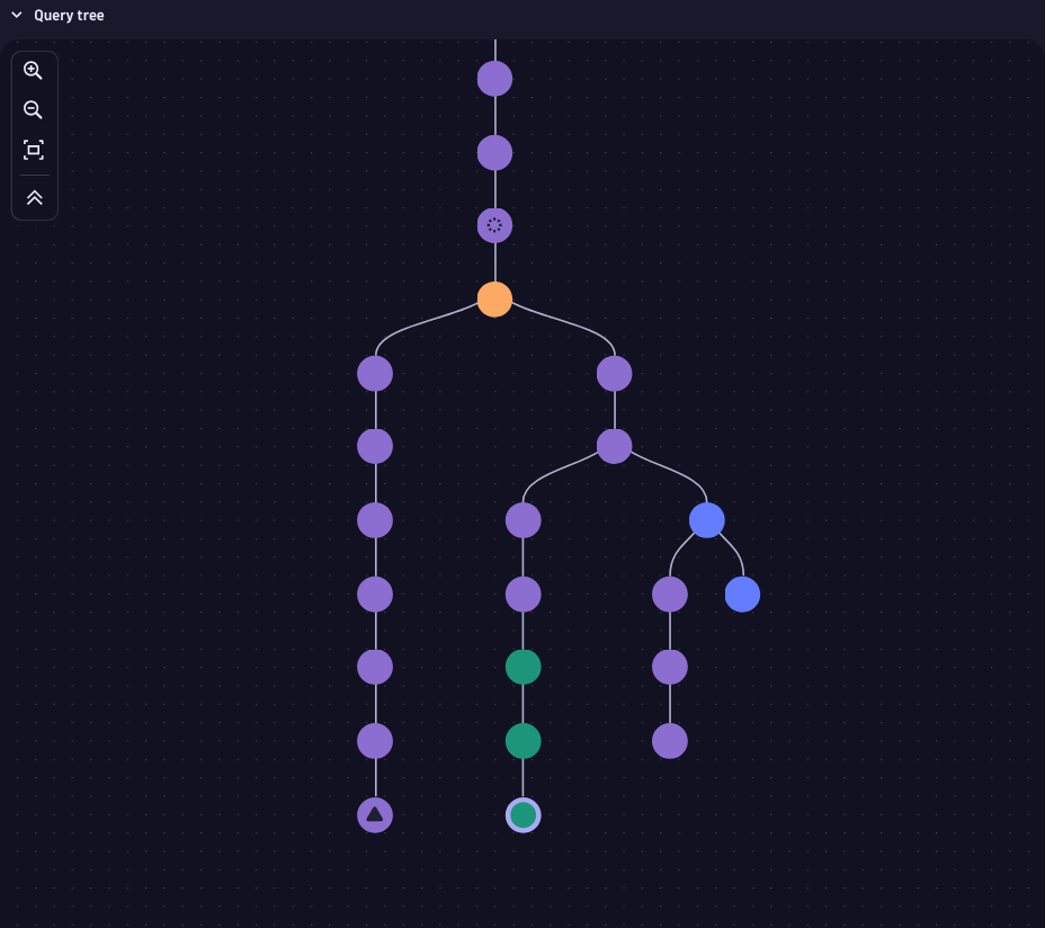
Before we start working on our query, let’s talk about the right tool for the job: Security Investigator. Developing detections is an iterative process. You may have to jump back and forth, search other data sources for relevant information, drill down, zoom out again, etc. When using other tools, you may end up with either a huge list of queries in some form (and needing to copy/paste them all the time) or dozens of browser tabs open with all the different snippets and versions of your query. By using Security Investigator’s query tree, your queries are automatically saved. You can start another branch or go back to a previous version of your query.
Now, back to the adversary and our compromised pod: how can we detect this behavior? By using the ability to search through all the data Dynatrace has about the environment, we can make this indicator visible.
Note: For readability, the query snippets mentioned have been shortened. To get the full query and others, check out the appendix.
fetch logs,
  from: -15m,
  scanLimitGBytes: -1

| parse content, "JSON{JSON{STRING+:log}(flat=true):properties}(flat=true)",
  parsingPrerequisite: (
    azure.resource.type == "MICROSOFT.CONTAINERSERVICE/MANAGEDCLUSTERS" and
    log.source == "kube-audit"
  )
| fieldsAdd content=coalesce(properties, content)
| parse content, "JSON{
  STRING+:kind,
  STRING+:apiVersion,
  STRING+:level,
  STRING+:auditID,
  STRING+:stage,
  STRING+:requestURI,
  STRING:verb,
  JSON:user,
  JSON_ARRAY{ipaddr}(typed=true):sourceIPs,
  STRING+:userAgent,
  JSON:objectRef,
  JSON:responseStatus,
  TIMESTAMP('yyyy-MM-ddTHH:mm:ss.SZ'):requestReceivedTimestamp,
  TIMESTAMP('yyyy-MM-ddTHH:mm:ss.SZ'):stageTimestamp,
  JSON:annotations
  }(flat=true)"

| filter
  apiVersion == "audit.k8s.io/v1" and
  startsWith(user[username], "system:serviceaccount:") and
  in(verb, {"list", "get"}) and
  in(objectRef[resource], {"configmaps", "secrets"}) and
  responseStatus[reason] == "Forbidden"
This query fetches all the logs and parses the fields of the Kubernetes audit log. It then filters only on those records, including failed requests by service accounts trying to access configmaps or secrets. I’ve executed the suspicious behavior in my environment and ran this query. Let’s see what we get:
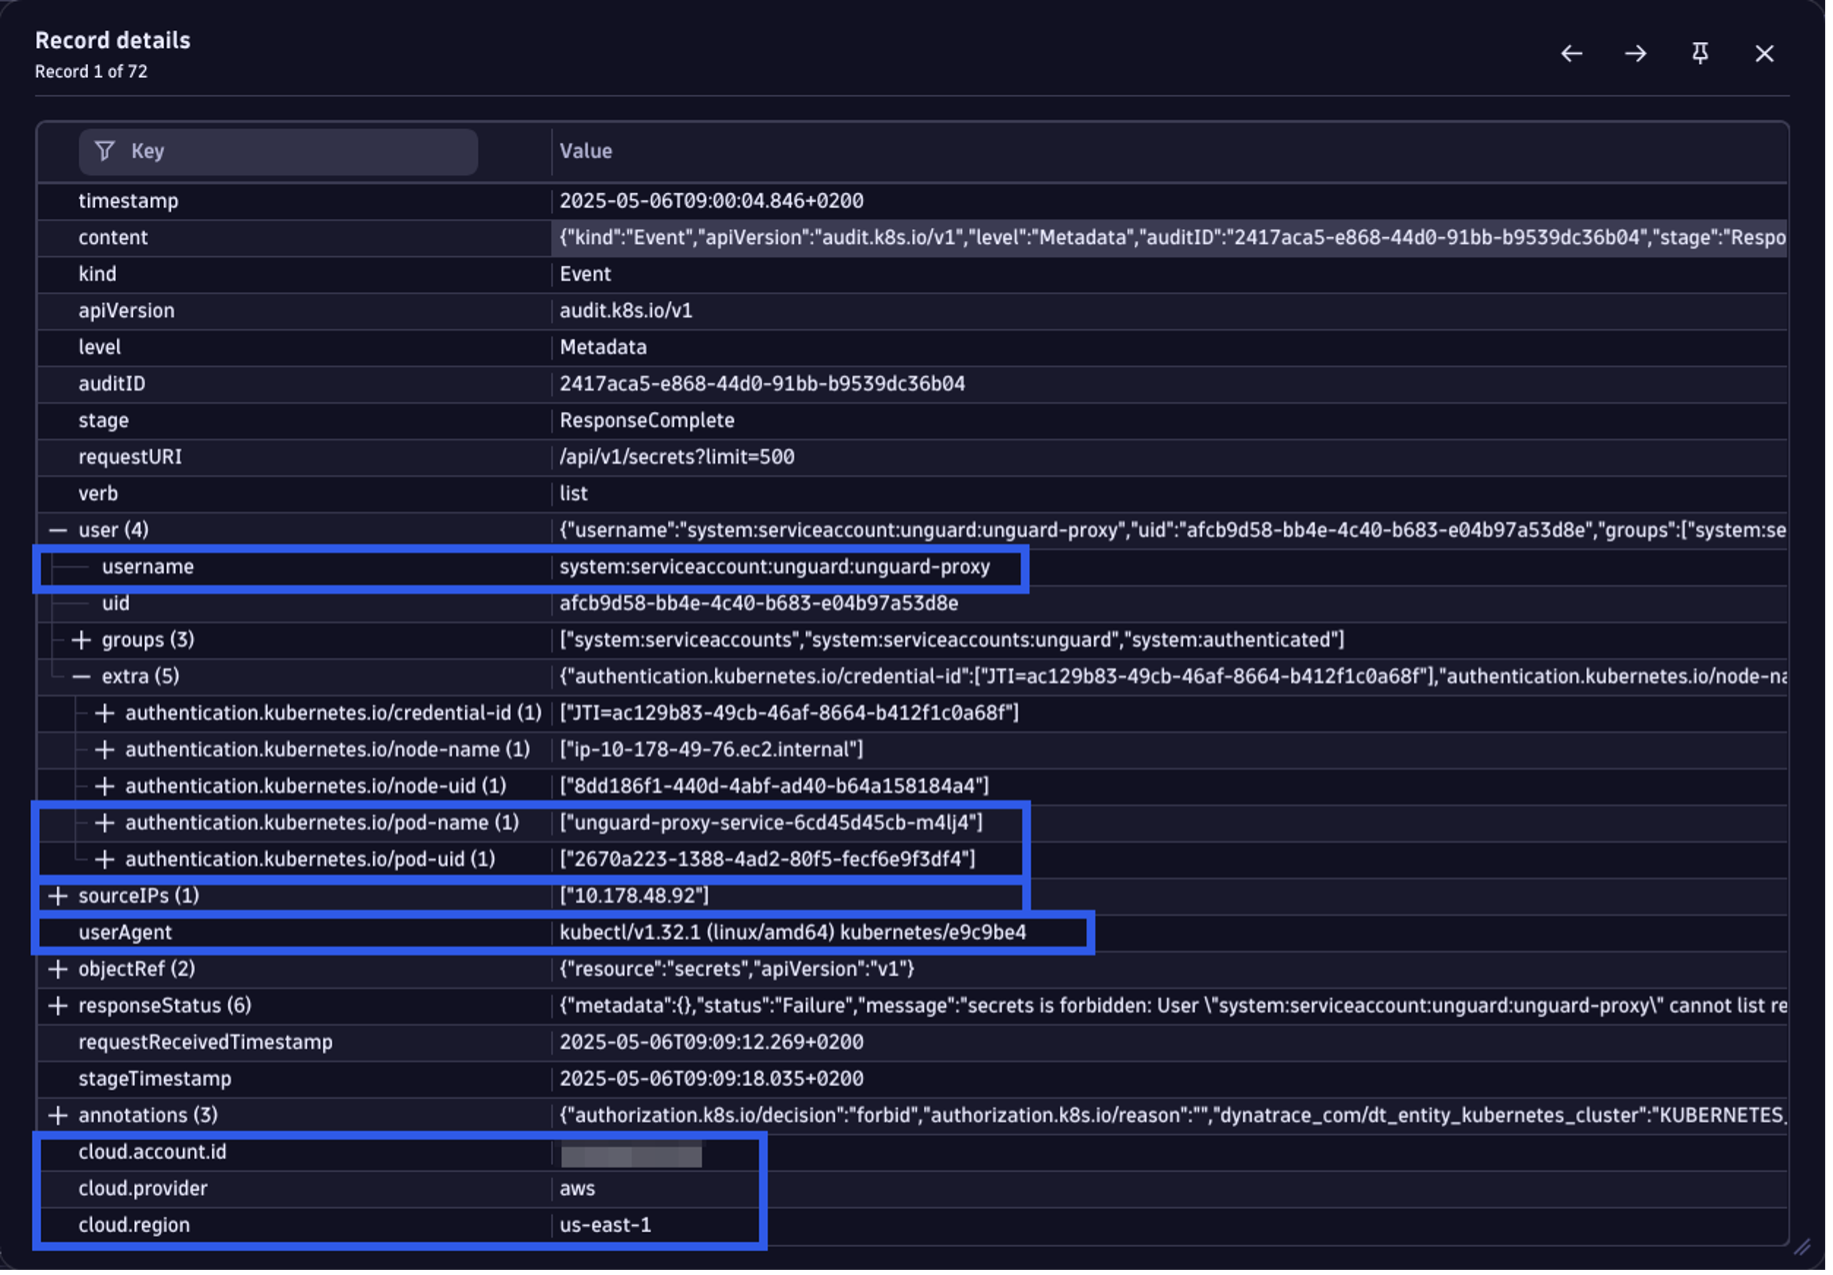
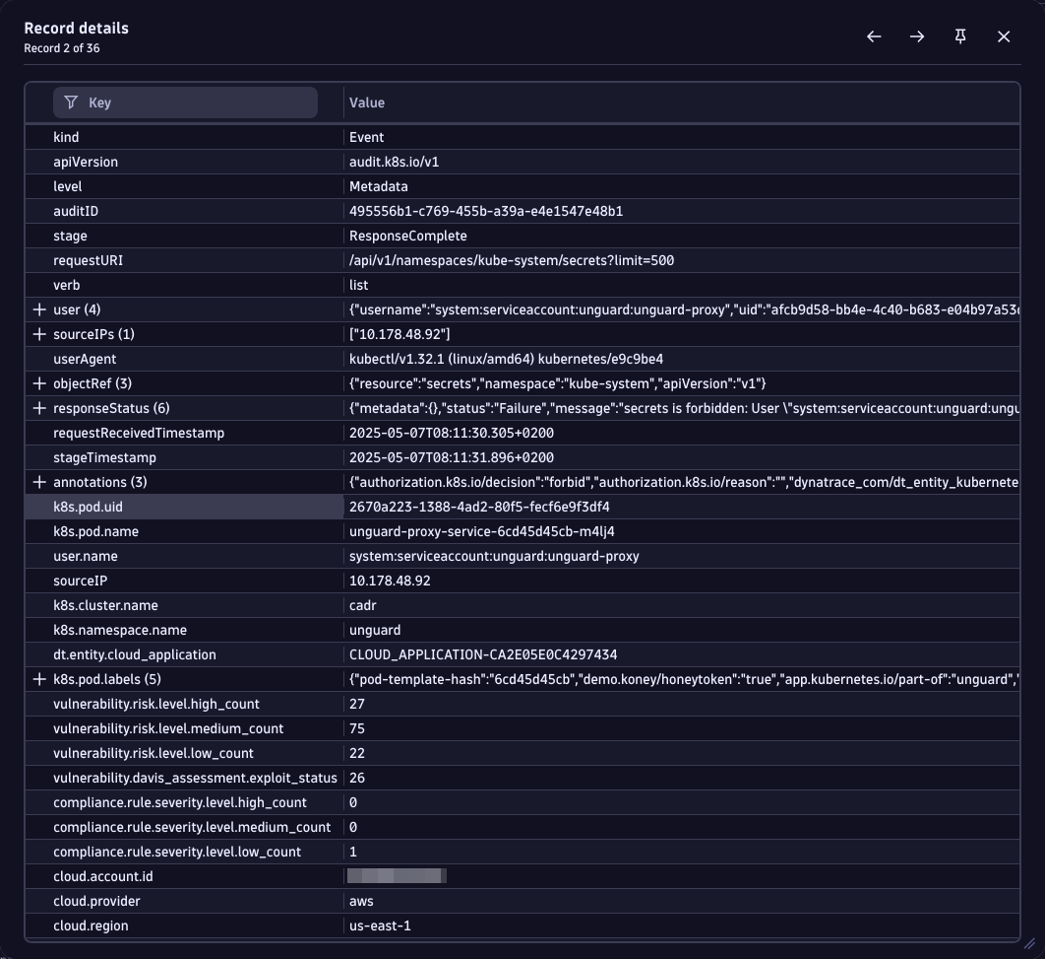
So far, our query is working perfectly. A few things can be observed by looking at the result:
👍 We see the name of the service account acting suspiciously. In our case, we see “unguard-proxy” in a namespace called “unguard”.
👍 We gain additional information about the pod this request originated from, including its name and uid.
👍 We also get the user agent used to execute the requests. In this case, it’s “kubectl”, which is also a bit telling, since it’s a CLI tool mostly used by humans and rarely by service accounts.
👍 Additionally, we get the source IP of the requester, which seems to be a private IP.
👍 Because Dynatrace is enriching the logs automatically with some metadata, we have fields like cloud.account.id, cloud.provider and cloud.region included, as well.
When we encounter such a suspicious event, we may want to know a few additional things to be able to better assess the situation:
🤔 If there are any vulnerabilities affecting this pod. This may lead us to a possible exploitation of one of those vulnerabilities.
🤔 If there are any critical compliance findings affecting this pod. This may tell us, for example, if a pod is running with elevated privileges.
🤔 Pod labels might tell us more about ownership or other relevant metadata.
If this query finds something malicious down the road, we will definitely want to know more about the security-related context of the originating pod (more on that in a future post of this series). In the end, this could lead us directly to a compromised pod, and we want to avoid requesting access to the cluster or cloud environment in the heat of a possible security incident.
Enriching logs with runtime information
By using what we already know about our cloud-native environment (including all the clusters, namespaces, and pods) with Dynatrace, we can enrich the bare Kubernetes audit log with runtime context based on the entity model. To get the pod name and its namespace from the IP address, we could add the following snippet to our query:
// enrich with smartscape data
| join [
fetch dt.entity.cloud_application_instance, from:-24h
| fieldsAdd resourceUid
| fieldsAdd clustered_by
| fieldsAdd dt.entity.cloud_application = instance_of[dt.entity.cloud_application]
| fieldsAdd dt.entity.kubernetes_cluster = clustered_by[dt.entity.kubernetes_cluster]
| fieldsAdd clusterName = entityName(dt.entity.kubernetes_cluster)
| fieldsAdd cloudApplicationLabels
],
kind: leftOuter,
on: { left[k8s.pod.uid] == right[resourceUid] },
fields: {
k8s.cluster.name = clusterName,
k8s.namespace.name = namespaceName,
dt.entity.cloud_application,
k8s.pod.labels = cloudApplicationLabels
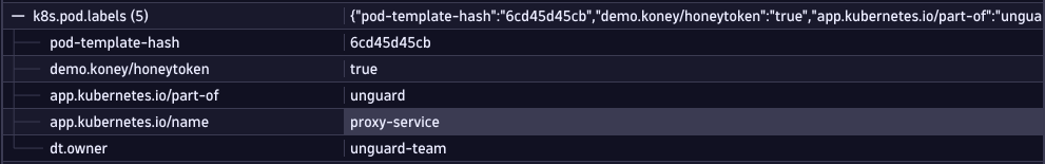
}This gives us not only the cluster name of where this activity is happening but also the unique identifier of the pod in the entity model, along with all of its labels. Immediately, we know which team owns the workload and who to contact in the event of a confirmed true positive.
Using the unique entity ID, we can now enrich the event even further with vulnerability data. If the pod we’re looking at is known to be vulnerable, we want to know if it may be affected by a vulnerability that could explain the suspicious behavior of its service account.
// enrich with vulnerability data
| join [
fetch events
| filter
event.kind == "SECURITY_EVENT" and
event.category == "VULNERABILITY_MANAGEMENT" and
event.type == "VULNERABILITY_STATE_REPORT_EVENT" and
event.status == "OPEN"
| expand related_entities.kubernetes_workloads.id = related_entities.kubernetes_workloads.ids
| summarize {
vulnerability.risk.level = takeLast(vulnerability.risk.level),
vulnerability.davis_assessment.exploit_status = takeLast(vulnerability.davis_assessment.exploit_status)
},
by: {
vulnerability.id,
related_entities.kubernetes_workloads.id
}
| summarize {
vulnerability.risk.level.high_count = countIf(vulnerability.risk.level == "HIGH"),
vulnerability.risk.level.medium_count = countIf(vulnerability.risk.level == "MEDIUM"),
vulnerability.risk.level.low_count = countIf(vulnerability.risk.level == "LOW"),
vulnerability.davis_assessment.exploit_status = countIf(vulnerability.davis_assessment.exploit_status == "AVAILABLE")
},
by: { related_entities.kubernetes_workloads.id }
],
on: {left[dt.entity.cloud_application]==right[related_entities.kubernetes_workloads.id]},
fields: {
vulnerability.risk.level.high_count,
vulnerability.risk.level.medium_count,
vulnerability.risk.level.low_count,
vulnerability.davis_assessment.exploit_status
},
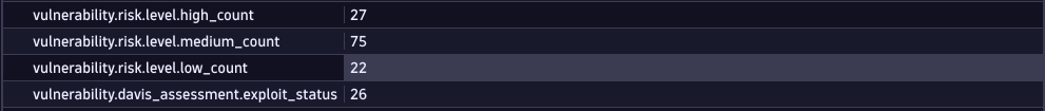
kind:leftOuterThis gives us additional fields that indicate if there are vulnerabilities affecting the pod based on their severity, as well as the exposure of the vulnerability and if an exploit is available.
Lastly, we may even want to enrich the event with information from Kubernetes security posture management (KSPM) findings:
// enrich with compliance data
| join [
  fetch events, from:-2h
  | filter event.kind == "SECURITY_EVENT"
  | filter event.type == "COMPLIANCE_FINDING"
  | filter compliance.result.object.type == "k8spod"
  | filter compliance.result.status.level == "FAILED"
  | summarize {
      compliance.rule.severity.level = takeLast(compliance.rule.severity.level)
    },
    by: {
      k8s.cluster.name,
      object.name,
      compliance.rule.id
    }

  | summarize {
      compliance.rule.severity.level.high_count = countIf(compliance.rule.severity.level == "HIGH"),
      compliance.rule.severity.level.medium_count = countIf(compliance.rule.severity.level == "MEDIUM"),
      compliance.rule.severity.level.low_count = countIf(compliance.rule.severity.level == "LOW")
  },
  by: {
    k8s.cluster.name,
    object.name
  }
],
on: {
  k8s.cluster.name,
  left[k8s.pod.name]==right[object.name]
},
kind:leftOuter,
fields: {
  compliance.rule.severity.level.high_count,
  compliance.rule.severity.level.medium_count,
  compliance.rule.severity.level.low_count
}
Whatever runtime context you like your finding to include, the chances are high that Dynatrace already knows about it. With DQL, Grail, and Smartscape, you’re able to create meaningful high-fidelity alerts to protect your cloud-native environment.
Lastly, we can add some metadata based on MITRE ATT&CK. This will allow us to track some metrics and maybe even create some meta-detections later.
| fieldsAdd mitre.attack.enterprise.tactic.ids = array("TA0006")
| fieldsAdd mitre.attack.enterprise.technique.ids = array("T1552.007")
Adding those two fields tells us in case this event fires, the tactic and the corresponding technique. This results in the following rich event, that allows to establish situational awareness quickly and confidently:
Sample queries
In the appendix, you will find this query and others addressing the following techniques:
- Kubernetes API Permission Enumeration
- Kubernetes Admission Controller Modification
- Kubernetes Events Deletion
Feel free to execute them in your environment and adjust them to your needs as the best queries are the ones that are tightly tuned to the environment they’re running in.
Threat detection with Dynatrace: What’s next
Creating a detection query is one of the first steps to successfully handling a threat, but not the last one. By combining multiple capabilities of the Dynatrace platform, teams can continuously check for signs of an ongoing attack, create a detection finding in case we uncover an active adversary, and provide investigative guidance on how to deal with such a finding after it has been created. Future articles will go into detail about these topics to be able to not only successfully detect malicious activity, but also adequately respond to it.
Appendix
Access Denied for Service Account Accessing Secret(s) or Configmap(s)
fetch logs,
  from: -15m,
  to: -5m,
  scanLimitGBytes: -1

// MS AKS
| parse content, "JSON{JSON{STRING+:log}(flat=true):properties}(flat=true)",
  parsingPrerequisite: (
    azure.resource.type == "MICROSOFT.CONTAINERSERVICE/MANAGEDCLUSTERS" and
    log.source == "kube-audit"
  )
| fieldsAdd content=coalesce(properties, content)

| parse content, "JSON{
  STRING+:kind,
  STRING+:apiVersion,
  STRING+:level,
  STRING+:auditID,
  STRING+:stage,
  STRING+:requestURI,
  STRING:verb,
  JSON:user,
  JSON_ARRAY{ipaddr}(typed=true):sourceIPs,
  STRING+:userAgent,
  JSON:objectRef,
  JSON:responseStatus,
  TIMESTAMP('yyyy-MM-ddTHH:mm:ss.SZ'):requestReceivedTimestamp,
  TIMESTAMP('yyyy-MM-ddTHH:mm:ss.SZ'):stageTimestamp,
  JSON:annotations
  }(flat=true)"

// filter on denied requests of service accounts trying to access configmaps and/or secrets
| filter
  apiVersion == "audit.k8s.io/v1" and
  startsWith(user[username], "system:serviceaccount:") and
  in(verb, {"list", "get"}) and
  in(objectRef[resource], {"configmaps", "secrets"}) and
  responseStatus[reason] == "Forbidden"

| fieldsAdd
  k8s.pod.uid = user[extra][`authentication.kubernetes.io/pod-uid`],
  k8s.pod.name = user[extra][`authentication.kubernetes.io/pod-name`],
  user.name = user[username]

| expand k8s.pod.uid
| expand k8s.pod.name
| expand sourceIP = sourceIPs

// enrich with smartscape data
| join [
    fetch dt.entity.cloud_application_instance, from:-24h
    | fieldsAdd resourceUid
    | fieldsAdd clustered_by
    | fieldsAdd dt.entity.cloud_application = instance_of[dt.entity.cloud_application]
    | fieldsAdd dt.entity.kubernetes_cluster = clustered_by[dt.entity.kubernetes_cluster]
    | fieldsAdd clusterName = entityName(dt.entity.kubernetes_cluster)
  ],
  kind: leftOuter,
  on: { left[k8s.pod.uid] == right[resourceUid] },
  fields: {
    k8s.cluster.name = clusterName,
    k8s.namespace.name = namespaceName,
    dt.entity.cloud_application
  }

// enrich with vulnerability data
| join [
fetch events
| filter
  event.kind == "SECURITY_EVENT" and
  event.category == "VULNERABILITY_MANAGEMENT" and
  event.type == "VULNERABILITY_STATE_REPORT_EVENT" and
  event.status == "OPEN"
| expand related_entities.kubernetes_workloads.id = related_entities.kubernetes_workloads.ids
| summarize {
  vulnerability.risk.level = takeLast(vulnerability.risk.level),
  vulnerability.davis_assessment.exploit_status = takeLast(vulnerability.davis_assessment.exploit_status)
  },
  by: {
    vulnerability.id,
    related_entities.kubernetes_workloads.id
    }
| summarize {
  vulnerability.risk.level.high_count = countIf(vulnerability.risk.level == "HIGH"),
  vulnerability.risk.level.medium_count = countIf(vulnerability.risk.level == "MEDIUM"),
  vulnerability.risk.level.low_count = countIf(vulnerability.risk.level == "LOW"),
  vulnerability.davis_assessment.exploit_status = countIf(vulnerability.davis_assessment.exploit_status == "AVAILABLE")
  },
  by: { related_entities.kubernetes_workloads.id }
  ],
on: {left[dt.entity.cloud_application]==right[related_entities.kubernetes_workloads.id]},
fields: {
  vulnerability.risk.level.high_count,
  vulnerability.risk.level.medium_count,
  vulnerability.risk.level.low_count,
  vulnerability.davis_assessment.exploit_status
},
kind:leftOuter

// enrich with compliance data
| join [
  fetch events, from:-1h
  | filter event.kind == "SECURITY_EVENT"
  | filter event.type == "COMPLIANCE_FINDING"
  | filter compliance.result.object.type == "k8spod"
  | filter compliance.result.status.level == "FAILED"
  | summarize {
      compliance.rule.severity.level = takeLast(compliance.rule.severity.level)
    },
    by: {
      k8s.cluster.name,
      object.name,
      compliance.rule.id
    }

  | summarize {
      compliance.rule.severity.level.high_count = countIf(compliance.rule.severity.level == "HIGH"),
      compliance.rule.severity.level.medium_count = countIf(compliance.rule.severity.level == "MEDIUM"),
      compliance.rule.severity.level.low_count = countIf(compliance.rule.severity.level == "LOW")
  },
  by: {
    k8s.cluster.name,
    object.name
  }
],
on: {
  k8s.cluster.name,
  left[k8s.pod.name]==right[object.name]
},
kind:leftOuter,
fields: {
  compliance.rule.severity.level.high_count,
  compliance.rule.severity.level.medium_count,
  compliance.rule.severity.level.low_count
}

| fieldsAdd mitre.attack.enterprise.tactic.id = array("TA0006")
| fieldsAdd mitre.attack.enterprise.technique.id = array("T1552.007")
Kubernetes API Permission Enumeration
fetch logs,
  from: -15m,
  to: -5m,
  scanLimitGBytes: -1

// MS AKS
| parse content, "JSON{JSON{STRING+:log}(flat=true):properties}(flat=true)",
  parsingPrerequisite: (
    azure.resource.type == "MICROSOFT.CONTAINERSERVICE/MANAGEDCLUSTERS" and
    log.source == "kube-audit")
| fieldsAdd content=coalesce(properties, content)

| parse content, "JSON{
    STRING+:kind,
    STRING+:apiVersion,
    STRING+:level,
    STRING+:auditID,
    STRING+:stage,
    STRING+:requestURI,
    STRING:verb,
    JSON:user,
    JSON_ARRAY{ipaddr}(typed=true):sourceIPs,
    STRING+:userAgent,
    JSON:objectRef,
    JSON:responseStatus,
    TIMESTAMP('yyyy-MM-ddTHH:mm:ss.SZ'):requestReceivedTimestamp,
    TIMESTAMP('yyyy-MM-ddTHH:mm:ss.SZ'):stageTimestamp,
    JSON:annotations
  }(flat=true)"
| filter
  apiVersion == "audit.k8s.io/v1" and
  verb == "create" and
  in (objectRef[resource], {"selfsubjectrulesreviews", "selfsubjectaccessreviews"}) and
  objectRef[apiGroup] == "authorization.k8s.io" and
  startsWith(user[username], "system:serviceaccount:")

| fieldsAdd
  k8s.pod.uid = user[extra][`authentication.kubernetes.io/pod-uid`],
  k8s.pod.name = user[extra][`authentication.kubernetes.io/pod-name`],
  user.name = user[username]

| expand k8s.pod.uid
| expand k8s.pod.name
| expand sourceIP = sourceIPs

// enrich with smartscape data
| join [
    fetch dt.entity.cloud_application_instance, from:-24h
    | fieldsAdd resourceUid
    | fieldsAdd clustered_by
    | fieldsAdd dt.entity.cloud_application = instance_of[dt.entity.cloud_application]
    | fieldsAdd dt.entity.kubernetes_cluster = clustered_by[dt.entity.kubernetes_cluster]
    | fieldsAdd clusterName = entityName(dt.entity.kubernetes_cluster)
  ],
  kind: leftOuter,
  on: { left[k8s.pod.uid] == right[resourceUid] },
  fields: {
    k8s.cluster.name = clusterName,
    k8s.namespace.name = namespaceName,
    dt.entity.cloud_application
  }

// enrich with vulnerability data
| join [
fetch events
| filter
  event.kind == "SECURITY_EVENT" and
  event.category == "VULNERABILITY_MANAGEMENT" and
  event.type == "VULNERABILITY_STATE_REPORT_EVENT" and
  event.status == "OPEN"
| expand related_entities.kubernetes_workloads.id = related_entities.kubernetes_workloads.ids
| summarize {
  vulnerability.risk.level = takeLast(vulnerability.risk.level),
  vulnerability.davis_assessment.exploit_status = takeLast(vulnerability.davis_assessment.exploit_status)
  },
  by: {
    vulnerability.id,
    related_entities.kubernetes_workloads.id
    }
| summarize {
  vulnerability.risk.level.high_count = countIf(vulnerability.risk.level == "HIGH"),
  vulnerability.risk.level.medium_count = countIf(vulnerability.risk.level == "MEDIUM"),
  vulnerability.risk.level.low_count = countIf(vulnerability.risk.level == "LOW"),
  vulnerability.davis_assessment.exploit_status = countIf(vulnerability.davis_assessment.exploit_status == "AVAILABLE")
  },
  by: { related_entities.kubernetes_workloads.id }
  ],
on: {left[dt.entity.cloud_application]==right[related_entities.kubernetes_workloads.id]},
fields: {
  vulnerability.risk.level.high_count,
  vulnerability.risk.level.medium_count,
  vulnerability.risk.level.low_count,
  vulnerability.davis_assessment.exploit_status
},
kind:leftOuter

// enrich with compliance data
| join [
  fetch events, from:-20m
  | filter event.kind == "SECURITY_EVENT"
  | filter event.type == "COMPLIANCE_FINDING"
  | filter compliance.result.object.type == "k8spod"
  | filter compliance.result.status.level == "FAILED"
  | sort timestamp desc
  | summarize {
      compliance.rule.severity.level = takeFirst(compliance.rule.severity.level)
    },
    by: {
      k8s.cluster.name,
      object.name,
      compliance.rule.id
    }

  | summarize {
      compliance.rule.severity.level.high_count = countIf(compliance.rule.severity.level == "HIGH"),
      compliance.rule.severity.level.medium_count = countIf(compliance.rule.severity.level == "MEDIUM"),
      compliance.rule.severity.level.low_count = countIf(compliance.rule.severity.level == "LOW")
  },
  by: {
    k8s.cluster.name,
    object.name
  }
],
on: {
  k8s.cluster.name,
  left[k8s.pod.name]==right[object.name]
},
kind:leftOuter,
fields: {
  compliance.rule.severity.level.high_count,
  compliance.rule.severity.level.medium_count,
  compliance.rule.severity.level.low_count
}

| fieldsAdd mitre.attack.enterprise.tactic.id = "TA0007"
| fieldsAdd mitre.attack.enterprise.technique.id = "T1069"
Kubernetes Admission Controller Modification
fetch logs,
  from: -15m,
  to: -5m,
  scanLimitGBytes: -1

// MS AKS
| parse content, "JSON{JSON{STRING+:log}(flat=true):properties}(flat=true)",
  parsingPrerequisite: (
    azure.resource.type == "MICROSOFT.CONTAINERSERVICE/MANAGEDCLUSTERS" and
    log.source == "kube-audit")
| fieldsAdd content=coalesce(properties, content)

| parse content, "JSON{
    STRING+:kind,
    STRING+:apiVersion,
    STRING+:level,
    STRING+:auditID,
    STRING+:stage,
    STRING+:requestURI,
    STRING:verb,
    JSON:user,
    JSON_ARRAY{ipaddr}(typed=true):sourceIPs,
    STRING+:userAgent,
    JSON:objectRef,
    JSON:responseStatus,
    TIMESTAMP('yyyy-MM-ddTHH:mm:ss.SZ'):requestReceivedTimestamp,
    TIMESTAMP('yyyy-MM-ddTHH:mm:ss.SZ'):stageTimestamp,
    JSON:annotations
  }(flat=true)"

| filter
    apiVersion == "audit.k8s.io/v1" and
    objectRef[apiGroup] == "admissionregistration.k8s.io" and
    in(objectRef[resource], { "mutatingwebhookconfigurations", "validatingwebhookconfigurations" }) and
    in(verb, { "create", "patch", "replace", "update" })

| fieldsAdd mitre.attack.enterprise.tactic.ids = array("TA0003", "TA0004")
| fieldsAdd mitre.attack.enterprise.technique.ids = array("T1078", "T1552", "T1552.007")
Kubernetes Events Deleted
fetch logs,
  from: -15m,
  to: -5m,
  scanLimitGBytes: -1

// MS AKS
| parse content, "JSON{JSON{STRING+:log}(flat=true):properties}(flat=true)",
  parsingPrerequisite: (
    azure.resource.type == "MICROSOFT.CONTAINERSERVICE/MANAGEDCLUSTERS" and
    log.source == "kube-audit")
| fieldsAdd content=coalesce(properties, content)

| parse content, "JSON{
    STRING+:kind,
    STRING+:apiVersion,
    STRING+:level,
    STRING+:auditID,
    STRING+:stage,
    STRING+:requestURI,
    STRING:verb,
    JSON:user,
    JSON_ARRAY{ipaddr}(typed=true):sourceIPs,
    STRING+:userAgent,
    JSON:objectRef,
    JSON:responseStatus,
    TIMESTAMP('yyyy-MM-ddTHH:mm:ss.SZ'):requestReceivedTimestamp,
    TIMESTAMP('yyyy-MM-ddTHH:mm:ss.SZ'):stageTimestamp,
    JSON:annotations
  }(flat=true)"

// filter for deleted events
| filter
    apiVersion == "audit.k8s.io/v1" and
    objectRef[resource] == "events" and
    verb == "delete"

| fieldsAdd mitre.attack.enterprise.tactic.id = "TA0005"
| fieldsAdd mitre.attack.enterprise.technique.id = "T1070"

Looking for answers?
Start a new discussion or ask for help in our Q&A forum.
Go to forum