
OpenTelemetry is an open-source framework of tools, APIs, and SDKs that help analysts understand software performance and behavior. Also referred to as OTel, OpenTelemetry is rapidly solidifying its position as a fundamental tool in the world of observability.
Born as an open-source project under the Cloud Native Computing Foundation (CNCF), OpenTelemetry provides a unified framework for generating, collecting, processing, and exporting telemetry data—including logs, metrics, and traces.
Using OpenTelemetry, IT teams can instrument, generate, collect, and export telemetry data for analysis to better understand software performance and behavior. When OpenTelemetry debuted in beta in 2020, it replaced its predecessors, OpenTracing and OpenCensus.
OpenTelemetry enables observability
To appreciate what OTel does, it helps to understand observability. Traditionally speaking, observability is the ability to understand what’s happening inside a system from the knowledge of the external data it produces; usually logs, metrics, and traces.
But the data itself is only as good as what you can learn from and do with it. This definition from Hazel Weakly sums it up nicely:
“Observability is the ability to ask meaningful questions, get useful answers, and act effectively on what you’ve learned.”
Observability is important because the systems of today are exponentially more complex than the systems of ten, or even five years ago. The shift from monolithic to distributed IT architectures introduces many more moving parts and interactions to keep track of, sometimes leading to systems behaving in unpredictable ways. Observability helps you make sense of what’s happening so you can act on this information, and OpenTelemetry helps to enable observability.
By promoting consistency and interoperability, OpenTelemetry enhances observability practices and benefits the entire industry by streamlining and standardizing how everyone can collect and use data.
Since the project’s start, many vendors, including Dynatrace, have contributed to the project to make rich data collection easier and more consumable. In fact, Dynatrace is one of the top contributing organizations to OpenTelemetry.
Benefits of OpenTelemetry
Collecting application data is nothing new. However, the collection mechanism and format are rarely consistent from one application to another. This inconsistency can be a nightmare for developers and Site Reliability Engineers (SREs) who are just trying to understand the health of an application.
Most of the major observability vendors, including Dynatrace, support OTel. As a result, it has become the de facto standard for instrumenting cloud-native applications. What differentiates observability solutions from one another is what they do with your data to help you ask the right questions. Asking the right questions unlocks an elevated level of understanding, giving businesses the ability to accelerate growth, drive innovation, and deliver experiences customers love.
It’s akin to how Kubernetes became the standard for container orchestration. This broad adoption has made it easier for organizations to implement container deployments since they don’t need to build their own enterprise-grade orchestration platform. Using Kubernetes as the analog for what it can become, it’s easy to see the benefits it can provide to the entire industry.
To understand why observability and OTel’s approach to it are so critical, let’s take a deeper look at telemetry data itself and how it can help organizations transform how they do business.
What is telemetry data?
Telemetry is the process of gathering and transmitting signals (data) emitted by instrumentation code within a system’s components. Traces, metrics, and logs make up most of all telemetry data.
- Traces result from following a process (for example, an API request or other system activity) from start to finish, showing how services connect. Keeping watch over this pathway is critical to understanding how your ecosystem works, if it’s working effectively, and if any troubleshooting is necessary. Traces consist of individual operations called spans, which include unique identifiers, such as operation name, timestamp, context, attributes, events, and status.
- Metrics are numerical data points, either counts or measures, that systems can calculate or aggregate over time. Metrics originate from several sources, including infrastructure, hosts, and third-party sources. While logs may not always be accessible, most metrics are readily available via query. Timestamps, values, and even event names can preemptively uncover a growing problem that needs remediation.
- Logs are important because you’ll naturally want an event-based record of notable anomalies across the system. Structured, unstructured, or plain text, these readable files can tell you the results of any transaction involving an endpoint within your multicloud environment. However, not all logs are inherently reviewable—a problem that’s given rise to external log analysis tools.
Telemetry data becomes observability data when, as noted above, you can “ask meaningful questions, get useful answers, and act effectively on that information.” Making sense of it all requires an observability backend.
How does OpenTelemetry work?
OTel consists of a few components as depicted in the following figure. Let’s take a high-level look at each one from left to right:
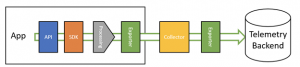
- Specification. Defines a standard telemetry data format and describes how to build instrumentation. This ensures that users have a similar experience, regardless of what language they’re using.
- Data model. Defines fields for each signal and how they interact. Signals include traces, logs, and metrics.
- API. Defines the methods used to instrument applications and serves as the entry point for instrumentation. Each language supported by OpenTelemetry has its own API implementation.
- SDK. Implements the API and also determines how systems generate and correlate their telemetry. Each language supported by OpenTelemetry has its own SDK. Both the APIs and the SDKs are defined in the specification to ensure a consistent experience across implementations.
- Collector. A vendor-neutral binary used to ingest, transform, and export data to one or more observability backends.
- OpenTelemetry Protocol (OTLP). A vendor—and tool-agnostic specification for encoding—transmitting and delivering OpenTelemetry data. Telemetry data emitted by the SDK uses OTLP, and many observability backends now support ingesting data in the OTLP format. For those who do not, there are exporters available that convert data from OTLP to a tool-specific format. OTLP supports both HTTP and gRPC.
- Observability backend. A system or tool where telemetry data collected by OpenTelemetry is sent, stored, and analyzed. It enables organizations to derive meaningful insights and make sense of telemetry data in a cohesive way.
Flexible API/SDK integration
You can decouple the API from the telemetry-generating code with minimal implementation. This decoupling allows your app or library to run with just the API package, without sending telemetry data to the backend. This setup acts as a placeholder until you’re ready to integrate an SDK. When ready, you can choose an SDK that best fits your needs, whether it’s the OpenTelemetry SDK, a vendor-specific one, or a custom-built SDK. This flexibility ensures you can add functionality without significant code changes.
What’s next for OpenTelemetry?
OpenTelemetry is maturing and is fast approaching its graduation as a CNCF project. Traces, logs and most parts of metrics are now considered generally available. The OpenTelemetry project’s goals extend well beyond its current offerings. Exciting initiatives are paving the way for even broader use cases, such as improving digital experiences and enabling detailed insights into application performance through code-level profiling. Let’s check out some highlights of OpenTelemetry’s exciting initiatives, all designed to take observability to the next level.
- Digital Experience Monitoring. Developers and product teams will soon be able to gather telemetry data directly from user-facing applications. This allows organizations to identify where users face lags or issues, enhancing overall app performance.
- Code-Level Profiling. OpenTelemetry is also evolving to profile application code in real-time. This provides deeper insights into how specific sections of code behave in production, helping engineers optimize critical parts of their applications.
- AI Agents. Recently, there’s been an explosion in the need for monitoring AI systems. OpenLLMetry is donating their code to the OpenTelemetry project. If accepted, it will soon become an extension of the OpenTelemetry ecosystem.
How can I contribute to the OTel community?
If you’ve been curious about contributing to OpenTelemetry (OTel) but are unsure where to begin, there are plenty of ways to get involved. Whether you’re a newcomer or a seasoned practitioner, the OpenTelemetry community offers a variety of opportunities suited to different interests and skill levels.
Some ways you can contribute to the OpenTelemetry Project include the OpenTelemetry documentation, OpenTelemetry blog, End User SIG, OpenTelemetry Demo, or a language or component-specific Special Interest Group SIG). No matter how big or small your contributions, they make a difference and are deeply valued.
OpenTelemetry veteran, Adriana Villela, wrote a great article to help you get started.
How does Dynatrace contribute to the Otel community?
Dynatrace is an active member of the OpenTelemetry community. Dynatracers hold key leadership roles as project maintainers or approvers in the following groups:
- OpenTelemetry Technical Committee
- OpenTelemetry Specification (Metrics, Semantic Conventions)
- OpenTelemetry for JavaScript
- OpenTelemetry Collector
- OpenTelemetry Demo project
- OpenTelemetry End User SIG
In fact, Dynatrace has a team dedicated to contributing to OpenTelemetry and ensuring that the Dynatrace platform integrates smoothly with OpenTelemetry data.
Dynatrace and OpenTelemetry together can deliver more value
OpenTelemetry is a key enabler in the observability space, providing a unified framework for collecting telemetry data. However, to unlock the full potential of this data and turn it into actionable insights, a powerful platform to manage, analyze, and visualize it effectively is essential.
Dynatrace is purpose-built to enhance OpenTelemetry’s capabilities. Data plus context are critical to supercharging observability, and with Dynatrace, you’re not just collecting data; you’re gaining a deep understanding of how your systems work and how to optimize them. With seamless integration, advanced analysis across telemetry data, insights into business outcomes, and predictive analytics spanning your entire stack, Dynatrace turns your OpenTelemetry data into actionable intelligence to optimize your systems.
Explore how Dynatrace can transform your OpenTelemetry data into a powerful driver of innovation and business success. Learn more with this video series on getting started with Dynatrace and OpenTelemetry.

Want to try Dynatrace with your OpenTelemetry data? Check out our free trial and walk through this Astronomy Shop demo to populate your own data.


Looking for answers?
Start a new discussion or ask for help in our Q&A forum.
Go to forum